Huimin Xie is a postgraduate student at the Department of Business Administration, University of Science and Technology of China. Her research mainly focuses on visual marketing and consumer behavior
Yina Li is a Special Researcher at the University of Science and Technology of China. She received her Ph.D. degree in Literature from Southeast University, and did postdoc research in Business School, Nankai University and Mays Business School, Texas A&M University. Her research mainly focuses on visual marketing, consumer self-control, and risk communication. She has published in reputable journals, including Psychology & Marketing, Journal of Business Research, Asian Pacifica Journal of Management, and Journal of Business and Industrial Marketing
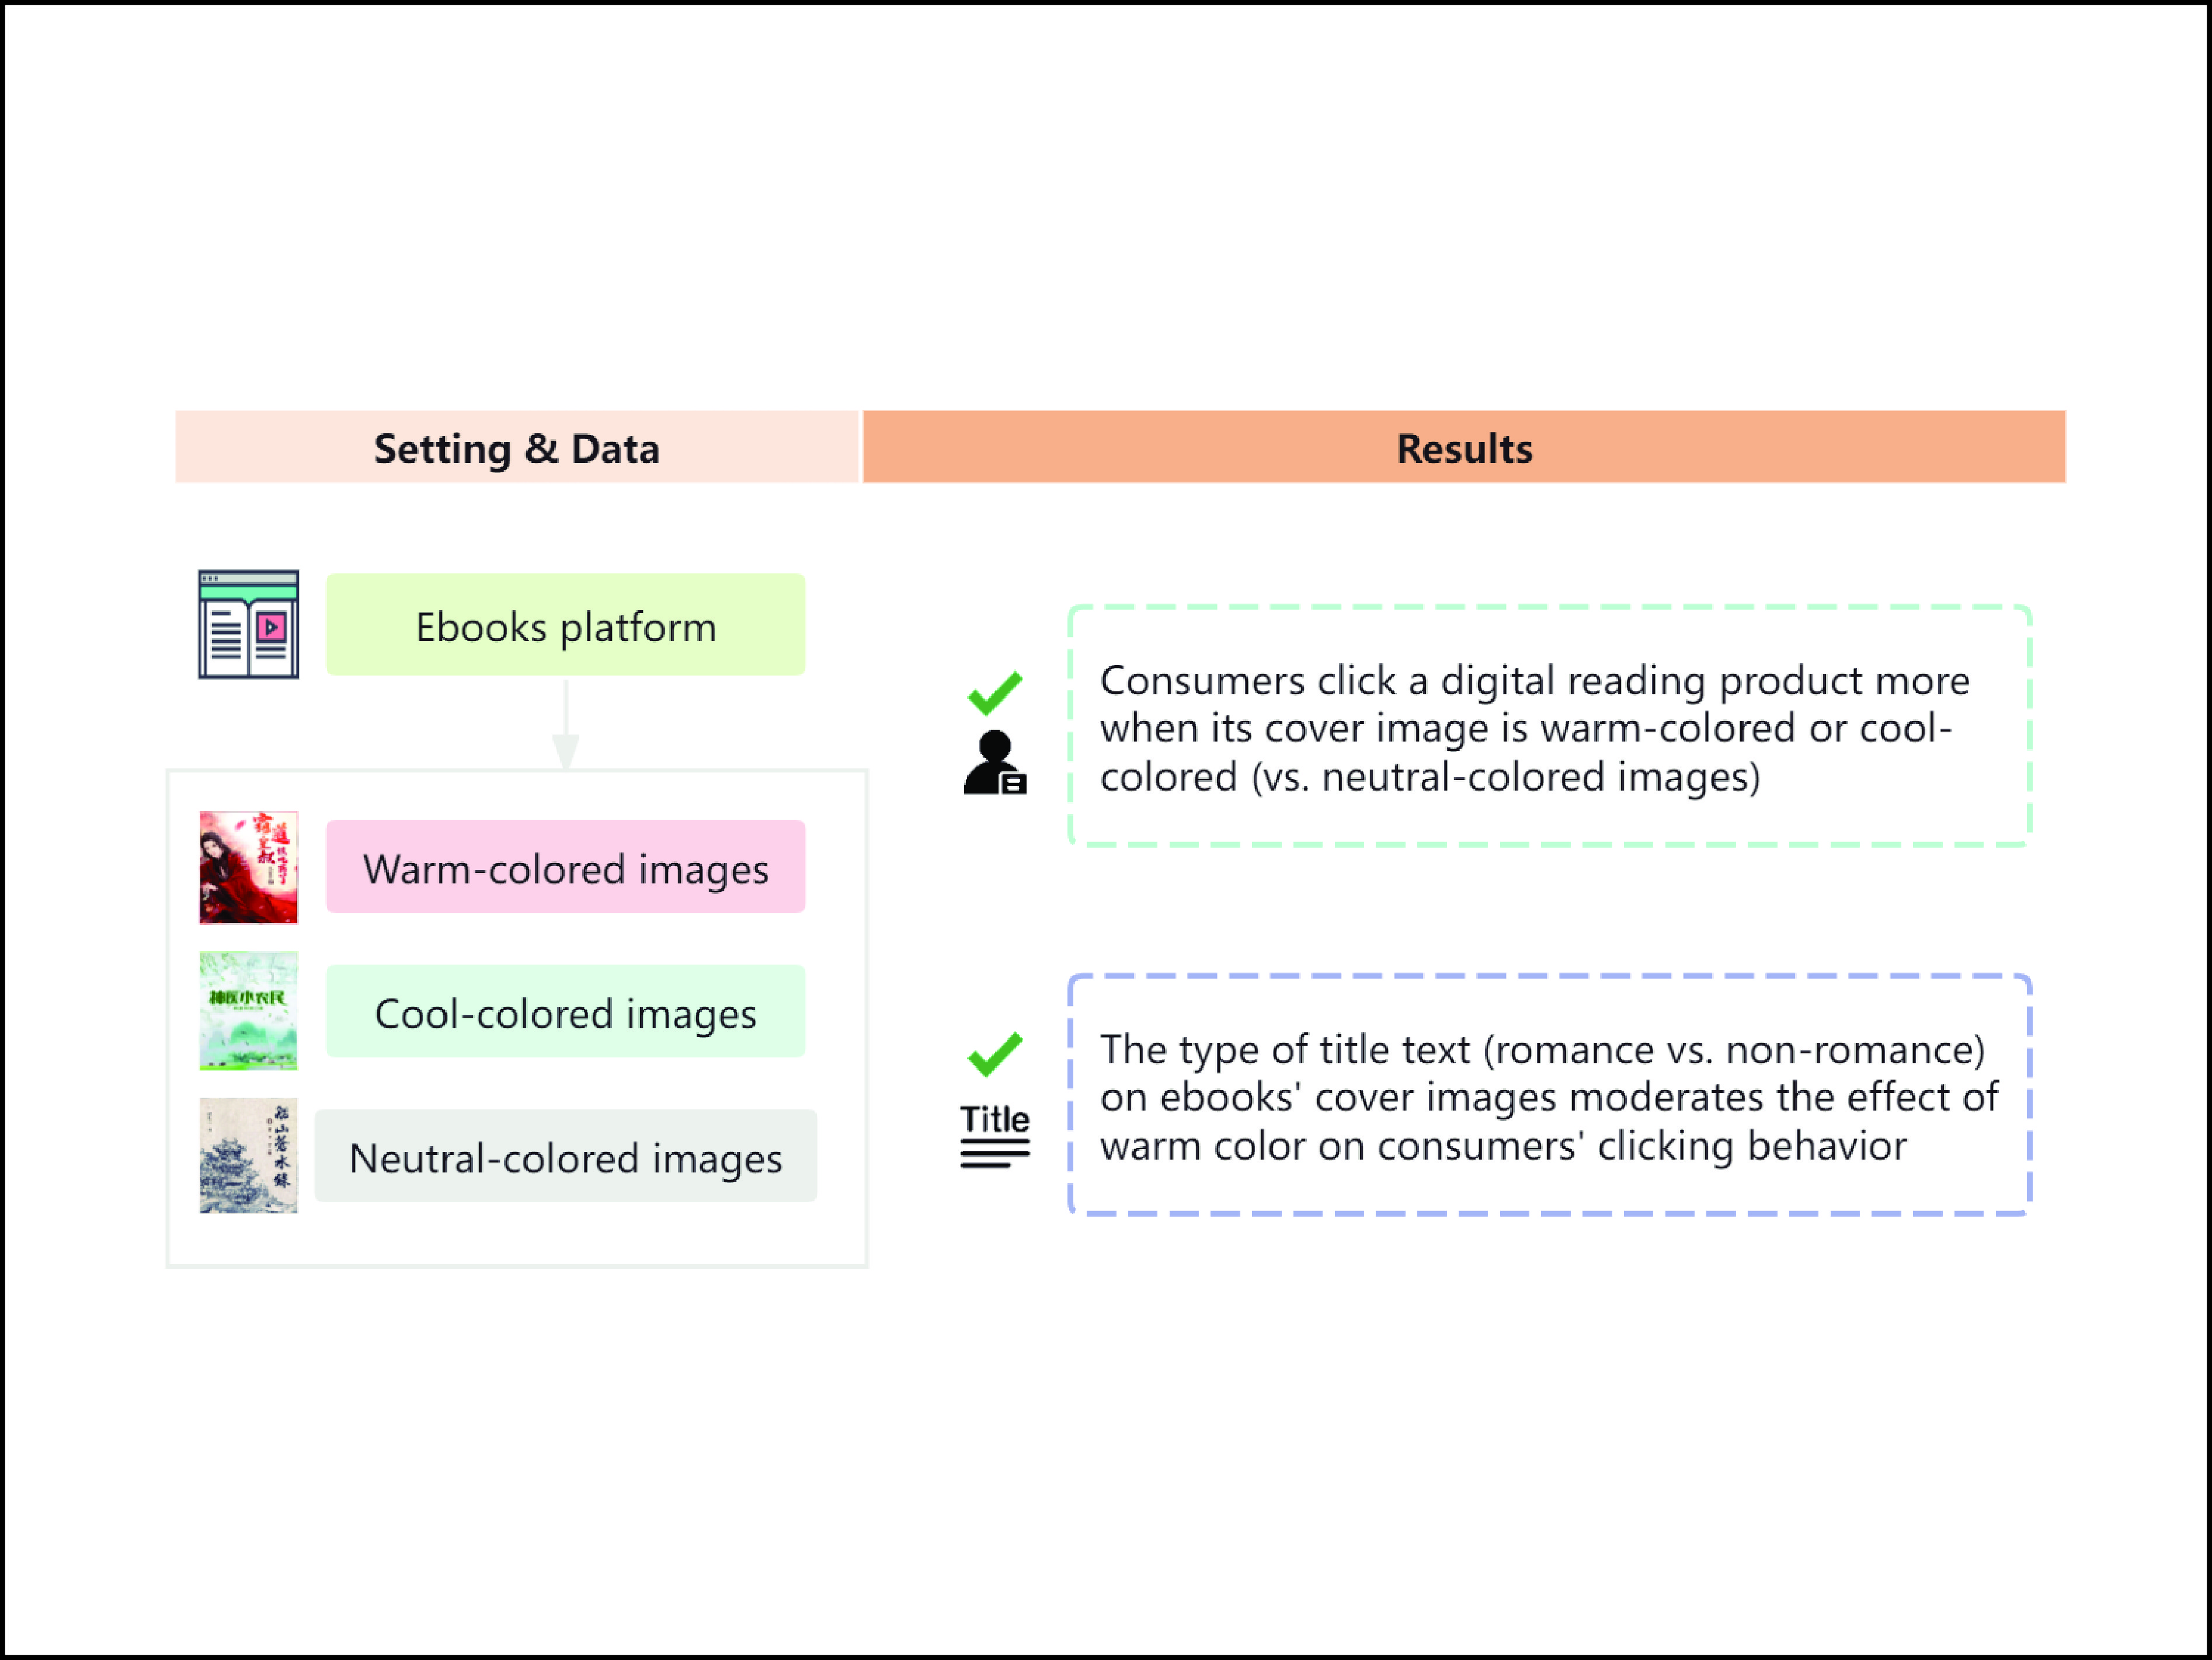
Color, classified as warm and cool colors, impacts consumers’ product selection. How the warm and cool dimensions of colors in polychromatic pictures impact consumers’ behavior in e-commerce platforms remains unexplored. This research examines the influences of warm and cool color combinations on consumers’ liking using polychromatic stimuli in a digital reading context using empirical evidence from over 200000 exposures to 423 books. As a result, warm and cool colors (vs. neutral colors) can enhance the click-through rate, and the romance theme of novels can enhance the positive effect to consumers of warm colors (vs. neutral colors). This research extends the findings using monochromatic stimuli and indicates a theme-based visual-product attribute congruence that enhances consumers’ trial-reading choice on the digital reading platform.
Graphical Abstract
The research data and results of this study.
Abstract
Color, classified as warm and cool colors, impacts consumers’ product selection. How the warm and cool dimensions of colors in polychromatic pictures impact consumers’ behavior in e-commerce platforms remains unexplored. This research examines the influences of warm and cool color combinations on consumers’ liking using polychromatic stimuli in a digital reading context using empirical evidence from over 200000 exposures to 423 books. As a result, warm and cool colors (vs. neutral colors) can enhance the click-through rate, and the romance theme of novels can enhance the positive effect to consumers of warm colors (vs. neutral colors). This research extends the findings using monochromatic stimuli and indicates a theme-based visual-product attribute congruence that enhances consumers’ trial-reading choice on the digital reading platform.
Public Summary
This study coded the hue composition of polychromatic pictures using a new method that enables the examination of warm and cool colors’ role in e-commerce.
This research highlights how color impacts the clicking-through of digital content products in e-commerce.
This research demonstrates how warm colors convey semantic meaning in the context of digital reading and how they enrich theme-based semantic interpretations.
Extreme weather, sea level rise, and environmental degradation have attracted the attention and focus of countries around the globe due to the rapid development of global industrialization and population growth[1]. Globally, numerous environmental policies have been implemented to combat climate change. Since 2015, one of the most important documents in the global response to climate change has been the Paris Agreement, which has been signed by 178 parties globally[2]. China has proposed a “double carbon” goal, which is to reach peak CO2 emissions by 2030 and attain carbon neutrality by 2060[3]. In China’s logistics industry, there is a conflict between the pursuit of economic development and environmental tolerance, and achieving a balance between the two is an issue that must be addressed immediately. Consequently, the purpose of this paper is to examine the factors that influence logistics companies to participate in green innovation and sustainable development, as well as how to improve their green awareness and technological capabilities to achieve green and sustainable development in China’s logistics industry. Many companies are still deficient in areas such as technology and product “green concentration” and must investigate additional green technologies and methods for achieving sustainability[4]. To achieve China’s “double carbon” objective, businesses must innovate and apply technology to increase the efficiency of resource utilization, reduce energy consumption and carbon emissions, and create a stable, dependable, and environmentally friendly operating environment for the future of green logistics.
With the advent of the global digital surge, businesses will inevitably have to follow the current trend and re-examine and upgrade their existing business models to enhance their competitiveness and innovation capabilities. Digital transformation not only enhances the productivity and operational efficiency of businesses[5–6] but also provides new opportunities and impetus for businesses to achieve leapfrogging and attain competitive advantage[7–8]. In addition, digital transformation facilitates green innovation in businesses by optimizing production processes, enhancing resource utilization and energy efficiency, and constructing an information-based green supply chain. However, few studies have investigated the impact of the new dynamics of digital transformation created by the profound integration of digitalization and logistics enterprises on the green innovation of logistics enterprises, and even fewer have elucidated the underlying mechanism of action. Consequently, an in-depth investigation of how digital transformation plays a specific role in the green innovation of logistics companies will be essential for enhancing the strategic planning and sustainable development of green development in the logistics industry.
China’s logistics industry ranks 20th in the world, according to the Logistics Performance Index report 2023 published by the World Bank. It has become a globally competitive and advantageous sector. China’s logistics industry has a large development space, a large market share, and a unique geographical and demographic advantage, which gives it strong competitiveness in the international market with rapid, efficient, and convenient service standards. Despite the rapid expansion of the Chinese logistics industry, it also faces significant environmental pollution issues. Specifically, the three issues listed below exist. ① Logistics and conveyance vehicles require a substantial amount of petroleum to maintain normal operations. A large quantity of fuel also produces a large quantity of exhaust gas and exhaust emissions[9]. Nitrogen oxides, sulfur dioxide, hydrocarbons, and other hazardous substances emitted by transport vehicles in the logistics industry have become among the most significant sources of air pollution in China’s urban areas, exerting enormous pressure on the atmosphere. ② Logistics companies will generate waste and dust as a natural byproduct of their operations, and the disposal of this waste and dust will have a negative impact on environmental quality. Currently, environmental protection policies are becoming more stringent, but there are still businesses that are “dumping” refuse and pollution. ③ The loading and unloading of commodities, storage, and other logistics operations necessitate operations and mechanical vibrations that generate a great deal of noise. Simultaneously, the chemicals and pollution control apparatus utilized by logistics companies produce waste water and waste liquids, which have an impact on the surrounding environment. China has not only made remarkable advancements in the field of hardware devices and software applications as a result of the accelerated development of digital technology in recent years, but a number of new digital technology enterprises and innovation platforms have also emerged. China is endeavoring to promote the deployment of digital technology in the real sector and the industrial structure for high-end, intelligent, and environmentally friendly manufacturing. Exploring the relationship between digital transformation and green innovation in the logistics sector based on China’s experience will therefore have implications for the green development of the logistics sector in other nations. In this paper, using a sample of Chinese A-share listed companies in the logistics industry from 2010 to 2021, we find that digital transformation significantly increases firms’ green innovation. Digital transformation promotes green innovation by alleviating firms’ financing constraints and reducing environmental uncertainty. Further analysis shows that geographical distribution and the nature of the logistics industry affect the effect of digitalization on green innovation.
The rest of the paper is organized as follows. Section 2 details the literature review and theoretical assumptions. Section 3 presents the data sources, sample selection, variable measures, and models. Section 4 reveals the rich empirical results and a discussion of the main regression results. Section 5 presents the potential mechanisms of action. The final section summarizes the findings of the study in detail and provides recommendations.
2.
Literature review and hypotheses
2.1
Literature review
There has been a proliferation of academic research on enterprise digitization in recent years. The influence of digital transformation on corporate green innovation is a popular topic of academic discussion. In a broad sense, digital technology encompasses wearable devices, the Internet of Things, big data analytics, sensor technology, cloud computing, artificial intelligence, and more. These technologies are used in new ways in the production processes, business concepts, and management strategies of businesses in a variety of industries and have become an integral part of the industry’s evolution. Studies on digitization to date include but are not limited to the division of labor[10, 11], performance[12–14], input‒output efficiency [15–17], firm value[18, 19], capital market performance[20–22], etc. Specifically, digital technology has made the automation of many tasks possible while also facilitating more convenient remote collaboration, thereby changing the way work is organized[23]. In other words, in certain repetitive and routine tasks, machines can take over, allowing individuals to focus more on innovative and complex work. Teams can use online collaboration platforms to share information in real time, collaborate on tasks, overcome geographical constraints and promote the global division of labor. Digitalization provides the capability for real-time data analysis, allowing businesses to have a timely understanding of their operations and make quicker and more accurate decisions, thereby improving performance[24]. The application of digital technology in production and supply chain management has increased production efficiency and logistics management efficiency. Technologies, such as smart manufacturing, the Internet of Things (IoT), and big data analytics, enable businesses to better optimize production processes and reduce waste[25]. Digital technology contributes to building closer, more personalized customer relationships, enhancing customer loyalty, and playing a positive role in the long-term stable growth of enterprise value[26]. Digitalization enhances the transparency of business information, enabling investors to more accurately evaluate corporate performance[27]. The widespread use of digital tools facilitates the rapid flow of information, contributing to the efficiency of capital markets[28]. Overall, the impact of digitalization is positive in various aspects, enhancing efficiency and innovation and creating greater value for businesses.
However, the literature on the impact of digital transformation on corporate green innovation is relatively rare and fragmented. By reviewing a large amount of literature, we find that the promotion of corporate digitalization for green innovation[29–32] is focused on studies of all listed companies or survey databases. Only a few scholars have conducted in-depth studies of subsectors, mainly focusing on manufacturing industries[33, 34] and heavily polluting industries[35–37]. In the literature with a sample of listed manufacturing companies, the impact of digital transformation on the level of corporate green innovation has usually been tested empirically based on a green technology innovation perspective and using textual analysis methods. They not only found that digital transformation can significantly improve the level of green innovation and the output of green innovation[34] but also discovered that manufacturing firms can formulate optimization solutions to environmental problems based on big data analysis technology, alleviate pressure on natural resources, and promote green innovation[38]. In the literature with a sample of heavily polluting enterprises, the study concluded that enterprise digitization could promote enterprise green technology innovation by enabling enterprise information sharing and knowledge integration[39] and contribute to an increase in green patent applications in heavily polluting enterprises. They focused on the “data-driven” and “capability curse” effects of digital transformation on the strategic upgrading of green innovation, and the combination of the two potential mechanisms made the interaction between them a strategic paradox.
In conclusion, there are few studies on the direct relationship between the digital transformation of enterprises in the logistics industry and enterprise innovation. However, it cannot be overlooked that the digital transformation and green innovation of enterprises in the logistics industry are always related to industrial structure upgrading and high-quality development. Therefore, it is essential to examine the relationship between corporate digital transformation and corporate green innovation from the logistics industry’s perspective. This paper analyses the impact of enterprise digital transformation on enterprise green innovation using logistics firms as research samples. In addition, we reveal the impact mechanism of digital transformation on enterprise green innovation from the perspectives of financing constraints and environmental uncertainty and conduct a heterogeneity analysis based on geographical distribution and industry classification to provide references for the digital transformation of logistics enterprises.
2.2
Hypotheses
Resource-based theory assumes that firms have heterogeneous resources, and this heterogeneity precisely determines the differentiation of their competitiveness. The competitive advantage of an enterprise comes from special heterogeneous resources, and green innovation is an effective way to create heterogeneous resources, which will be the inexhaustible power to maintain a sustainable competitive advantage[40]. In addition, according to endogenous growth theory, endogenous technological progress is the fundamental way to promote high-quality economic development. Digitalization, as a typical representative of technological progress, will play a role in improving existing technologies and accomplishing technological innovation autonomously[41].
Modern construction and the collaborative development of supply chains are the direction of development for modern logistics companies. Digital technology use has fundamentally altered the business management structure of the transportation, postal storage, and other transportation agency industries. Enterprise digitalization will result in a series of corporate transformations and upgrades, including the reduction of production costs, the improvement of clean technology, and the optimization of resource allocation. At the same time, the enterprise’s own technology and knowledge accumulation will also be significantly enhanced during this process. Green technology innovation will bring different comparative advantages to enterprises, among which green process innovation is applied in the production process to optimize the rational allocation of resources, promote the technological progress of enterprises and create advanced technological advantages. The application of green product innovation in product design can advance the idea of environmental protection while also increasing the market share of corporate products and the market’s competitive advantage. On the one hand, the digital technology utilized by enterprises can gather all the information in the production process for data screening, integration, and analysis, which will effectively assist managers in rational and scientific business decision analysis. On the other hand, enterprises can utilize digitalization not only to promote the interconnection of internal departments but also to build a mutually collaborative innovation sharing network with upstream and downstream enterprises[42]. Thus, we propose the following:
Hypothesis 1. The relationship between digital transformation and green innovation in logistics companies is significantly positive.
Innovation activities are characterized by high failure rates, high capital requirements, and long cycle times, as well as high challenge and uncertainty[43, 44], especially for green innovation projects. Companies need to make capital investments to carry out a series of transformations and upgrades, but if they do not have sufficient cash flow, they will increasingly turn to external funding to carry out their activity projects. In contrast, enterprises without access to financial support can only engage in a limited amount of investment activities in this environment of information asymmetry; therefore, they will prefer investments that are profitable in the short term[45]. In this way, funding becomes a key factor in green innovation for enterprises. Therefore, to promote the sustainable development of logistics enterprises, active participation in high-value returns and long-term green investment and to alleviate the pressure of enterprise financing have become practical approaches.
The complex information environment creates barriers to investors’ understanding of the firm and undermines their trust in the firm[46]. The digital transformation of enterprises can be understood as an exploration of the path to sustainable development. It helps enterprises make better use of cutting-edge technology, such as big data and artificial intelligence, to improve resource management efficiency in all aspects[47], optimize resource allocation, and deliver more accurate and transparent information. These information advantages brought about by digitization reduce the cost and information asymmetry for enterprises seeking external funding and help investors assess the value of the enterprises, which eases the burden of corporate financing restrictions. Thus, we propose the following:
Hypothesis 2. The digital transformation of logistics enterprises can ease the pressure of financing constraints, broaden financing channels, and thus promote green innovation.
Enterprise digitalization, as a resource input activity or even an innovation activity of enterprises, is bound to face certain market risks, so environmental uncertainty will profoundly affect the dynamics and sustainability of enterprise digital transformation[48]. The impact of environmental uncertainty on investment decisions may manifest as a decrease or increase in the size of the investment[49, 50]. The greater the environmental uncertainty is, the more difficult it will be for business decision makers to assess investment behavior, which will make investors more cautious of investment behavior[51]. At the same time, the greater the environmental uncertainty is, the greater the likelihood of unexpected events, and the more cash firms will set aside to address future risks[52]. Based on the above analysis, enterprises may invest less in green R&D when they face environmental uncertainty and are unable to sustain their R&D output and innovation knowledge transformation.
Generally, in situations of environmental uncertainty, firms are more willing to seek strategic change, tend to pursue riskier innovative activities, and enhance their dynamic capacities to seek environmental adaptability[53, 54]. The digital transformation of enterprises in response to the complex external environment can enhance their ability to accelerate their adaptation to this environment according to their own conditions, enhance the dynamics of sustainable development[55], and improve their innovation capacity[56]. At the same time, in a highly uncertain environment, a digitally transformed enterprise may not only face the external threats that form the development process of the enterprise but also help the enterprise obtain an opportunity to improve its competitive advantage and close the gap with its peers, thus realizing their vision of themselves[57]. Green innovation provides firms with a unique competitive advantage, while digital transformation captures market information, improves firms’ ability to take risks [58], and promotes more green investment. Thus, we propose the following:
Hypothesis 3. The digital transformation of logistics enterprises can promote green innovation by narrowing the gap in environmental uncertainty between enterprises.
3.
Research and data methodology
3.1
Research methodology
The following model was created to investigate the connection between the level of digital transformation of logistics companies and corporate green innovation:
Grepatit=α+β1Dcgit+β∑Controlsit+μi+νt+εit,
where i stands for the company and t for the year. The dependent variable of interest, denoted by Grepatit, is a series of green patent innovation outcomes, including Grepatit, Gre_inv, and Gre_use, captured by the logarithm of green patents +1, green invention patents +1, and green utility patents +1, respectively. Dcgit is the primary independent variable, representing the level of digital transformation of enterprise i in year t. ∑Controlsit represents a set of variables controlling for the characteristics of firm i in year t. μi and νt are the firm fixed and time fixed effects, respectively, and εit is an idiosyncratic error term. In this paper, we focus on the coefficient Dcgit, which is β1. β1 indicates the impact of the degree of digital transformation of logistics enterprises on corporate green innovation, and if it is significantly positive, it indicates that it is in line with expectations.
3.2
Data methodology
3.2.1
Dependent variables
According to the purpose of this study, the output of green patents is the primary metric used in the literature to assess green innovation. Referring to the approach used by Wen et al.[59] and Liu et al.[32], this research primarily employs the quantity of green patent applications to gauge the degree of green innovation. To explore the role of the digital transformation of logistics enterprises in different types of green innovation, this paper also divides green patents into green invention patents and green utility model patents, denoted by Gre_inv and Gre_use, respectively.
3.2.2
Independent variables
There is no standard way to measure the level of enterprise digitization. In this study, we adopt a method commonly used in academia to measure the level of digitization of a company by extracting keywords from the text to obtain word frequency. Specifically, Yang et al.[60] obtained the annual reports of listed logistics companies through the Python crawler and extracted all the text content through the Java PDFbox library. After identifying the keyword lexicon, the keywords in the extracted text content were counted using Python for word frequency and summed for calculation.
3.2.3
Mechanistic variables
Financing constraints and corporate environmental uncertainty are selected as mechanistic variables explored in this paper. Here, the financing constraint is referenced to Hadlock and Pierce[61], using the SA index as a measure of the level of financing constraint. There are many measures of financing constraints, but most of them rely on financial indicators that are endogenous rather than directly related to financing constraints, which may bias the findings. To avoid this shortcoming, Hadlock and Pierce[61] redesigned the financing constraint variable (the SA index).
SA=−0.727∗Size+0.043∗Size2−0.040∗Age,
where Size is the natural logarithm of firm size (in millions of dollars) and Age is when the company was founded.
Referring to Shen et al.[62], the EU index is used as a proxy variable to measure environmental uncertainty for firms in this paper. The EU is a measure of environmental uncertainty. Environmental uncertainty can be measured by fluctuations in a company’s performance, as the root cause of environmental uncertainty exists in the external environment, and changes in the external environment will cause fluctuations in a company’s core business activities and ultimately fluctuations in the company’s sales revenue. The standard deviation of sales revenue over the past five years and industry-adjusted values were used to measure the environmental uncertainty of the firm. However, a portion of the variation in sales revenue over the past five years is attributed to the steady growth of the company. Therefore, to measure environmental uncertainty more accurately, it is necessary to exclude the portion of steady growth in sales revenue, i.e., each firm applies the data from the past five years and runs the following model using ordinary least squares (OLS) to estimate the abnormal sales revenue for each of the past five years separately: Sale=μ0+ρ1Year+ε, where Sale is the sales revenue; Year is the yearly variable; the standard deviation of the firm’s abnormal sales revenues over the past five years is calculated and divided by the average of the past five years’ sales revenues to obtain the unadjusted environmental uncertainty; the environmental uncertainty in the same year is estimated as the average of the past five years’ sales revenues; and the environmental uncertainty in the same year is estimated as the average of the past five years’ sales revenues. The median of the unadjusted environmental uncertainty of all firms in the same industry in the same year is the industry environmental uncertainty, and then the unadjusted environmental uncertainty of each firm is divided by the industry environmental uncertainty to obtain the firm’s industry-adjusted environmental uncertainty, which is the environmental uncertainty (EU) used in this paper.
3.2.4
Control variables
The control variables in this paper mainly include firm size (Size), firm age (Age), the gearing ratio (LEV), the book-to-market ratio (BM), the return on net assets (ROE), the nature of ownership (SOE), dual office attributes (Dual), board independence (POID) and the shareholding of the first largest shareholder (First). Meanwhile, this paper controls for firm fixed and annual fixed effects and performs firm-level clustering of robust standard errors.
The variable definitions are presented in Table 1.
Table
1.
Variable definitions.
Symbol
Variables
Definition
Green innovation
Grepat
Log(Number of green patent applications + 1)
Gre_inv
Log(Number of green invention patent applications + 1)
Gre_use
Log(Number of green utility model patent applications + 1)
Digitalization of enterprises
Dcg
Log(Frequency of specific words in corporate annual reports + 1)
Financing constraints
SA
SA index
Uncertainty in the business environment
EU
EU index
Enterprise size
Size
Log(Total assets for the year)
Year of enterprise
Age
Log(current year – year of enterprise establishment + 1)
Gearing ratio
Lev
(Total liabilities / Total market capitalization)*100
Book-to-market ratio
BM
(Shareholders’ equity / Total market capitalization)*100
Return on net assets
ROE
Net profit / Shareholders’ equity
State-owned enterprises
SOE
State-owned enterprises are assigned 1, otherwise 0
Dual role of board chairperson
Dual
Enterprises with dual role of board chairperson are assigned 1, otherwise 0
Board independence
POID
Percentage of independent directors
Shareholding of the largest shareholder
First
Percentage of shareholding of the largest shareholder
In this paper, the logistics industry is defined as follows: the China Securities Regulatory Commission (CSRC) does not have a separate classification for the logistics industry in the 2012 edition of the industry classification. Referring to Hong et al. [63] and Liu et al. [64], companies engaged in logistics-related businesses, such as transportation, warehousing, and postal delivery, are typically referred to as logistics companies. The research samples for this paper are listed Chinese logistics companies, and the sample period is 2010–2021. The data used in this paper are obtained from the CNRDS, the CSMAR database, and the notes to the relevant company annual reports. This study eliminates samples for which important variables are missing, yielding 117 logistics companies’ firm-year observations.
4.
Empirical results
4.1
Descriptive statistics
Table 2 reports the results of the descriptive statistics for the main variables. The mean values of Grepat, Gre_inv, and Gre_use are 0.465, 0.311, and 0.283, respectively. The minimum values are 0, the maximum values are 5.088, 5.075, and 3.401, and the standard deviations are approximately 0.895, 0.734, and 0.633, respectively, which indicates that there is a significant difference in the level of green innovation among different firms. The mean value of Dcg is approximately 1.246, ranging from 0 to 6.091, which is largely consistent with the results of existing studies[65], indicating wide variation in the level of digitization of companies.
Table 3 reports the results of the regression analysis of the effect of corporate digital transformation on green innovation. As shown in column (1) of Table 3, the estimated coefficient of Dcg is 0.1106 at the 1% level of significance after the inclusion of the relevant control variables, year and firm fixed effects, which indicates that digital transformation significantly improves the level of green innovation. Furthermore, as shown in columns (2) and (3), the estimated coefficient of Dcg is positive and at least 5% significant. After controlling for other factors, each standard deviation increase in the level of digital transformation of logistics companies drives up the level of green innovation, green invention innovation and green utility patents by 28.85%, 30.23% and 32.40%, respectively. Thus, the above empirical results validate our research hypothesis.
Table
3.
Regression results of enterprise digital transformation on Grepat, Gre_inv and Gre_use.
(1)
(2)
(3)
Grepat
Gre_inv
Gre_use
Dcg
0.1106***
0.0775**
0.0756***
(3.24)
(2.54)
(2.72)
Size
0.6722***
0.6776***
0.1975**
(3.46)
(3.44)
(2.24)
Age
0.3640
0.3849
0.1350
(1.18)
(1.25)
(0.90)
Lev
0.0514
0.0277
0.0806
(0.60)
(0.41)
(1.14)
BM
−0.1588
−0.1807**
−0.0161
(−1.52)
(−1.99)
(−0.21)
ROE
−0.0120**
−0.0091**
−0.0068**
(−2.41)
(−2.03)
(−2.31)
SOE
−0.0530
−0.0250
−0.0248
(−0.17)
(−0.09)
(−0.16)
Dual
0.1902**
0.2085**
0.0644
(2.08)
(2.41)
(1.39)
POID
0.5708
0.6388
0.3013
(0.78)
(0.97)
(0.63)
First
−0.7148
−0.5656
−0.5748
(−1.39)
(−1.29)
(−1.64)
Firm
YES
YES
YES
Year
YES
YES
YES
N
1099
1099
1099
Adj. R2
0.5660
0.5369
0.4765
Standard errors are shown inside the parentheses. *, **, and *** indicate significance at the 10%, 5%, and 1% levels, respectively. Unless otherwise specified, the meanings in Tables 3–8 are the same.
4.3.1
Alternative measure of digital transformation
We take the average of digital transformation as the standard and assign a value of 0 to companies whose digital level is below the average and 1 otherwise. In column (1) of Table 4, the coefficient of Dcg is still significantly positive, indicating that digital transformation improves the level of green innovation, and our results are robust.
In addition, we adjust the digital transformation index construction and keyword selection and use it for robustness analysis. In particular, we used a similar word expansion method to expand the digitized keyword set on top of the digitized seed words, resulting in a digitized word set containing 99 digitized keywords. We use the number of expanded digitized words to measure digital transformation. According to our baseline results, the results in column (2) of Table 4 show that digital transformation significantly improves green innovation, and our results are robust.
4.3.2
Exchanging models
In this paper, we refer to Faleye et al. [66] to re-examine the impact of the digitalization of logistics firms on corporate green innovation using the Tobit model and the negative binomial distribution model. In columns (3) and (4) of Table 4, digital transformation significantly promotes green innovation, which suggests that our results are robust.
4.3.3
Winsorizing at the 1% and 99% levels
Outliers in the data may have an impact on the empirical results. To ensure the robustness of the empirical results, all continuous variables in this paper are winsorized at the 1% and 99% levels. The results in column (5) of Table 4 show that digital t-formation significantly improves green innovation according to our baseline results, indicating that our findings are robust.
4.3.4
Adding other fixed effects
This paper controls for year and firm fixed effects in the baseline test analysis, but the omission of unobservable factors at the industry and regional levels may introduce bias into the empirical results. Therefore, the paper further adjusts for fixed effects by including the cross-product term of industry-year and the cross-product term of city-year to further tighten the control of fixed effects and thus remove the confounding effect of omitted variables. The results in Table 5 show that digital transformation significantly improves green innovation after we control for other fixed effects, indicating that our findings are robust.
To address the quality of green innovation, this paper collected data on green patent grants from listed companies. As shown in Table 6, the digital transformation of logistics companies has a significant positive impact on the quantity of green patent grants and the number of practical green patents. In other words, the digitization of logistics companies not only enhances the "quantity" of corporate green innovation but also advances the "quality" of green patents.
As companies in the logistics industry have different conditions at the beginning of their digital transformation, the impact of companies undertaking digital transformation on green innovation is a choice made by the companies themselves. In this paper, we refer to He and Chen [67] to use propensity score matching to further mitigate possible endogeneity problems. Specifically, firms with digitization levels higher than this median are considered the treatment group, while the others are the control group. We calculate the propensity scores according to the variables of firm size (size), firm age (age), book-to-market ratio (bm), nature of firm ownership (soe), dual employment attribute (dual), percentage of independent directors (poid), and percentage of top shareholders (first) as covariates and use the 1:1 nearest neighbor matching principle. The results are shown in Table 7. The propensity score matching results satisfy the "equilibrium assumption" of the PSM. The results of the average treatment effect (ATT) test are also reported. The ATT value of the explanatory variables is positive after matching and passes the test at the 5% level of significance, indicating that the average treatment effect of the experimental group is significant. This means that the digital transformation of logistics enterprises can significantly promote the green innovation of enterprises. The paired regression results are shown in column (3) of Table 8, and the regression coefficient is found to be significantly positive at the 5% level, indicating that the digitalization level of logistics enterprises significantly contributes to the level of corporate green innovation, which is consistent with the benchmark regression and still supports the original conclusion.
Referring to Wu et al.[22], we choose the average level of digital transformation of enterprises in the same industry and year in the region as an instrumental variable. In general, the digital development level of the industry in the region where the enterprise is located affects the enterprise’s own digitalization level, which satisfies the relevance condition; meanwhile, the digital development level of enterprises in the same industry in the region does not directly affect the enterprise’s green innovation level, which satisfies the exogeneity condition. After retesting, columns (1) and (2) of Table 8 report the results of the IV-2SLS test, where the regression coefficient of IV in the first-stage regression is significantly positive at the 1% level, indicating that it satisfies the correlation condition. Meanwhile, the Kleibergen‒Paap rk LM statistic is 51.580, which rejects the original hypothesis of insufficient identification of instrumental variables at the 1% level; the Cragg-Donald Wald F statistic is greater than the critical value of the Stock-Yogo weak instrumental variable identification test at the 10% significance level, which rejects the original hypothesis of weak instrumental variables, so the selected instrumental variables are reasonable. In the second stage, the coefficients of the core explanatory variables are significantly positive at the 5% level, still indicating that the digital transformation of logistics firms significantly contributes to their green innovation, and the findings remain robust and reliable.
4.5
Heterogeneity analyses
4.5.1
Corporate location heterogeneity
The spatial evolution of logistics enterprises reflects the location choice and spatial process of logistics economic activities, while the development of logistics enterprises has a strong correlation with the development of urban clusters [68]. Can the digital transformation of enterprises play a better role in different geographically distributed regions? To test this conjecture, this paper divides the subsample into three subsamples based on the registered location of logistics enterprises into eastern, central and western regions and conducts subsample regression. Columns (1)–(3) of Table 9 report the regression results, and it can be seen that there is indeed heterogeneity in the effect of the digital transformation of logistics enterprises on enterprise green innovation by enterprise geographic location. The digital transformation of logistics enterprises has a more significant impact on corporate green innovation in the eastern and central regions than in the western region, and the promotion effect is most pronounced in the eastern region. This is consistent with the findings that the impacts of geographic location on the transformation and upgrading of logistics enterprises are different[69], and the upgrading of logistics enterprises in the eastern coastal zone and the central zone is faster than that in the western zone, which coincides with the economic development of each region [70]. This may be because the Middle East, with its superior economic development, possesses the infrastructure and sufficient human resources to meet the requirements for digital transformation and provide continuous and robust support for enterprise green innovation activities[71]. Compared to the eastern region, the western region has a considerable urban development status disparity, which provides comparatively less incentive for businesses to engage in digital transformation. Consequently, there is geographical heterogeneity in the effect of digital transformation on green innovation among businesses.
The characteristics of industries usually have different effects on their R&D investment and green technology progress. Therefore, the overall sample can be divided into three subsamples—transportation industry, postal storage industry, and transportation agency industry—and subsample regressions can be run. Columns (4)–(6) of Table 9 report the regression results, which show that the digital transformation of logistics enterprises is strongly heterogeneous in terms of the nature of logistics enterprise industries in terms of corporate green innovation. Compared with those of the transportation agency industry, the digital transformation of logistics enterprises has more significant effects on corporate green innovation in the transportation and postal storage industries, and the transportation industry has the most significant contribution. This may be because logistics companies with a transportation focus hold an essential position in the logistics industry [72]. According to data from the Ministry of Transport, road transport accounted for approximately 75% of the product transit industry in 2021. In addition, the realization of green development in the transportation industry is a crucial component of the logistics industry’s green development, and the digital transformation of logistics enterprises in the transportation industry will decisively determine the development direction of logistics enterprises[73]. Consequently, there is heterogeneity within the industry in terms of the impact of the digital transformation of businesses on green innovation.
5.
Potential mechanism analysis
This paper uses the SA index as a proxy variable to measure the financing constraints of a firm. A higher SA value indicates more severe financing constraints on a firm. The full sample is divided into two subsamples, one with high financing constraints and one with low financing constraints, according to the median financing constraints, and regression analysis is performed. Columns (1) and (2) of Table 10 report the regression results, which show that the coefficients of the core explanatory variables in the sample group with low financing constraints are nonsignificant, while the coefficients of the core explanatory variables in the sample group with high financing constraints are significantly positive at the 1% level. The above results indicate that the digital transformation of logistics enterprises makes a more significant contribution to their green innovation among enterprises with higher financing constraints than among those with low financing constraints. Therefore, the digital transformation of logistics enterprises promotes green innovation by reducing the financing pressure on enterprises, widening financing channels, and alleviating financing constraints.
This paper uses the EU index as a proxy variable to measure the environmental uncertainty of firms. A higher EU value indicates more serious environmental uncertainty. The full sample is divided into two subsamples of high uncertainty and low uncertainty according to the 25th percentile of environmental uncertainty, and regression analysis is performed. Columns (3) and (4) of Table 10 report the regression results, which show that the coefficients of the core explanatory variables are not significant in the low uncertainty sample group, and the coefficients of the core explanatory variables are significantly positive at the 1% level in the high uncertainty sample group. The above results indicate that the digital transformation of logistics firms makes a more significant contribution to their green innovation in firms with high environmental uncertainty than in those with low environmental uncertainty. Therefore, digital transformation is an exploration of the uncertainty faced by logistics enterprises to narrow the gap in environmental uncertainty between enterprises, thus promoting green innovation.
6.
Conclusions and policy implications
6.1
Conclusions
Green innovation is an inexhaustible propelling force for the logistics industry to achieve green and sustainable development, and the digital transformation of logistics enterprises is a crucial path for the logistics industry to undertake industrial structure upgrading. The analysis of the impact of the digital transformation of logistics enterprises on corporate green innovation will serve as a key reference point for the digital transformation of logistics enterprises. This paper empirically investigates the effect of logistics enterprises’ digital transformation on corporate green innovation, examines the potential mechanisms involved using samples of listed logistics enterprises between 2010 and 2021, and reaches the following conclusions: the digital transformation of logistics enterprises can substantially increase their capacity for ecological innovation. In other words, the effect of digital transformation on a company’s capacity for green innovation becomes more pronounced as its level of digital transformation increases. In terms of the mechanism of action, the digital transformation of businesses can broaden financing channels and alleviate financing pressure by leveraging the benefits of their own technology. It also improves businesses’ capacity for green innovation by reducing environmental uncertainty and closing the industry gap. Regarding heterogeneity, the digital transformation of logistics enterprises has distinct effects on corporate green innovation based on the geographic location of the enterprise and industry characteristics. In general, the role of enterprise digitization is clearer for green innovation in eastern transportation logistics businesses.
6.2
Policy implications
In light of the aforementioned findings, the following suggestions are made in the paper:
(Ⅰ) Accelerate the establishment of digital infrastructure.
If the logistics industry invests in plenty of supporting infrastructure for digital construction, this will hasten the establishment of the industry’s digital collaboration network, thus achieving the sustainable development goal of reducing costs and increasing efficiency in the logistics industry. Specifically, the industry learns cutting-edge digital technology and introduces pertinent technical talent to fully exploit the benefits and potential brought about by digitalization, which can open up digital communication channels for the logistics industry and promote data collaboration and sharing among industry enterprises, thus providing inexhaustible power for logistics enterprises to undergo digital transformation.
(Ⅱ) Industry-leading enterprises should be encouraged to help other enterprises and reinvent them.
The leading enterprises in the logistics industry help drive the digital transformation of small and medium-sized logistics companies, which will help the industry develop synergistically and create a positive competitive environment. Specifically, the digital transformation of enterprises depends to a large extent on the state of their own development. Enterprises with suitable development environments have significantly greater strength and determination than other enterprises to embark on digital transformation. The leading enterprises provide guidance to small and medium-sized logistics enterprises by leveraging their strengths, optimizing their production and management processes, integrating resources to improve innovation and providing strong support to small and medium-sized logistics enterprises in their sustainable digital transformation.
(Ⅲ) Narrow the gap of uneven development between regions.
The digital transformation of logistics enterprises reflects the level of local digital construction, and the development status of cities plays an important role in the digital transformation of enterprises. Specifically, it is necessary to accelerate infrastructure construction in the western region, promote the technological upgrading of urban industries, improve the policies of government-supported enterprises, supplement key shortcomings, and strengthen the partnership between the government and the market to narrow the gap of unbalanced development between regions and better promote the digital transformation of enterprises.
(Ⅳ) The financial support tools for logistics enterprises should be optimized.
The rapid development of the digital transformation of logistics enterprises requires the creation of a good logistics finance environment, which will assist in broadening the financing channels of enterprises and developing green logistics enterprises to the fullest extent. Specifically, financial institutions carry out corresponding demand services to support the digital transformation of logistics enterprises, provide various forms of credit business, insurance, and financial leasing business, and encourage the collaboration of digital supply chain finance platforms. The application of financial support, such as providing digital risk assessment financial services for logistics enterprises, providing corresponding policies or credit guarantees for well-qualified enterprises, and setting up industrial investment funds for the development of green logistics enterprises, should be promoted.
Acknowledgements
This work was supported by the National Natural Science Foundation of China (72072169).
Conflict of interest
The authors declare that they have no conflict of interest.
This study coded the hue composition of polychromatic pictures using a new method that enables the examination of warm and cool colors’ role in e-commerce.
This research highlights how color impacts the clicking-through of digital content products in e-commerce.
This research demonstrates how warm colors convey semantic meaning in the context of digital reading and how they enrich theme-based semantic interpretations.
Hong J, Byu K A. The effects of innovative visual design on consumer attitude. Australasian Marketing Journal,2021, 29 (1): 29–40. DOI: 10.1177/1839334921998517
[2]
De Burgh-Woodman H, Brace-Govan J. Vista, vision and visual consumption from the Age of Enlightenment. Marketing Theory,2010, 10 (2): 173–191. DOI: 10.1177/1470593110366908
[3]
Gonzalez E M, Meyer J H, Paz Toldos M. What women want? How contextual product displays influence women’s online shopping behavior. Journal of Business Research,2021, 123: 625–641. DOI: 10.1016/j.jbusres.2020.10.002
[4]
Jahanian A, Liu J, Lin Q, et al. Automatic design of colors for magazine covers. In: Proc. SPIE 8664, Imaging and Printing in a Web 2.0 World IV. Burlingame, CA, USA: Society of Photo-Optical Instrumentation Engineers (SPIE), 2013: 86640B.
[5]
Hsieh Y-C, Chiu H-C, Tang Y-C, et al. Do colors change realities in online shopping. Journal of Interactive Marketing,2018, 41: 14–27. DOI: 10.1016/j.intmar.2017.08.001
[6]
Kobayashi S. The aim and method of the color image scale. Color Research and Application,1981, 6 (2): 93–107. DOI: 10.1002/col.5080060210
[7]
Labrecque L I, Patrick V M, Milne G R. The marketers’ prismatic palette: A review of color research and future directions. Psychology & Marketing,2013, 30 (2): 187–202. DOI: 10.1002/mar.20597
[8]
Hagtvedt H. Dark is durable, light is user-friendly: The impact of color lightness on two product attribute judgments. Psychology & Marketing,2020, 37 (7): 864–875. DOI: 10.1002/mar.21268
[9]
He X F, Lv X G. From the color composition to the color psychology: Soft drink packaging in warm colors, and spirits packaging in dark colors. Color Research and Application,2022, 47 (3): 758–770. DOI: 10.1002/col.22748
[10]
Wu C-S, Cheng F F, Yen D C. The atmospheric factors of online storefront environment design: An empirical experiment in Taiwan. Information & Management,2008, 45 (7): 493–498. DOI: 10.1016/j.im.2008.07.004
[11]
Babin B J, Hardesty D M, Suter T A. Color and shopping intentions: The intervening effect of price fairness and perceived affect. Journal of Business Research,2003, 56 (7): 541–551. DOI: 10.1016/s0148-2963(01)00246-6
[12]
Torres A, Serra J, Llopis J, et al. Color preference cool versus warm in nursing homes depends on the expected activity for interior spaces. Frontiers of Architectural Research,2020, 9 (4): 739–750. DOI: 10.1016/j.foar.2020.06.002
[13]
Zhang L, Wang S. China’s digital content publishing industry: The 2019 annual report on investment insights and market trends. Publishing Research Quarterly,2020, 36 (2): 258–283. DOI: 10.1007/s12109-020-09717-1
[14]
Gong X, Wu B, Wu F. Research on the impact of green product packaging design on ecological environment. Fresenius Environmental Bulletin,2021, 30 (4): 3228–3232.
[15]
Pedersen B S, Engberg M, Have I, et al. To move, to touch, to listen: Multisensory aspects of the digital reading condition. Poetics Today,2021, 42 (2): 281–300. DOI: 10.1215/03335372-8883262
[16]
Park J, Lennon S J, Stoel L. On-line product presentation: Effects on mood, perceived risk, and purchase intention. Psychology & Marketing,2005, 22 (9): 695–719. DOI: 10.1002/mar.20080
[17]
Wichmann F A, Sharpe L T, Gegenfurtner K R. The contributions of color to recognition memory for natural scenes. Journal of Experimental Psychology: Learning, Memory, and Cognition,2002, 28 (3): 509–520. DOI: 10.1037//0278-7393.28.3.509
[18]
Chou H-Y, Wang S S. The effects of happiness types and happiness congruity on game app advertising and environments. Electronic Commerce Research and Applications,2016, 20: 1–14. DOI: 10.1016/j.elerap.2016.09.001
[19]
Aw E C-X, Basha N K, Ng S I, et al. Searching online and buying offline: Understanding the role of channel-, consumer-, and product-related factors in determining webrooming intention. Journal of Retailing and Consumer Services,2021, 58: 102328. DOI: 10.1016/j.jretconser.2020.102328
[20]
Cian L, Krishna A, Elder R S. This logo moves me: Dynamic imagery from static images. Journal of Marketing Research,2014, 51 (2): 184–197. DOI: 10.1509/jmr.13.0023
[21]
Liao S Y, Sakata K, Paramei G V. Color affects recognition of emoticon expressions. i-Perception,2022, 13 (1): 1–23. DOI: 10.1177/20416695221080778
[22]
Bruno P, Melnyk V, Voelckner F. Temperature and emotions: Effects of physical temperature on responses to emotional advertising. International Journal of Research in Marketing,2017, 34 (1): 302–320. DOI: 10.1016/j.ijresmar.2016.08.005
[23]
Hong J, Sun Y. Warm it up with love: The effect of physical coldness on liking of romance movies. Journal of Consumer Research,2012, 39 (2): 293–306. DOI: 10.1086/662613
[24]
Baek E, Choo H J, Lee S H. Using warmth as the visual design of a store: Intimacy, relational needs, and approach intentions. Journal of Business Research,2018, 88: 91–101. DOI: 10.1016/j.jbusres.2018.03.013
[25]
Arfken M. The boundaries of embodiment. Mind, Culture, and Activity,2011, 18 (1): 75–78. DOI: 10.1080/10749030903046243
[26]
Landwehr J R, Eckmann L. The nature of processing fluency: Amplification versus hedonic marking. Journal of Experimental Social Psychology,2020, 90: 103997. DOI: 10.1016/j.jesp.2020.103997
[27]
Lee A Y, Labroo A A. The effect of conceptual and perceptual fluency on brand evaluation. Journal of Marketing Research,2004, 41 (2): 151–165. DOI: 10.1509/jmkr.41.2.151.28665
[28]
Bagchi R, Cheema A. The effect of red background color on willingness-to-pay: The moderating role of selling mechanism. Journal of Consumer Research,2013, 39 (5): 947–960. DOI: 10.1086/666466
[29]
Wang H, Liu G, Hu S, et al. Experimental investigation about thermal effect of colour on thermal sensation and comfort. Energy and Buildings,2018, 173: 710–718. DOI: 10.1016/j.enbuild.2018.06.008
[30]
Kuzinas A. The power of colour on content: Associations, evoked by simple and complex pictures. Procedia: Social and Behavioral Sciences,2013, 84: 1397–1402. DOI: 10.1016/j.sbspro.2013.06.763
[31]
Haase J, Wiedmann K P, Bettels J, et al. How to best promote my product? Comparing the effectiveness of sensory, functional and symbolic advertising content in food marketing. British Food Journal,2018, 120 (8): 1792–1806. DOI: 10.1108/bfj-01-2018-0058
[32]
Liljedal K T, Berg H. Consumer responses to pictures of co-creating consumers in marketing communications. Journal of Consumer Marketing,2020, 37 (7): 775–784. DOI: 10.1108/jcm-12-2019-3544
[33]
Van Rompay T J L, De Vries P W, Van Venrooij X G. More than words: On the importance of picture-text congruence in the online environment. Journal of Interactive Marketing,2010, 24 (1): 22–30. DOI: 10.1016/j.intmar.2009.10.003
[34]
Zhang T, Bao C, Xiao C. Promoting effects of color-text congruence in banner advertising. Color Research and Application,2019, 44 (1): 125–131. DOI: 10.1002/col.22260
Figure
2.
How book covers are presented on the platform. From top to bottom: ① Color information means the color that people can see in the cover picture; ② the title can be seen in the cover picture and below the picture; ③ the author’s name represents the author of this e-book; ④ type and like represent the type of e-book and how many times this book has been liked.
Figure
3.
Example of cool-colored e-book cover images.
Figure
4.
Example of warm-colored e-book cover images.
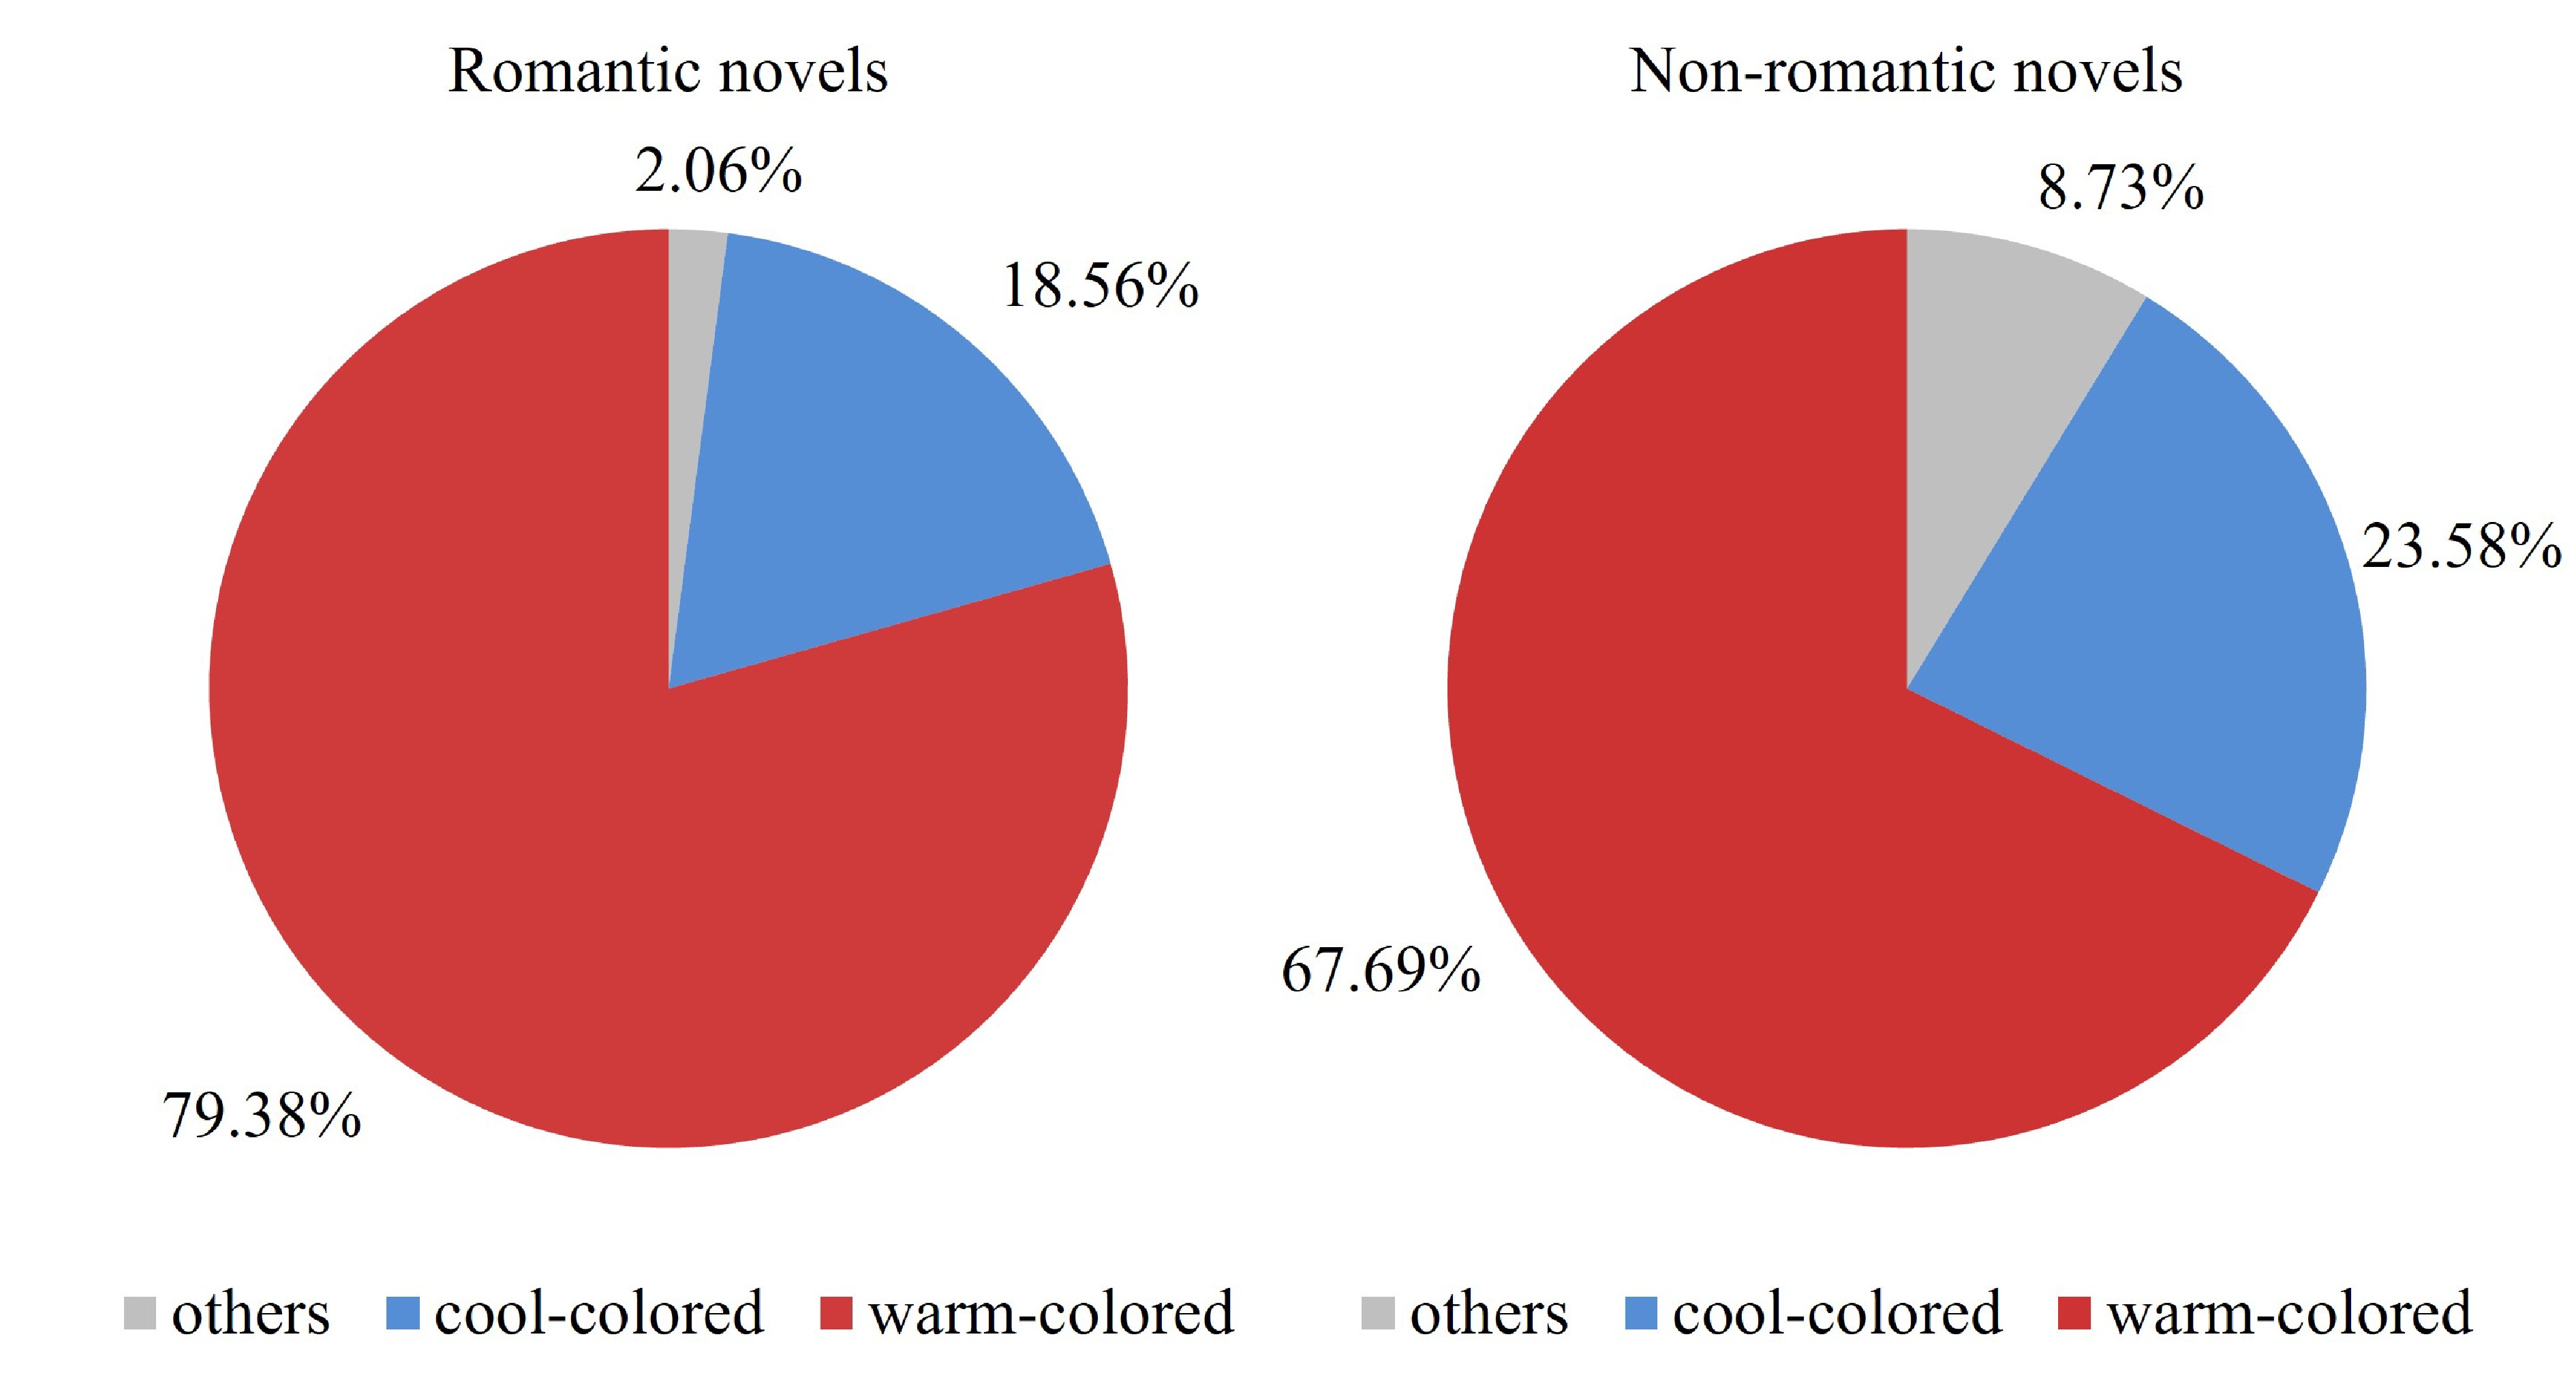
Figure
5.
Percentage of covers’ color for romantic novels and non-romantic novels.
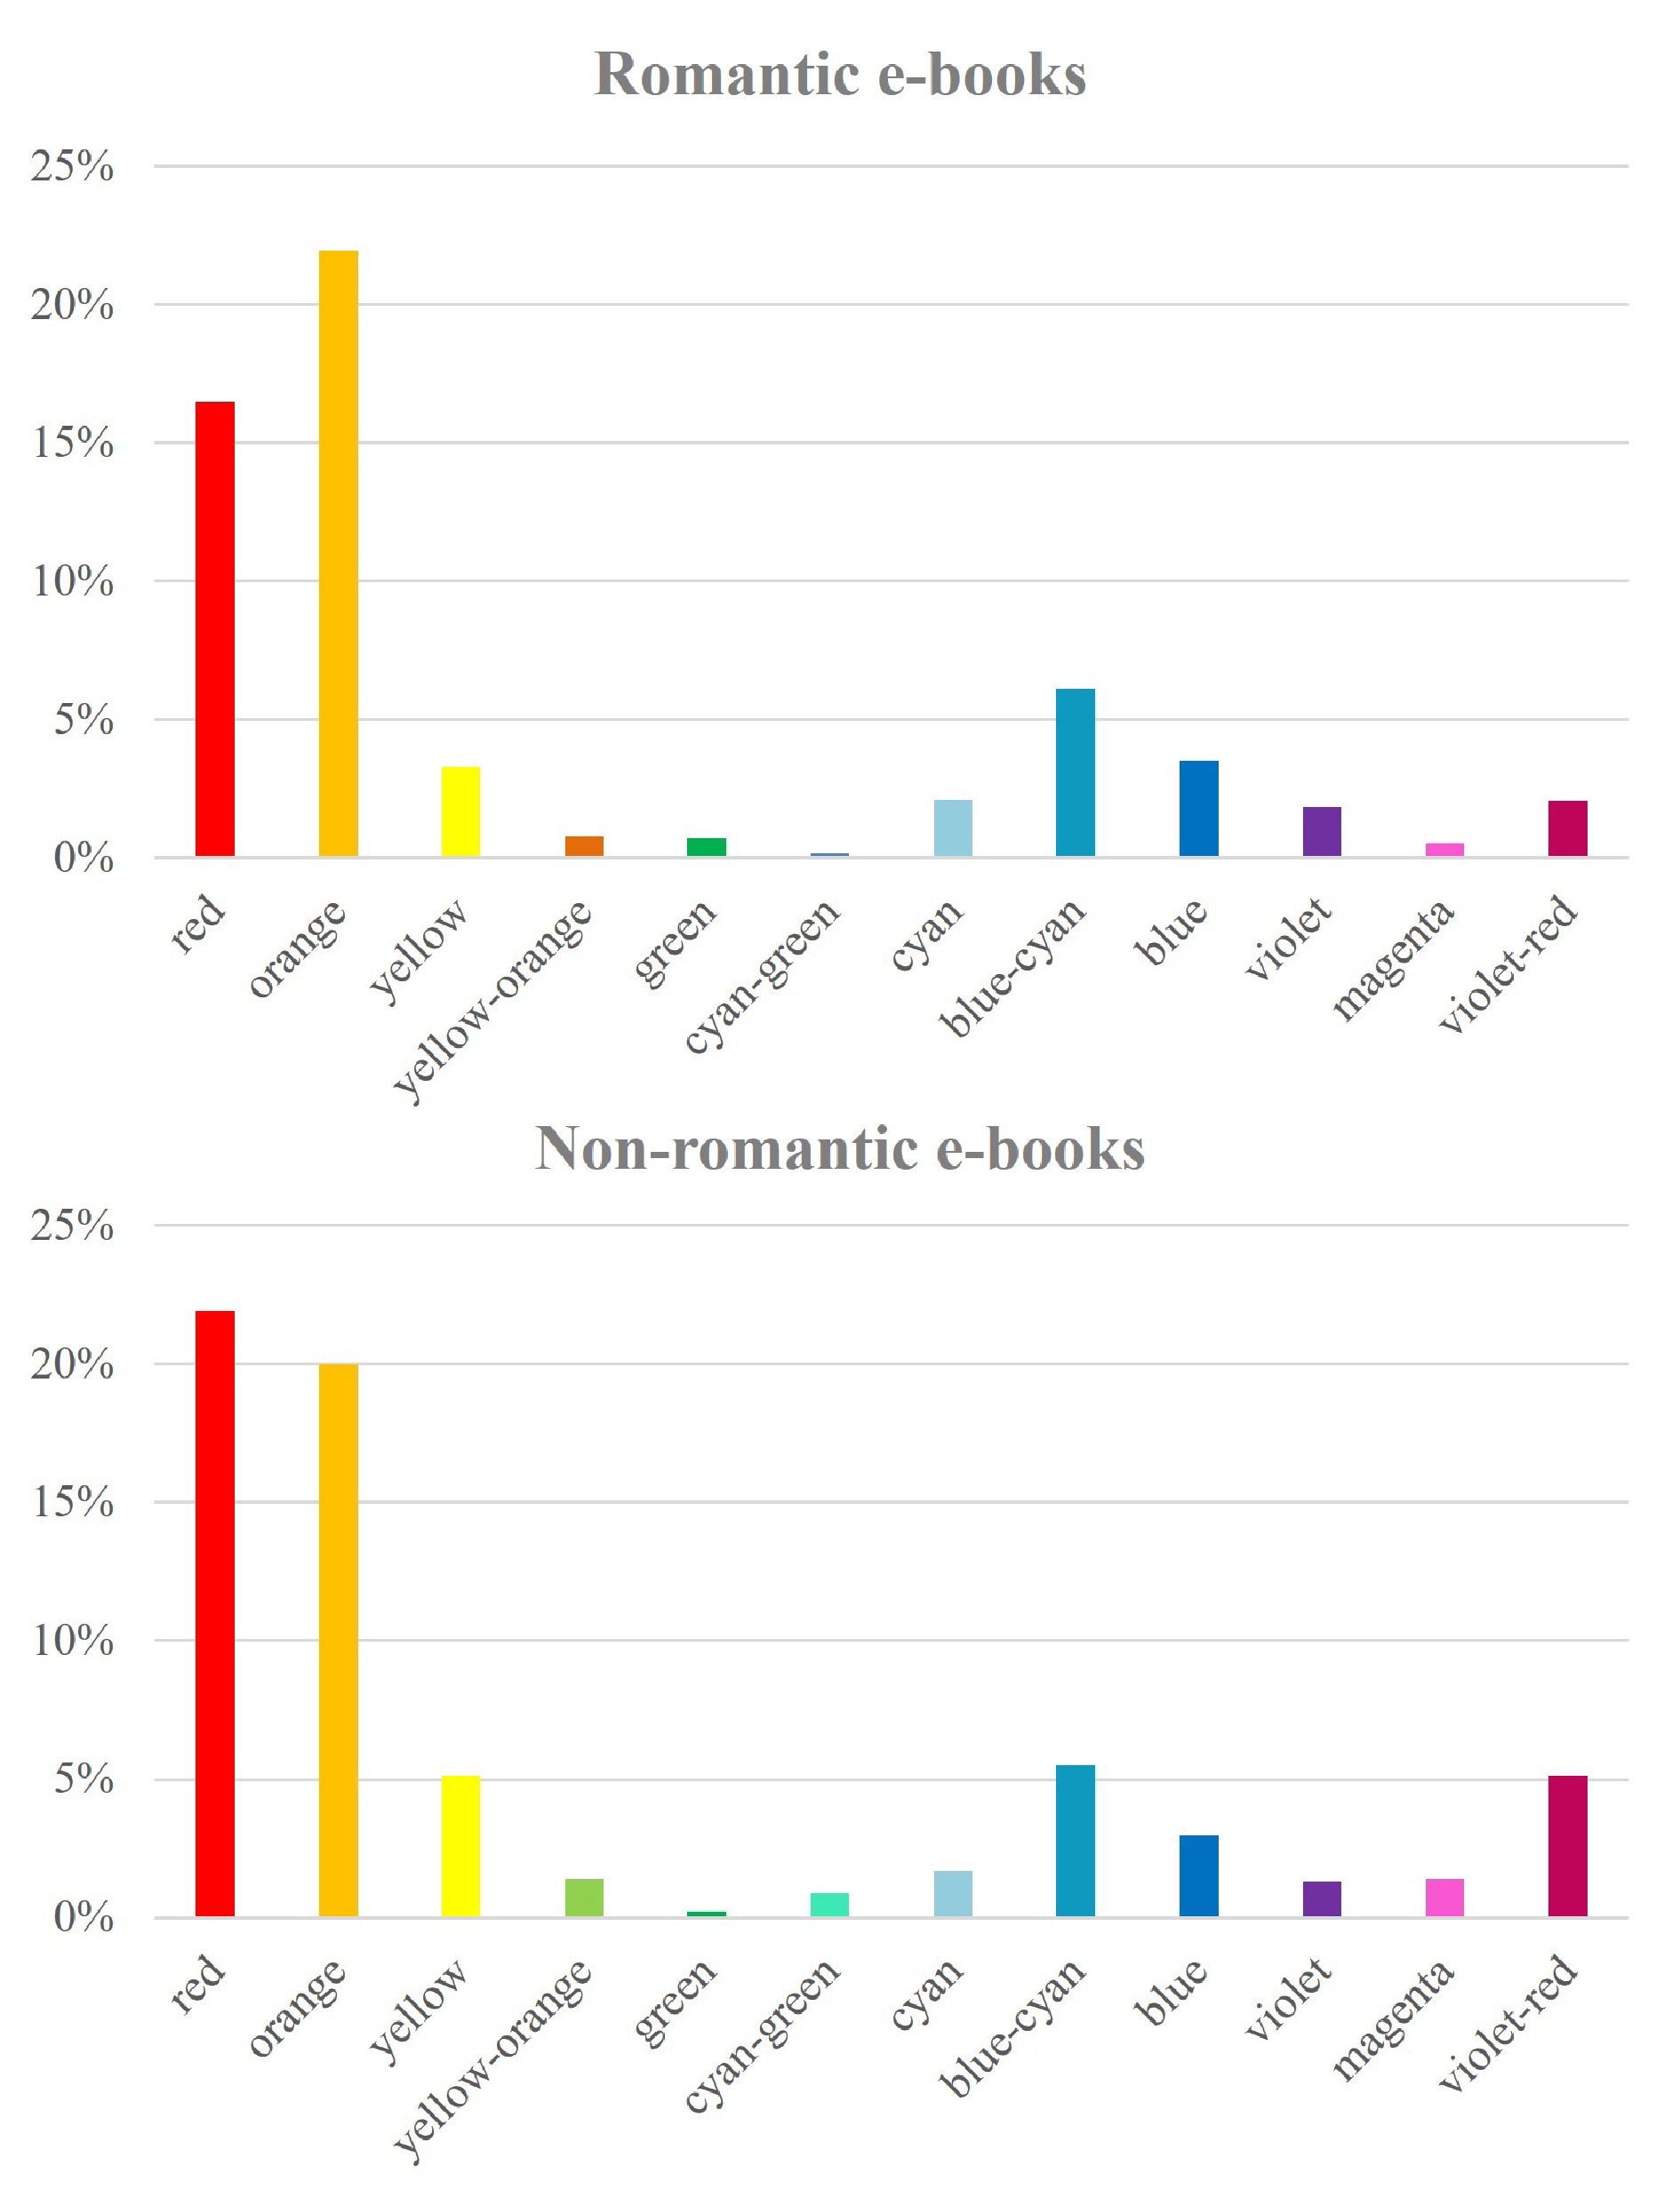
Figure
6.
Color distribution for romantic novel and non-romantic novel cover images.
References
[1]
Hong J, Byu K A. The effects of innovative visual design on consumer attitude. Australasian Marketing Journal,2021, 29 (1): 29–40. DOI: 10.1177/1839334921998517
[2]
De Burgh-Woodman H, Brace-Govan J. Vista, vision and visual consumption from the Age of Enlightenment. Marketing Theory,2010, 10 (2): 173–191. DOI: 10.1177/1470593110366908
[3]
Gonzalez E M, Meyer J H, Paz Toldos M. What women want? How contextual product displays influence women’s online shopping behavior. Journal of Business Research,2021, 123: 625–641. DOI: 10.1016/j.jbusres.2020.10.002
[4]
Jahanian A, Liu J, Lin Q, et al. Automatic design of colors for magazine covers. In: Proc. SPIE 8664, Imaging and Printing in a Web 2.0 World IV. Burlingame, CA, USA: Society of Photo-Optical Instrumentation Engineers (SPIE), 2013: 86640B.
[5]
Hsieh Y-C, Chiu H-C, Tang Y-C, et al. Do colors change realities in online shopping. Journal of Interactive Marketing,2018, 41: 14–27. DOI: 10.1016/j.intmar.2017.08.001
[6]
Kobayashi S. The aim and method of the color image scale. Color Research and Application,1981, 6 (2): 93–107. DOI: 10.1002/col.5080060210
[7]
Labrecque L I, Patrick V M, Milne G R. The marketers’ prismatic palette: A review of color research and future directions. Psychology & Marketing,2013, 30 (2): 187–202. DOI: 10.1002/mar.20597
[8]
Hagtvedt H. Dark is durable, light is user-friendly: The impact of color lightness on two product attribute judgments. Psychology & Marketing,2020, 37 (7): 864–875. DOI: 10.1002/mar.21268
[9]
He X F, Lv X G. From the color composition to the color psychology: Soft drink packaging in warm colors, and spirits packaging in dark colors. Color Research and Application,2022, 47 (3): 758–770. DOI: 10.1002/col.22748
[10]
Wu C-S, Cheng F F, Yen D C. The atmospheric factors of online storefront environment design: An empirical experiment in Taiwan. Information & Management,2008, 45 (7): 493–498. DOI: 10.1016/j.im.2008.07.004
[11]
Babin B J, Hardesty D M, Suter T A. Color and shopping intentions: The intervening effect of price fairness and perceived affect. Journal of Business Research,2003, 56 (7): 541–551. DOI: 10.1016/s0148-2963(01)00246-6
[12]
Torres A, Serra J, Llopis J, et al. Color preference cool versus warm in nursing homes depends on the expected activity for interior spaces. Frontiers of Architectural Research,2020, 9 (4): 739–750. DOI: 10.1016/j.foar.2020.06.002
[13]
Zhang L, Wang S. China’s digital content publishing industry: The 2019 annual report on investment insights and market trends. Publishing Research Quarterly,2020, 36 (2): 258–283. DOI: 10.1007/s12109-020-09717-1
[14]
Gong X, Wu B, Wu F. Research on the impact of green product packaging design on ecological environment. Fresenius Environmental Bulletin,2021, 30 (4): 3228–3232.
[15]
Pedersen B S, Engberg M, Have I, et al. To move, to touch, to listen: Multisensory aspects of the digital reading condition. Poetics Today,2021, 42 (2): 281–300. DOI: 10.1215/03335372-8883262
[16]
Park J, Lennon S J, Stoel L. On-line product presentation: Effects on mood, perceived risk, and purchase intention. Psychology & Marketing,2005, 22 (9): 695–719. DOI: 10.1002/mar.20080
[17]
Wichmann F A, Sharpe L T, Gegenfurtner K R. The contributions of color to recognition memory for natural scenes. Journal of Experimental Psychology: Learning, Memory, and Cognition,2002, 28 (3): 509–520. DOI: 10.1037//0278-7393.28.3.509
[18]
Chou H-Y, Wang S S. The effects of happiness types and happiness congruity on game app advertising and environments. Electronic Commerce Research and Applications,2016, 20: 1–14. DOI: 10.1016/j.elerap.2016.09.001
[19]
Aw E C-X, Basha N K, Ng S I, et al. Searching online and buying offline: Understanding the role of channel-, consumer-, and product-related factors in determining webrooming intention. Journal of Retailing and Consumer Services,2021, 58: 102328. DOI: 10.1016/j.jretconser.2020.102328
[20]
Cian L, Krishna A, Elder R S. This logo moves me: Dynamic imagery from static images. Journal of Marketing Research,2014, 51 (2): 184–197. DOI: 10.1509/jmr.13.0023
[21]
Liao S Y, Sakata K, Paramei G V. Color affects recognition of emoticon expressions. i-Perception,2022, 13 (1): 1–23. DOI: 10.1177/20416695221080778
[22]
Bruno P, Melnyk V, Voelckner F. Temperature and emotions: Effects of physical temperature on responses to emotional advertising. International Journal of Research in Marketing,2017, 34 (1): 302–320. DOI: 10.1016/j.ijresmar.2016.08.005
[23]
Hong J, Sun Y. Warm it up with love: The effect of physical coldness on liking of romance movies. Journal of Consumer Research,2012, 39 (2): 293–306. DOI: 10.1086/662613
[24]
Baek E, Choo H J, Lee S H. Using warmth as the visual design of a store: Intimacy, relational needs, and approach intentions. Journal of Business Research,2018, 88: 91–101. DOI: 10.1016/j.jbusres.2018.03.013
[25]
Arfken M. The boundaries of embodiment. Mind, Culture, and Activity,2011, 18 (1): 75–78. DOI: 10.1080/10749030903046243
[26]
Landwehr J R, Eckmann L. The nature of processing fluency: Amplification versus hedonic marking. Journal of Experimental Social Psychology,2020, 90: 103997. DOI: 10.1016/j.jesp.2020.103997
[27]
Lee A Y, Labroo A A. The effect of conceptual and perceptual fluency on brand evaluation. Journal of Marketing Research,2004, 41 (2): 151–165. DOI: 10.1509/jmkr.41.2.151.28665
[28]
Bagchi R, Cheema A. The effect of red background color on willingness-to-pay: The moderating role of selling mechanism. Journal of Consumer Research,2013, 39 (5): 947–960. DOI: 10.1086/666466
[29]
Wang H, Liu G, Hu S, et al. Experimental investigation about thermal effect of colour on thermal sensation and comfort. Energy and Buildings,2018, 173: 710–718. DOI: 10.1016/j.enbuild.2018.06.008
[30]
Kuzinas A. The power of colour on content: Associations, evoked by simple and complex pictures. Procedia: Social and Behavioral Sciences,2013, 84: 1397–1402. DOI: 10.1016/j.sbspro.2013.06.763
[31]
Haase J, Wiedmann K P, Bettels J, et al. How to best promote my product? Comparing the effectiveness of sensory, functional and symbolic advertising content in food marketing. British Food Journal,2018, 120 (8): 1792–1806. DOI: 10.1108/bfj-01-2018-0058
[32]
Liljedal K T, Berg H. Consumer responses to pictures of co-creating consumers in marketing communications. Journal of Consumer Marketing,2020, 37 (7): 775–784. DOI: 10.1108/jcm-12-2019-3544
[33]
Van Rompay T J L, De Vries P W, Van Venrooij X G. More than words: On the importance of picture-text congruence in the online environment. Journal of Interactive Marketing,2010, 24 (1): 22–30. DOI: 10.1016/j.intmar.2009.10.003
[34]
Zhang T, Bao C, Xiao C. Promoting effects of color-text congruence in banner advertising. Color Research and Application,2019, 44 (1): 125–131. DOI: 10.1002/col.22260
Table
3.
Regression results of enterprise digital transformation on Grepat, Gre_inv and Gre_use.
(1)
(2)
(3)
Grepat
Gre_inv
Gre_use
Dcg
0.1106***
0.0775**
0.0756***
(3.24)
(2.54)
(2.72)
Size
0.6722***
0.6776***
0.1975**
(3.46)
(3.44)
(2.24)
Age
0.3640
0.3849
0.1350
(1.18)
(1.25)
(0.90)
Lev
0.0514
0.0277
0.0806
(0.60)
(0.41)
(1.14)
BM
−0.1588
−0.1807**
−0.0161
(−1.52)
(−1.99)
(−0.21)
ROE
−0.0120**
−0.0091**
−0.0068**
(−2.41)
(−2.03)
(−2.31)
SOE
−0.0530
−0.0250
−0.0248
(−0.17)
(−0.09)
(−0.16)
Dual
0.1902**
0.2085**
0.0644
(2.08)
(2.41)
(1.39)
POID
0.5708
0.6388
0.3013
(0.78)
(0.97)
(0.63)
First
−0.7148
−0.5656
−0.5748
(−1.39)
(−1.29)
(−1.64)
Firm
YES
YES
YES
Year
YES
YES
YES
N
1099
1099
1099
Adj. R2
0.5660
0.5369
0.4765
Standard errors are shown inside the parentheses. *, **, and *** indicate significance at the 10%, 5%, and 1% levels, respectively. Unless otherwise specified, the meanings in Tables 3–8 are the same.


 DownLoad: