
 Download:
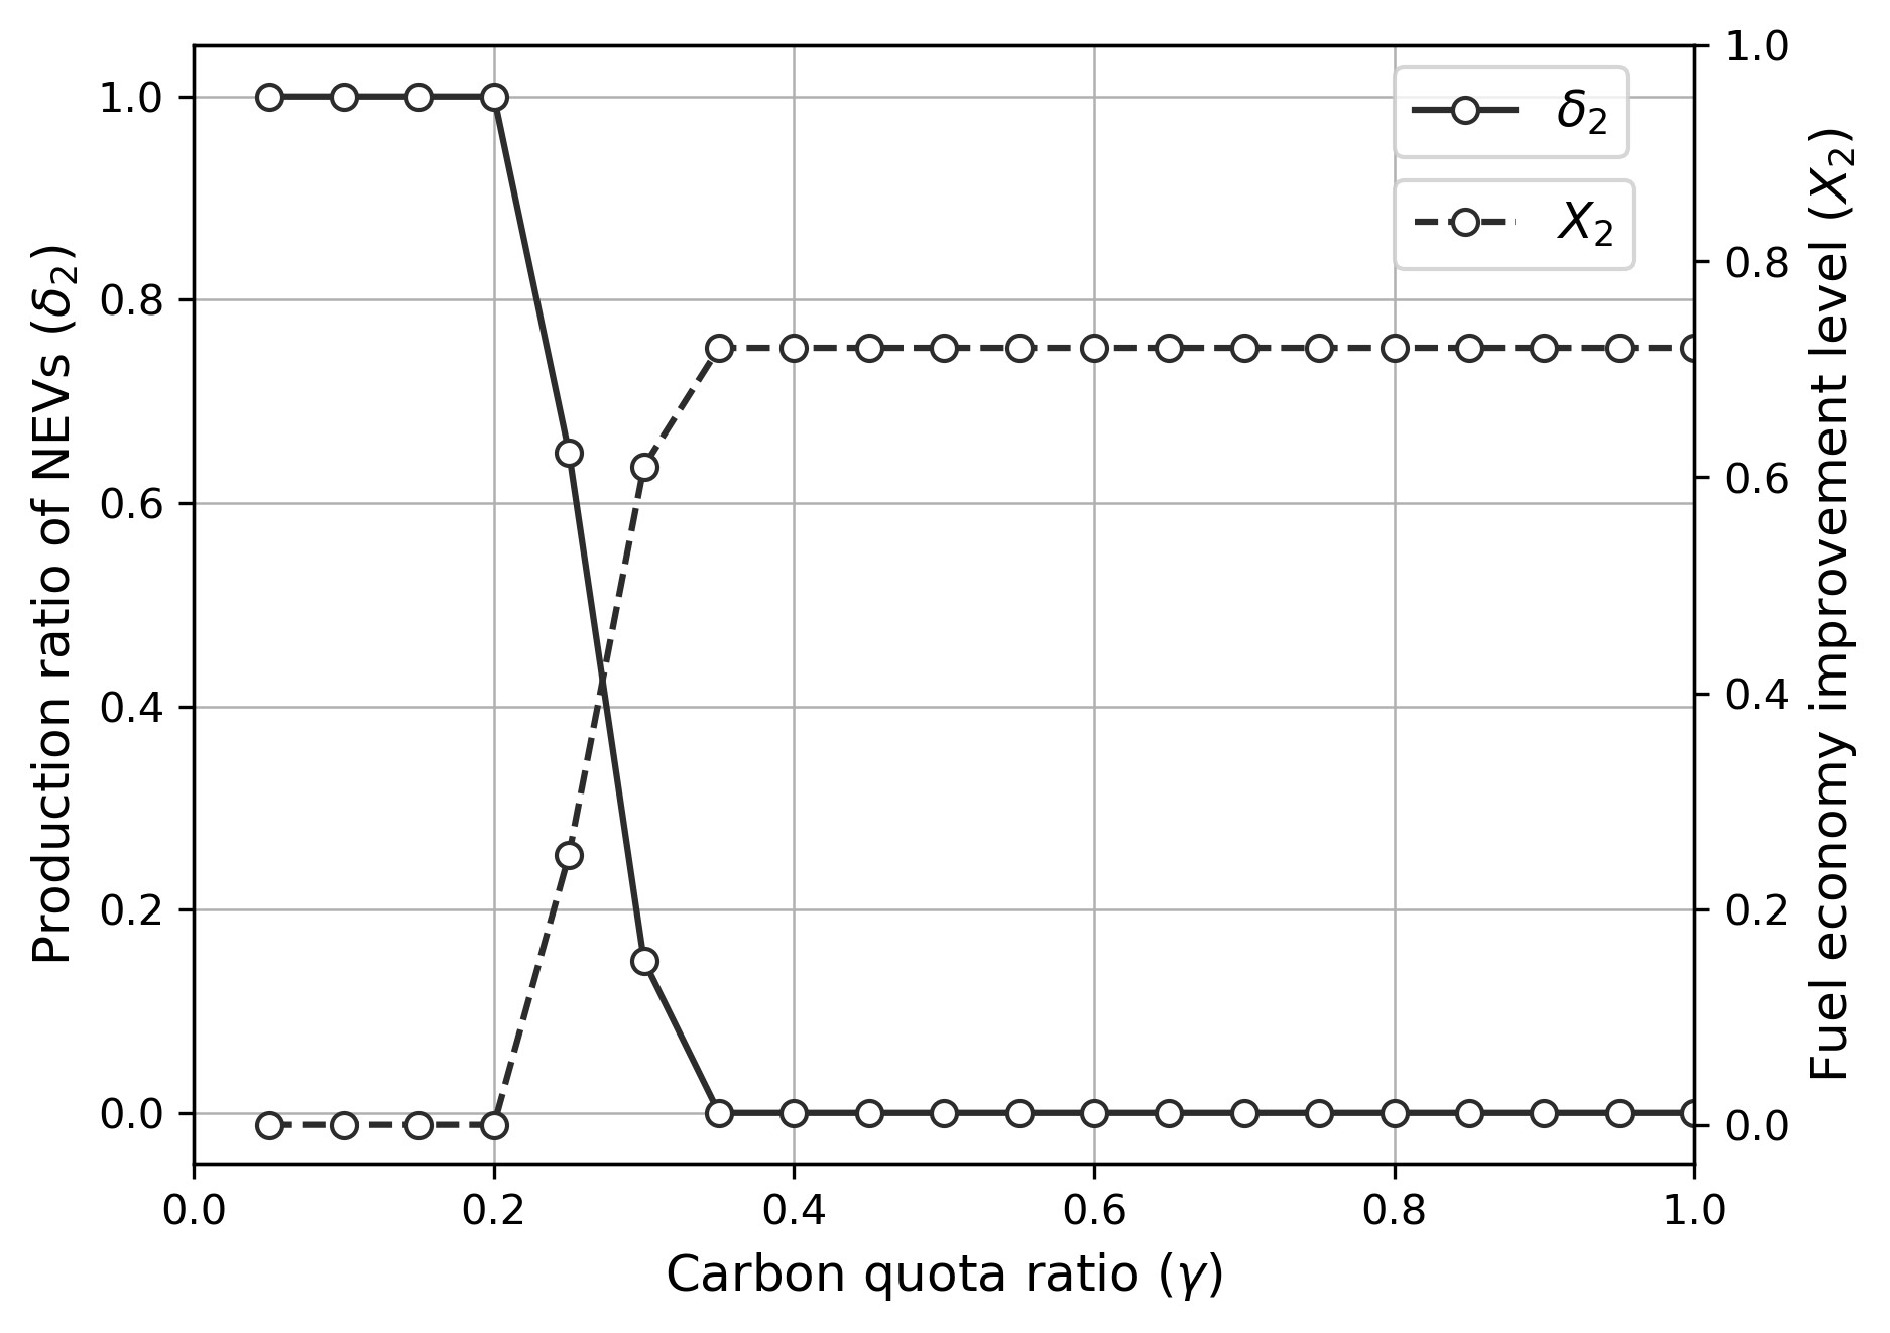
The impact of the carbon quota ratio on enterprise decisions. Data represent the impact of governments’ carbon quota ratio decisions on automaker decisions.
Figures of the Article
-
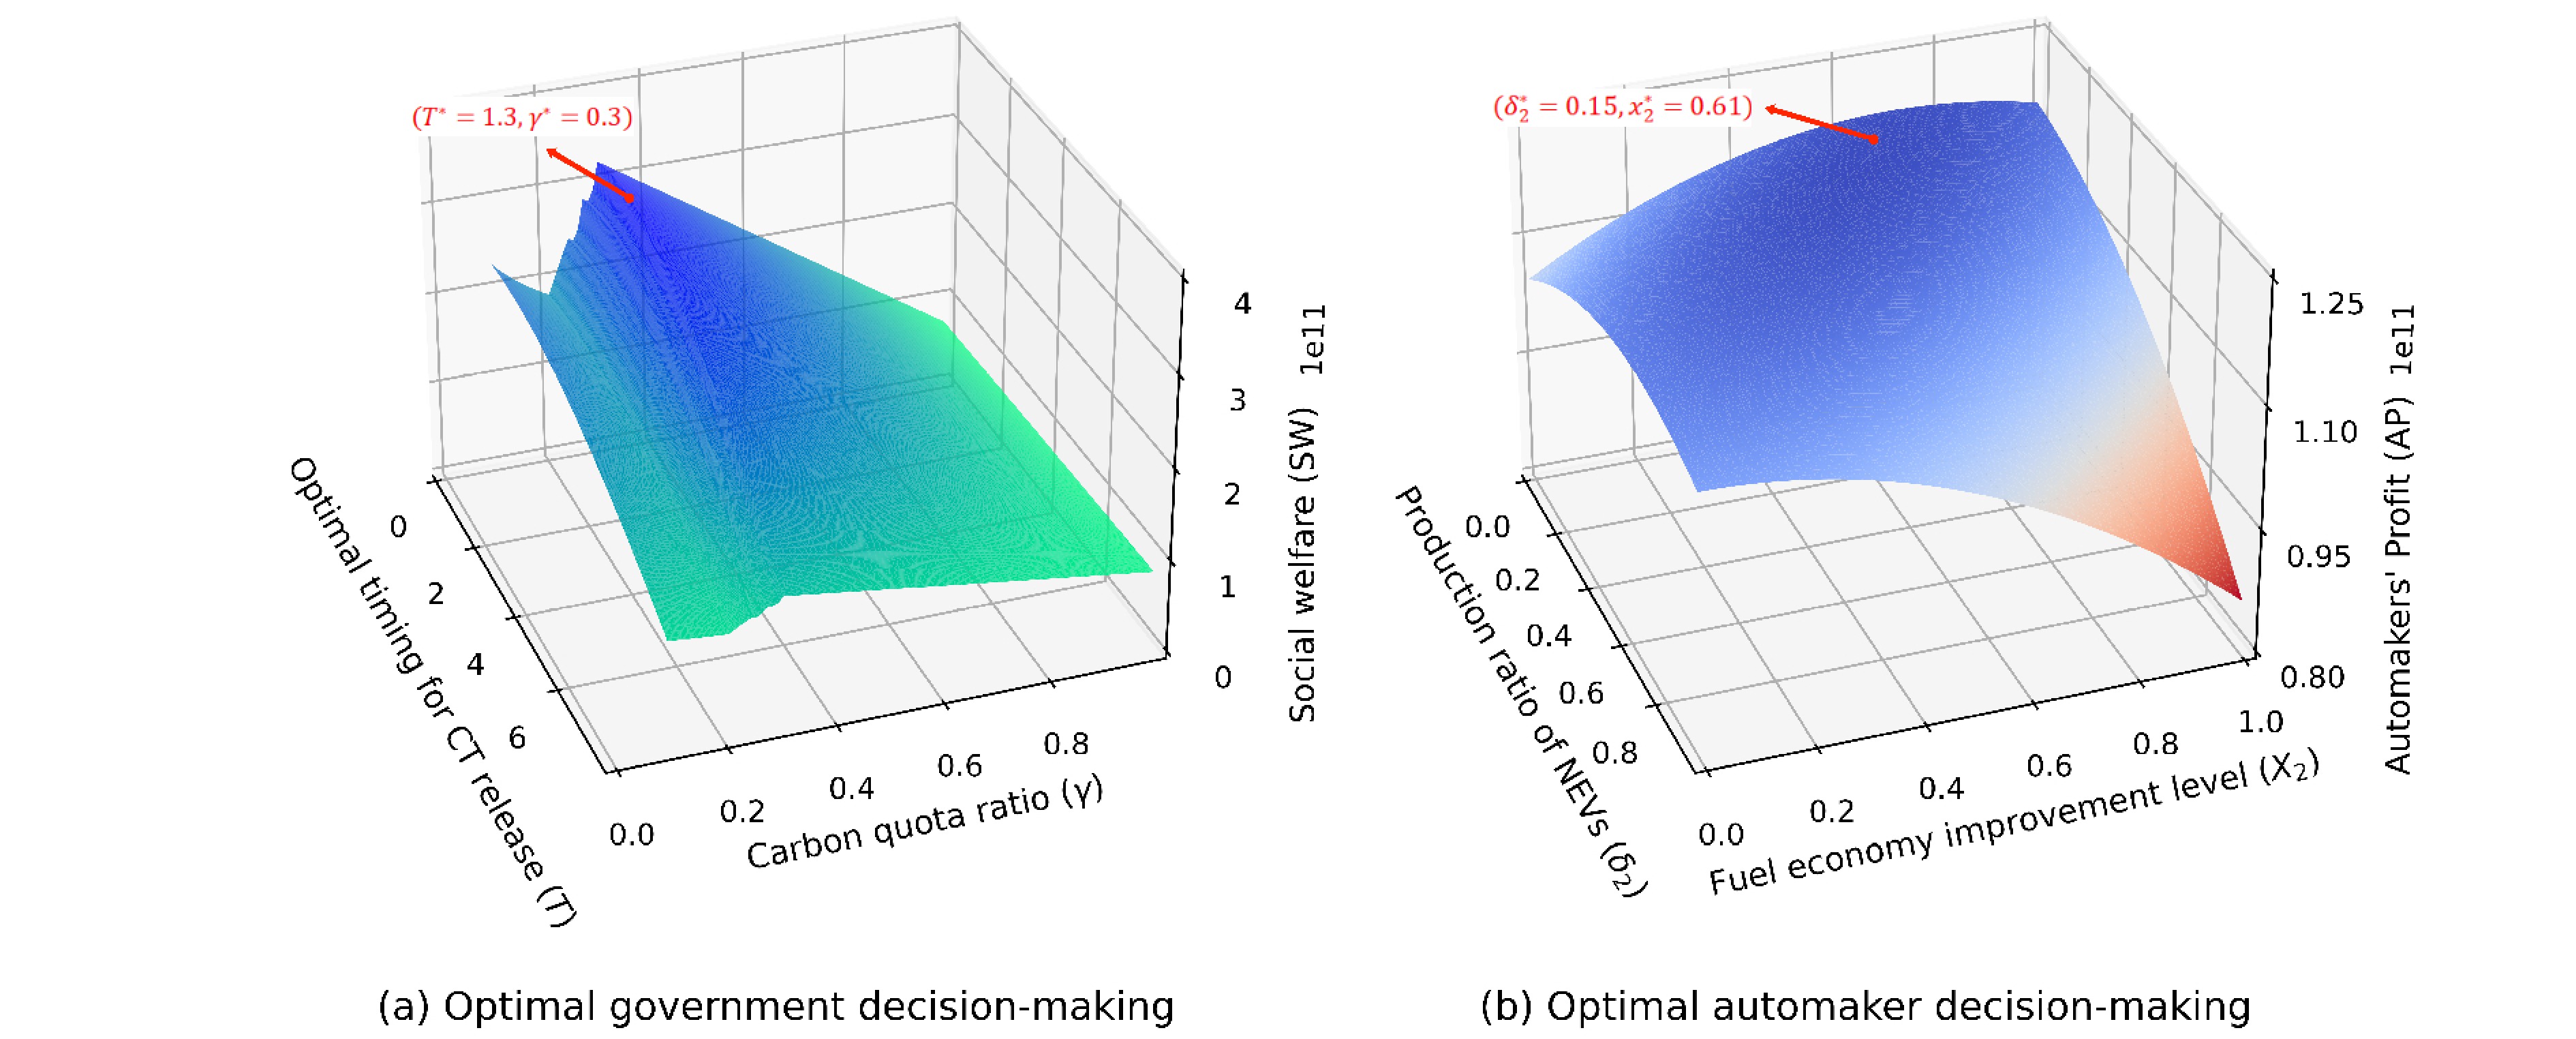
![]() Optimal government decision-making under the benchmark scenario. (a) Data represent the changes in social welfare. (b) Data represent the changes in the automakers’ profit.
Optimal government decision-making under the benchmark scenario. (a) Data represent the changes in social welfare. (b) Data represent the changes in the automakers’ profit.
-
![]() The impact of the carbon quota ratio on enterprise decisions. Data represent the impact of governments’ carbon quota ratio decisions on automaker decisions.
The impact of the carbon quota ratio on enterprise decisions. Data represent the impact of governments’ carbon quota ratio decisions on automaker decisions.
-
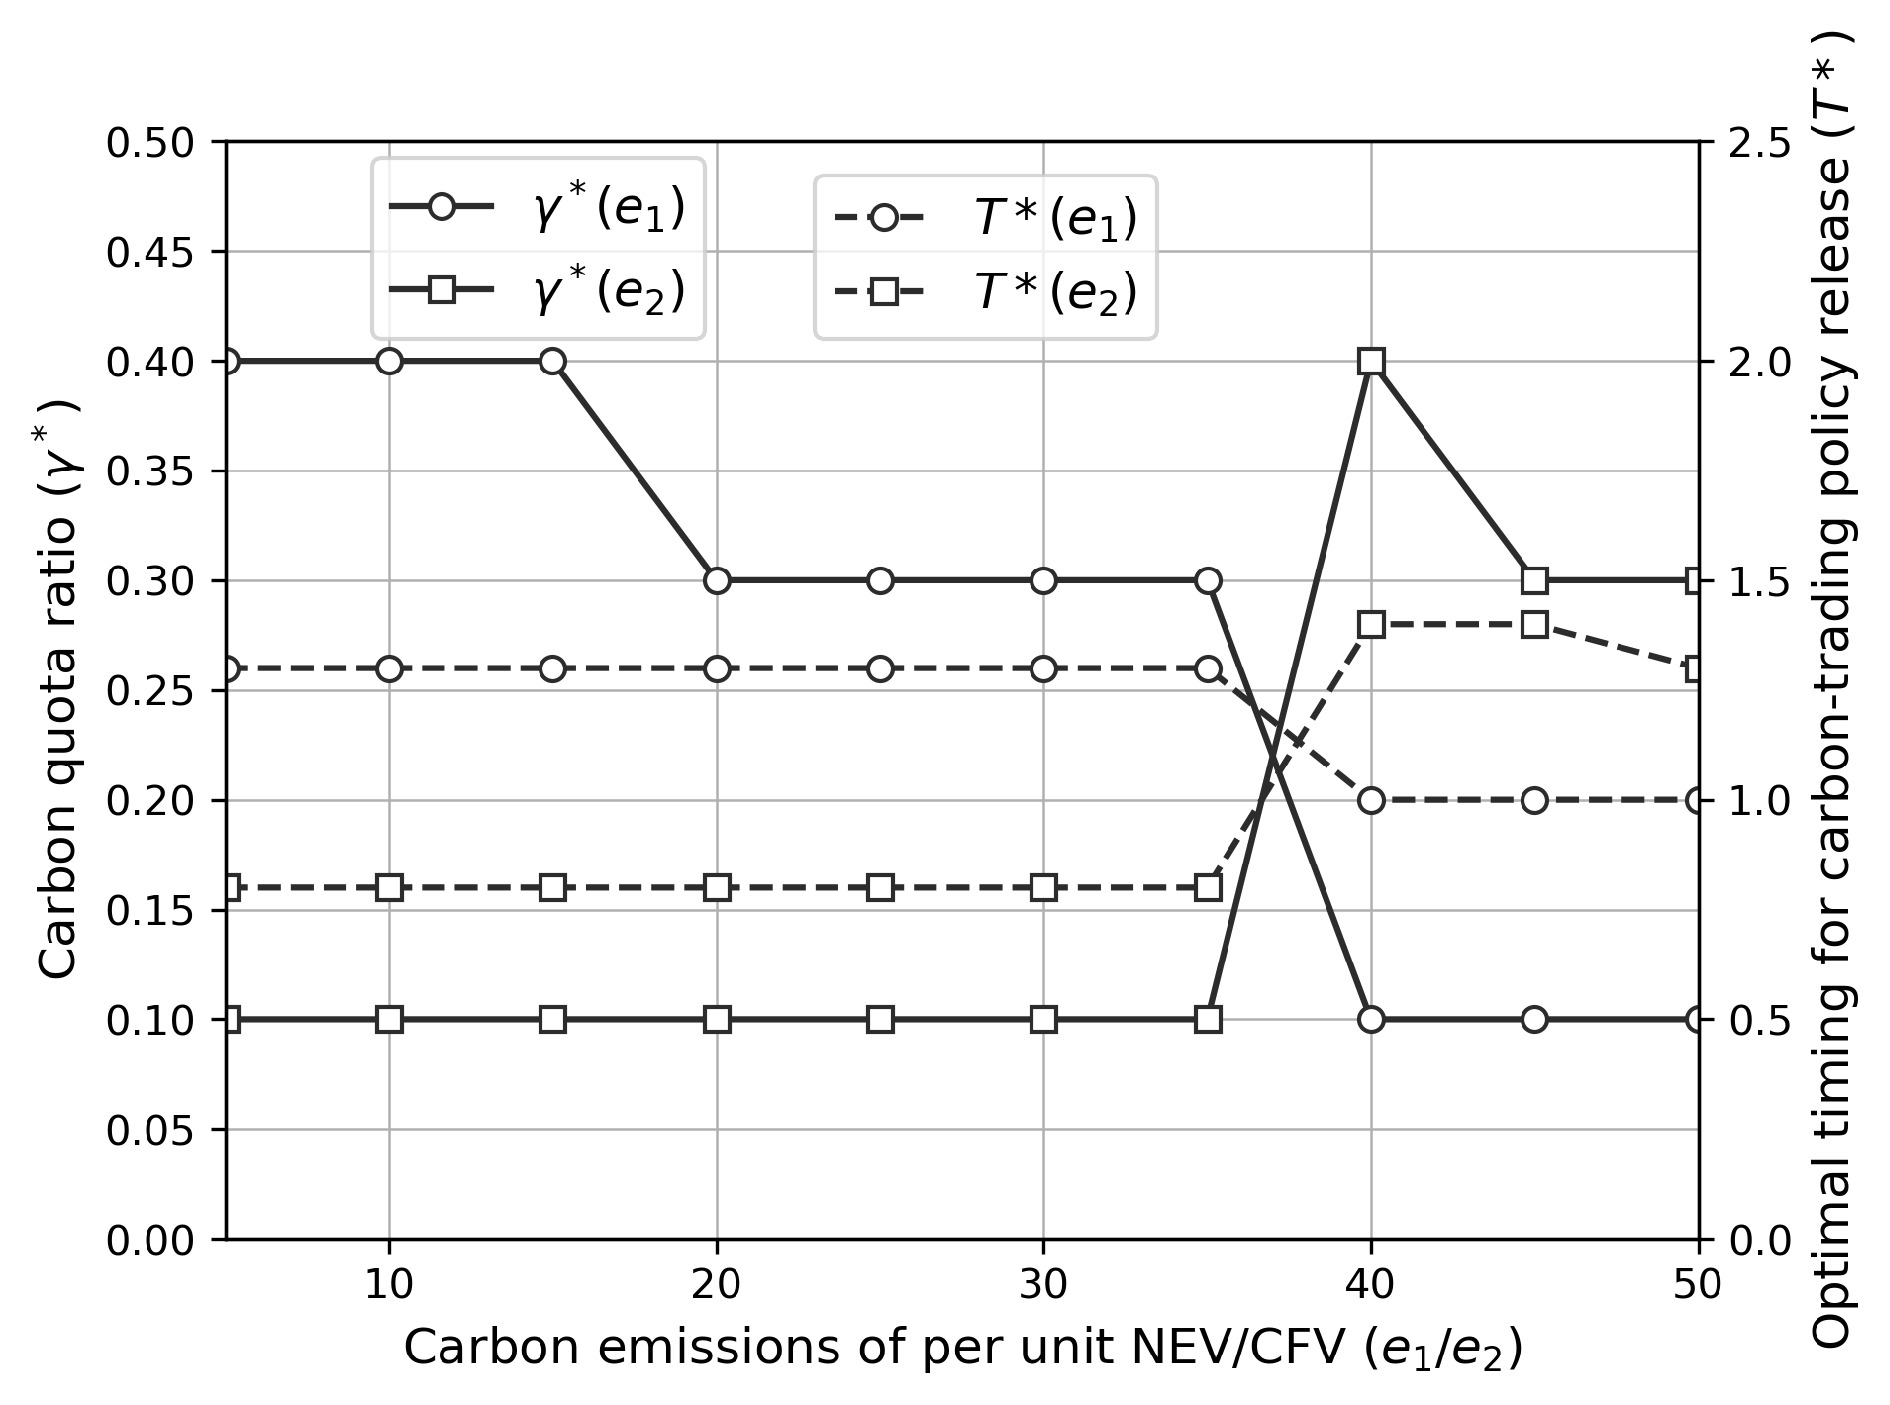
![]() Impact of
Impact of e1 ande2 on CT introduction timing and carbon quota ratio. Data represent the impact of the single-vehicle carbon emissions of NEVs and CFVs on the optimal CT introduction timing and carbon quota ratio. -
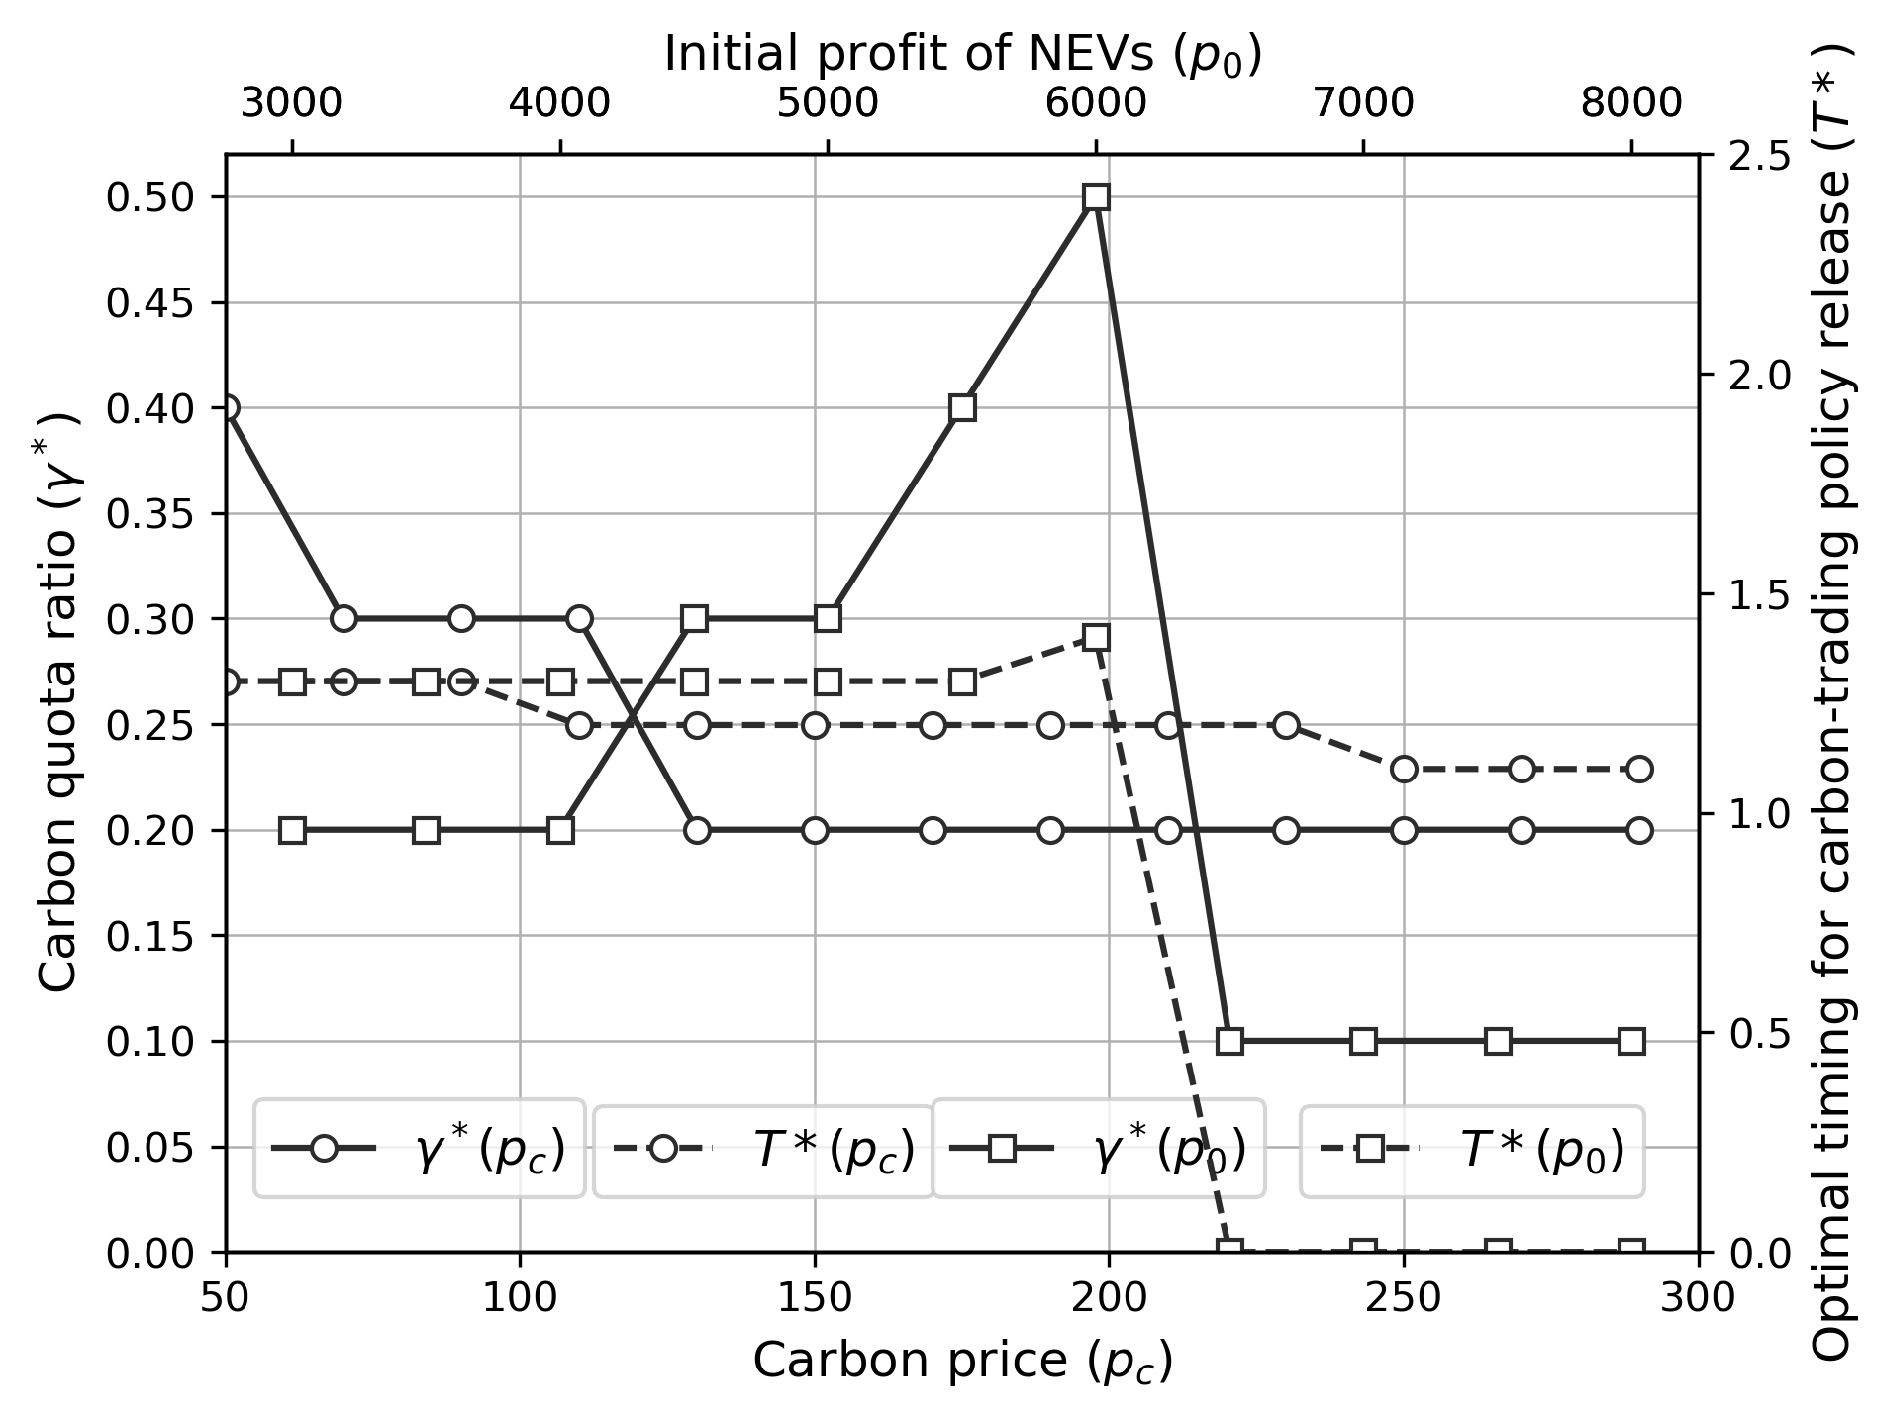
![]() Impact of
Impact of pc andp0 on CT introduction timing and carbon quota ratio. Data represent the impact of the carbon price and the initial profit of NEVs on government decisions. -
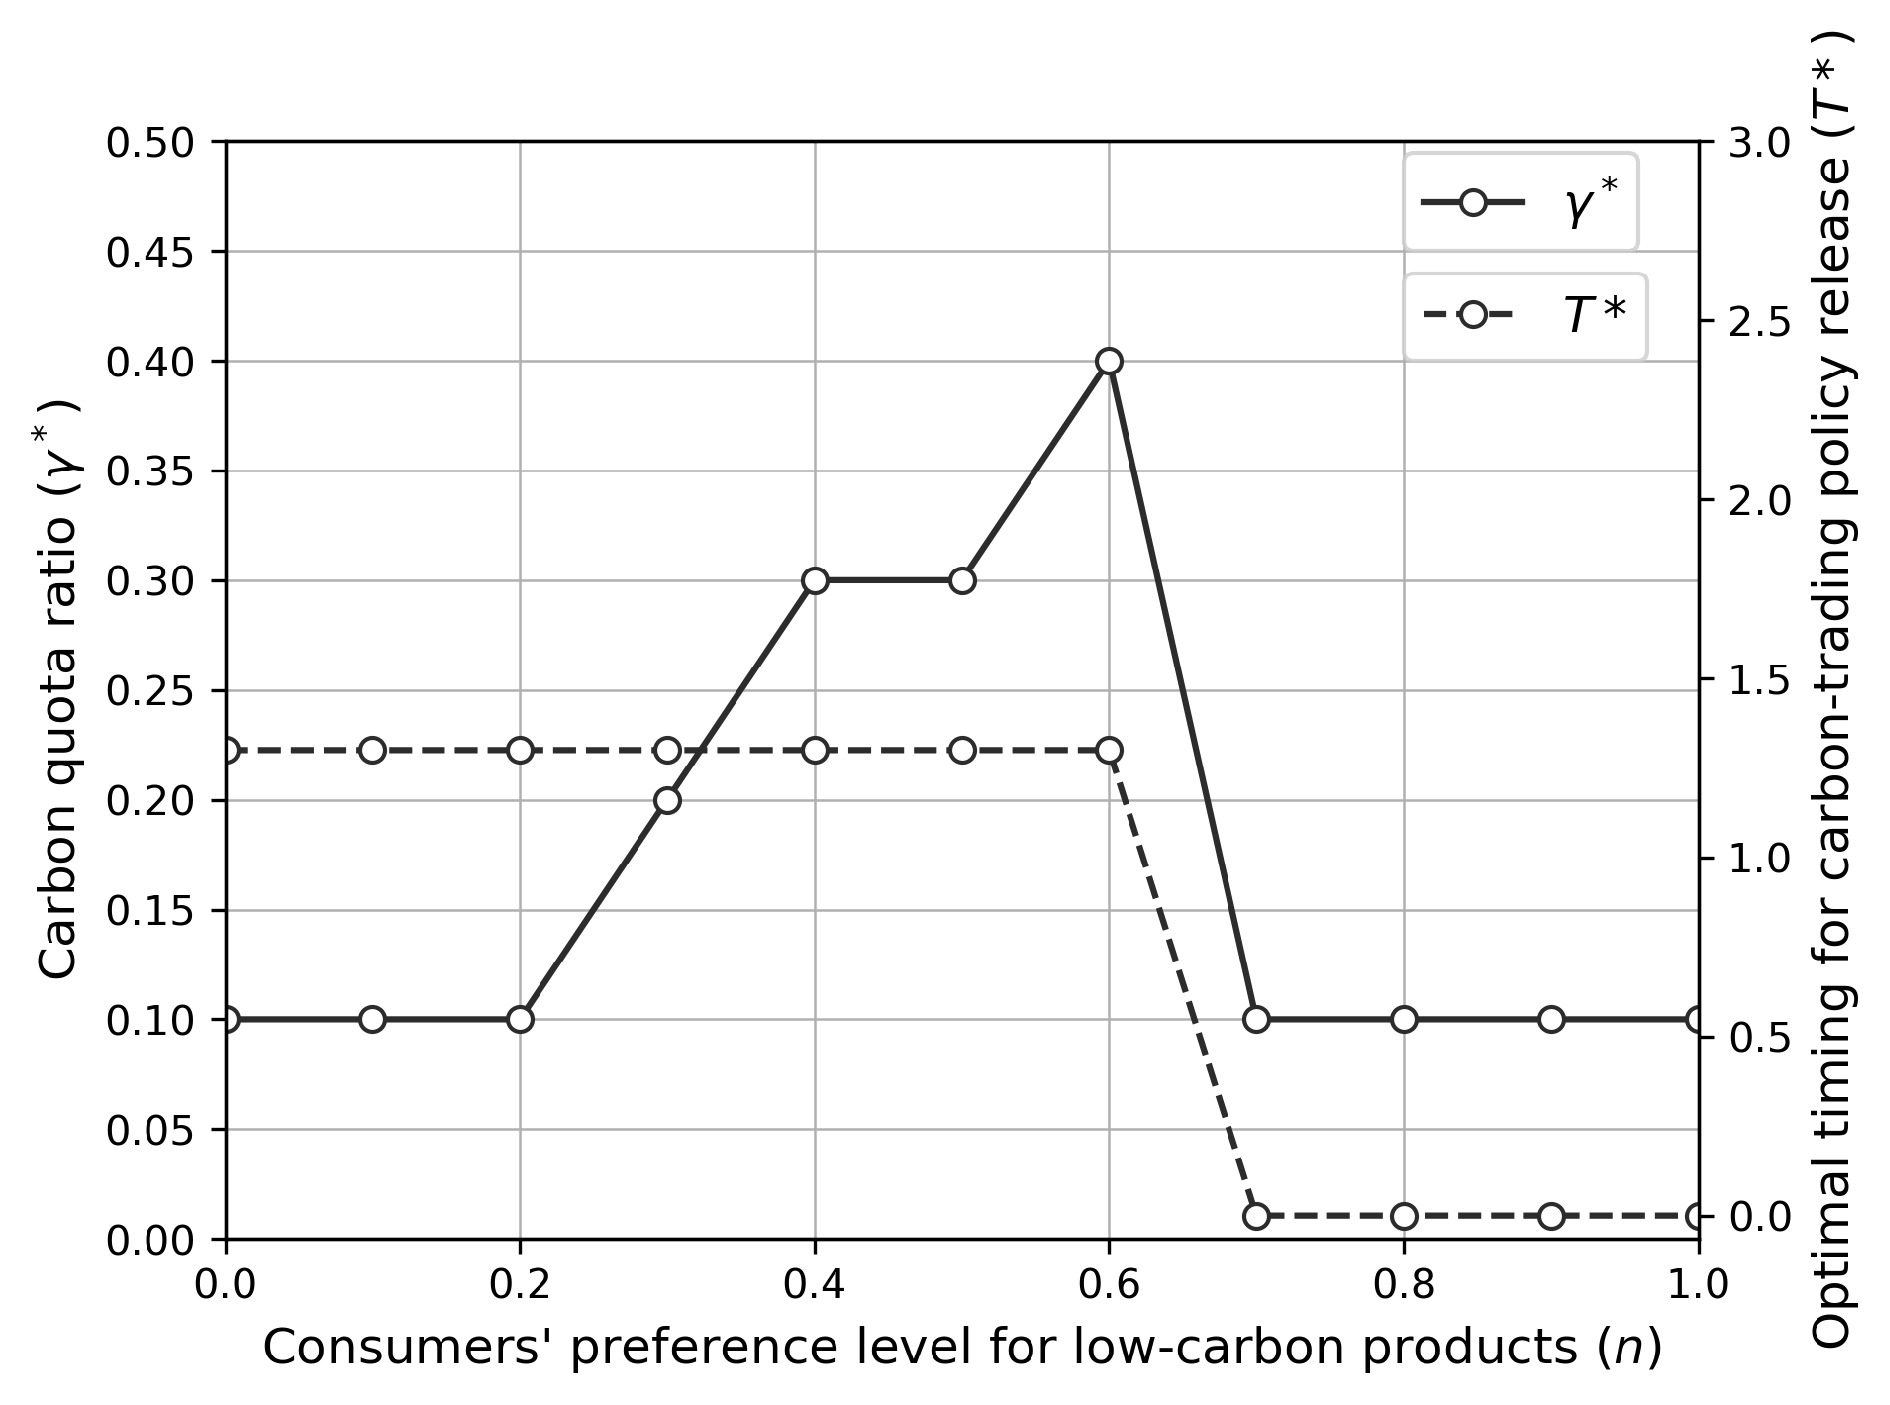
![]() The impact of
The impact of n on CT introduction timing and carbon quota ratio. Data represent the impact of consumers’ low-carbon preference levels (n ) on the optimal CT introduction timing and carbon quota ratio.


Related articles
-
2024, 54(3): 0302. DOI: 10.52396/JUSTC-2023-0169
-
2022, 52(3): 7-1-7-9. DOI: 10.52396/JUSTC-2021-0215
-
2020, 50(10): 1343. DOI: 10.3969/j.issn.0253-2778.2020.10.006
-
2020, 50(8): 1064. DOI: 10.3969/j.issn.0253-2778.2020.08.004
-
2020, 50(7): 1019. DOI: 10.3969/j.issn.0253-2778.2020.07.020
-
2020, 50(1): 39-48. DOI: 10.3969/j.issn.0253-2778.2020.01.005
-
2019, 49(2): 105-111. DOI: 10.3969/j.issn.0253-2778.2019.02.004
-
2019, 49(1): 40-48. DOI: 10.3969/j.issn.0253-2778.2019.01.006
-
2018, 48(11): 923-932. DOI: 10.3969/j.issn.0253-2778.2018.11.008
-
2017, 47(4): 320-327. DOI: 10.3969/j.issn.0253-2778.2017.04.006
