
 Download:
Figures of the Article
-
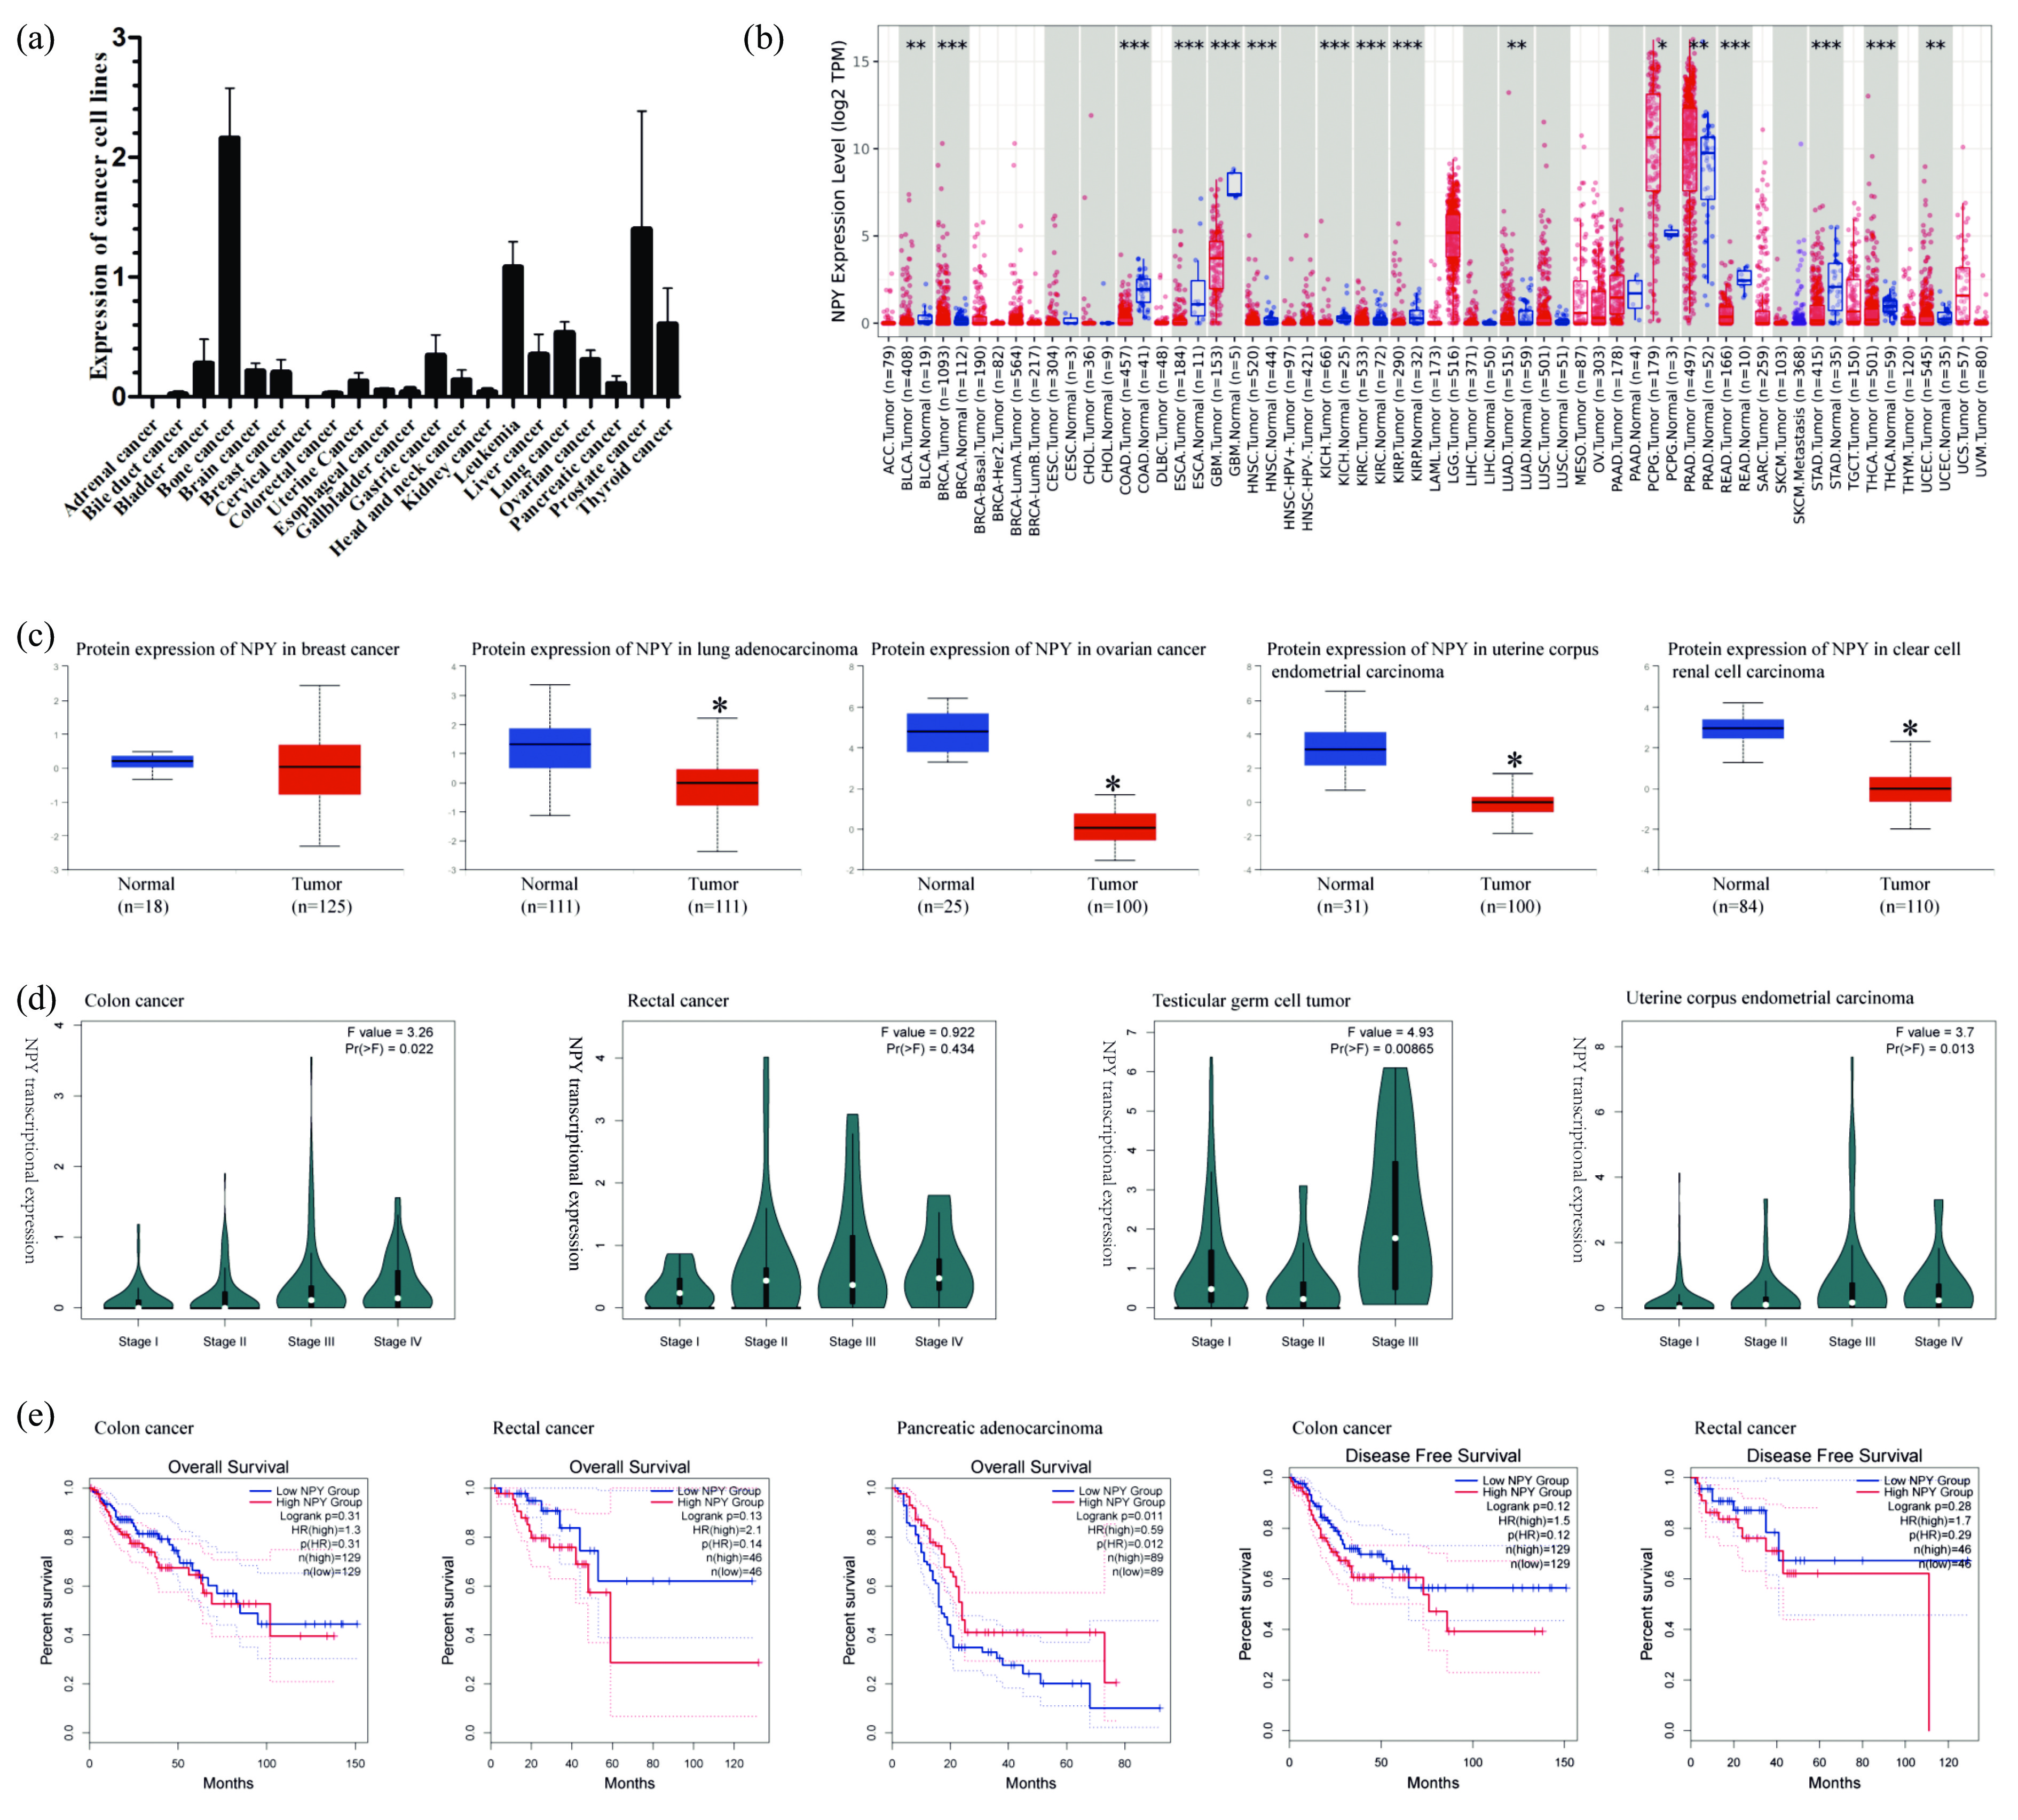
![]() (a) The expression status of NPY gene in different cancer cell lines through the database of Cancer Cell Line Encyclopedia. (b) The NPY expression was explored in tumor tissues from GEPIA (**P<0.01, ***P<0.001). (c) Based on the CPTAC dataset, the expression level of NPY total protein was analyzed between normal tissue and primary tissue of LUAD, BRCA, OV, KIRC, and UCEC (*P<0.05). (d) Based on the TCGA data, the expression level of NPY was analyzed by the pathological stages (stage I, stage II, stage III, and stage IV) of COAD, TGCT, and UCEC (P<0.05). (e) Correlation between NPY and overall survival / disease-free survival prognosis of cancers in TCGA.
(a) The expression status of NPY gene in different cancer cell lines through the database of Cancer Cell Line Encyclopedia. (b) The NPY expression was explored in tumor tissues from GEPIA (**P<0.01, ***P<0.001). (c) Based on the CPTAC dataset, the expression level of NPY total protein was analyzed between normal tissue and primary tissue of LUAD, BRCA, OV, KIRC, and UCEC (*P<0.05). (d) Based on the TCGA data, the expression level of NPY was analyzed by the pathological stages (stage I, stage II, stage III, and stage IV) of COAD, TGCT, and UCEC (P<0.05). (e) Correlation between NPY and overall survival / disease-free survival prognosis of cancers in TCGA.
-
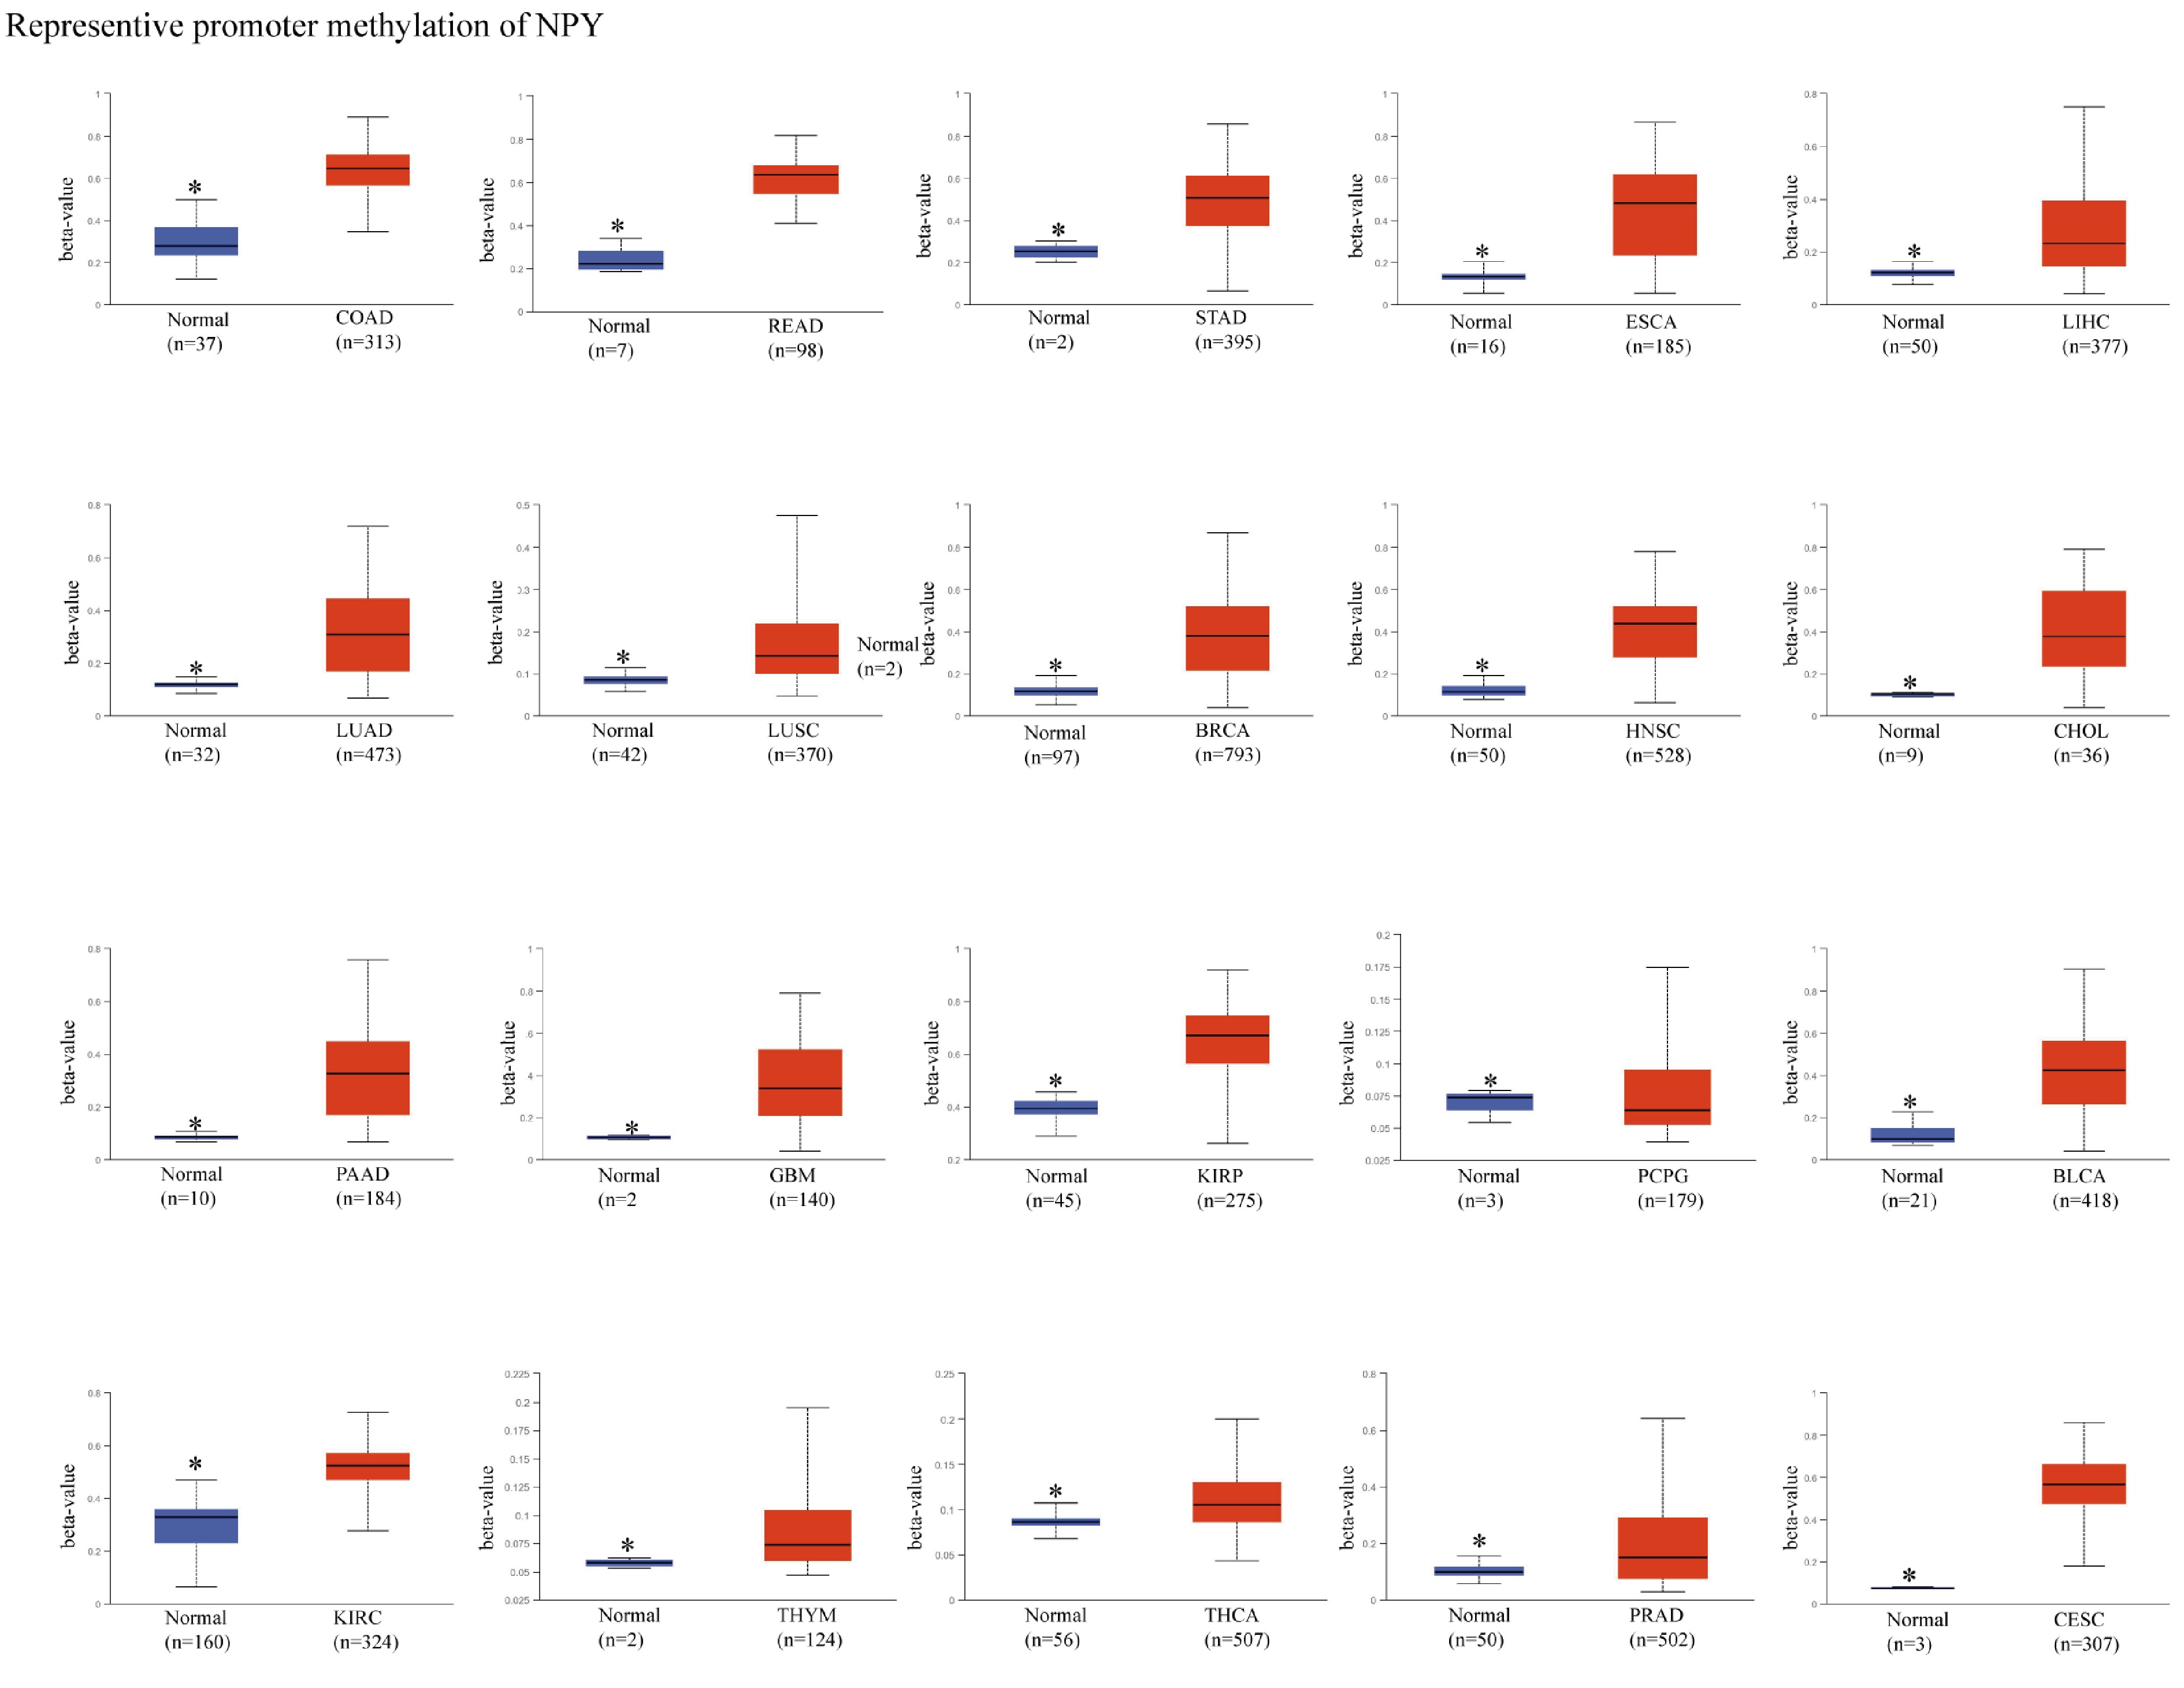
![]() Methylation feature of NPY in different tumors of TCGA (*P<0.05).
Methylation feature of NPY in different tumors of TCGA (*P<0.05).
-
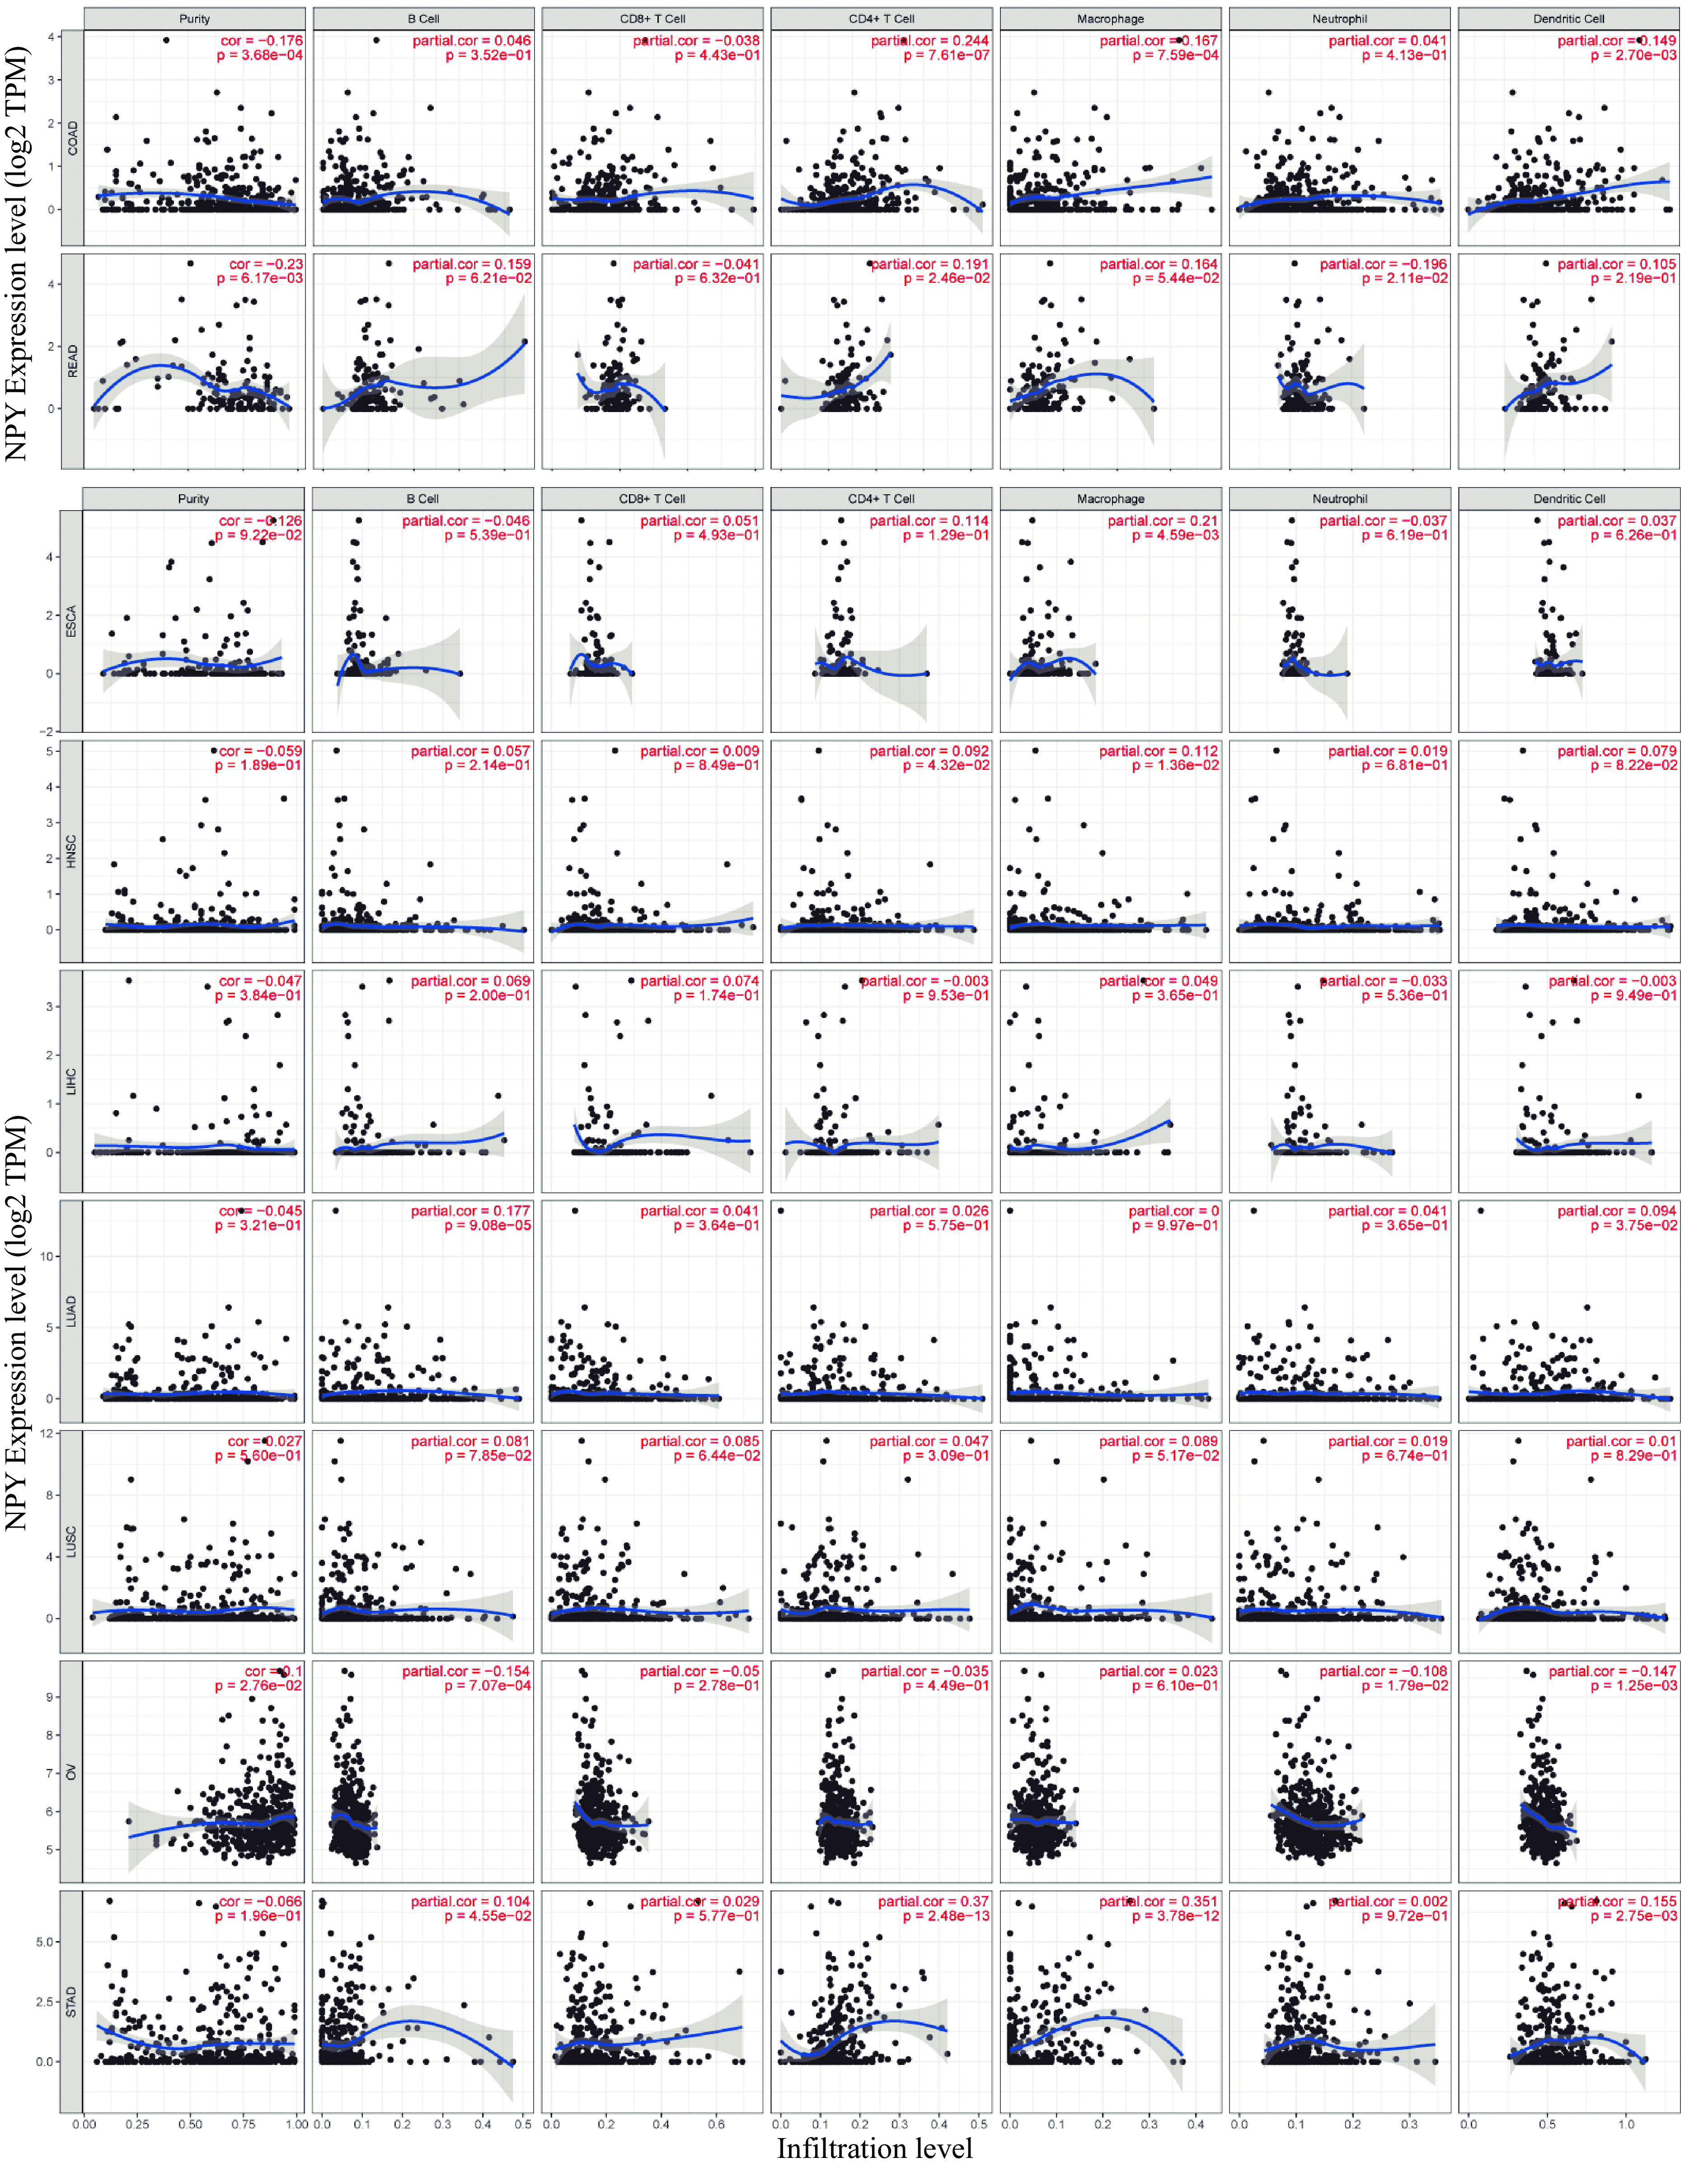
![]() Representive correlation analysis between NPY and immune infiltration cells.
Representive correlation analysis between NPY and immune infiltration cells.
-
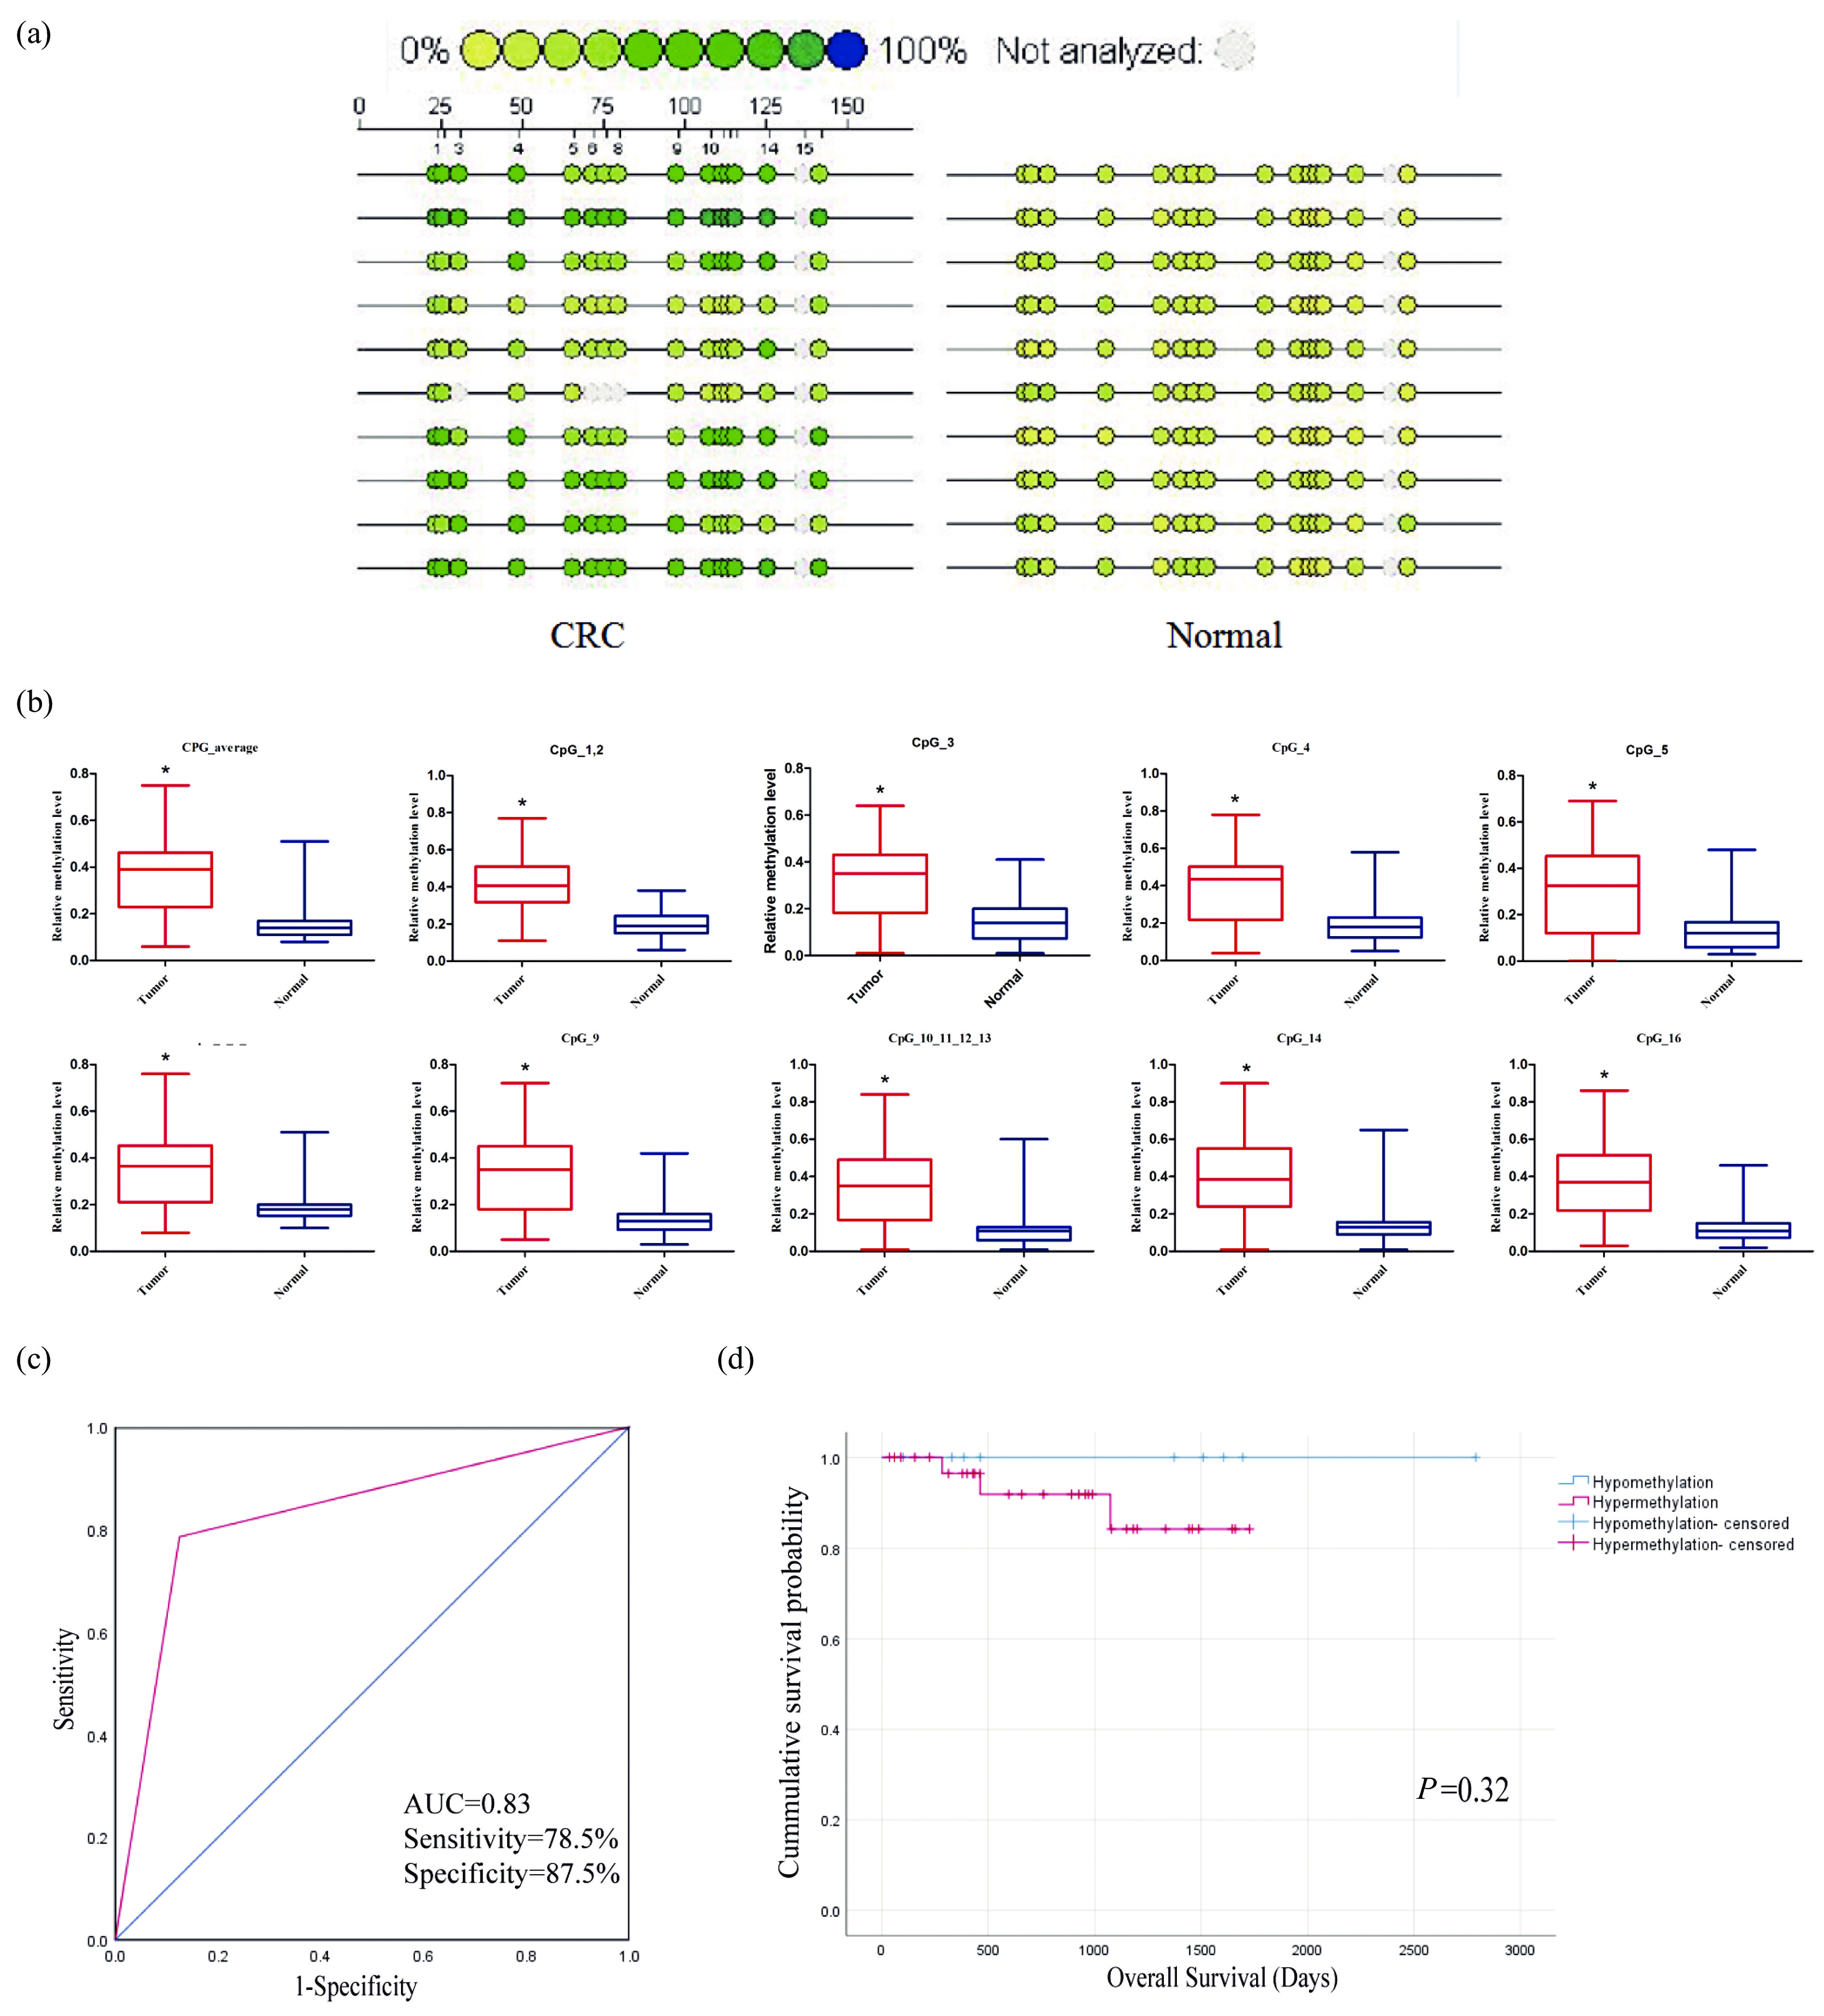
![]() Sequenom EpiTYPER system analysis of the average methylation ratio of NPY in CRC tissues. (a) The methylation level of NPY was significantly up-regulated in colorectal cancer compared to normal tissues (P<0.05). (b) All subgroup target CpG sites showed the same statistical differences (*P<0.0001). (c) ROC analysis of NPY methylation in CRC tissues: the AUC, sensitivity and specificity of NPY methylation were 0.83, 78.5%, 87.5%, respectively. (d) Kaplan-Meier survival analysis of NPY methylation for overall survival in colorectal cancer (P=0.32).
Sequenom EpiTYPER system analysis of the average methylation ratio of NPY in CRC tissues. (a) The methylation level of NPY was significantly up-regulated in colorectal cancer compared to normal tissues (P<0.05). (b) All subgroup target CpG sites showed the same statistical differences (*P<0.0001). (c) ROC analysis of NPY methylation in CRC tissues: the AUC, sensitivity and specificity of NPY methylation were 0.83, 78.5%, 87.5%, respectively. (d) Kaplan-Meier survival analysis of NPY methylation for overall survival in colorectal cancer (P=0.32).
-
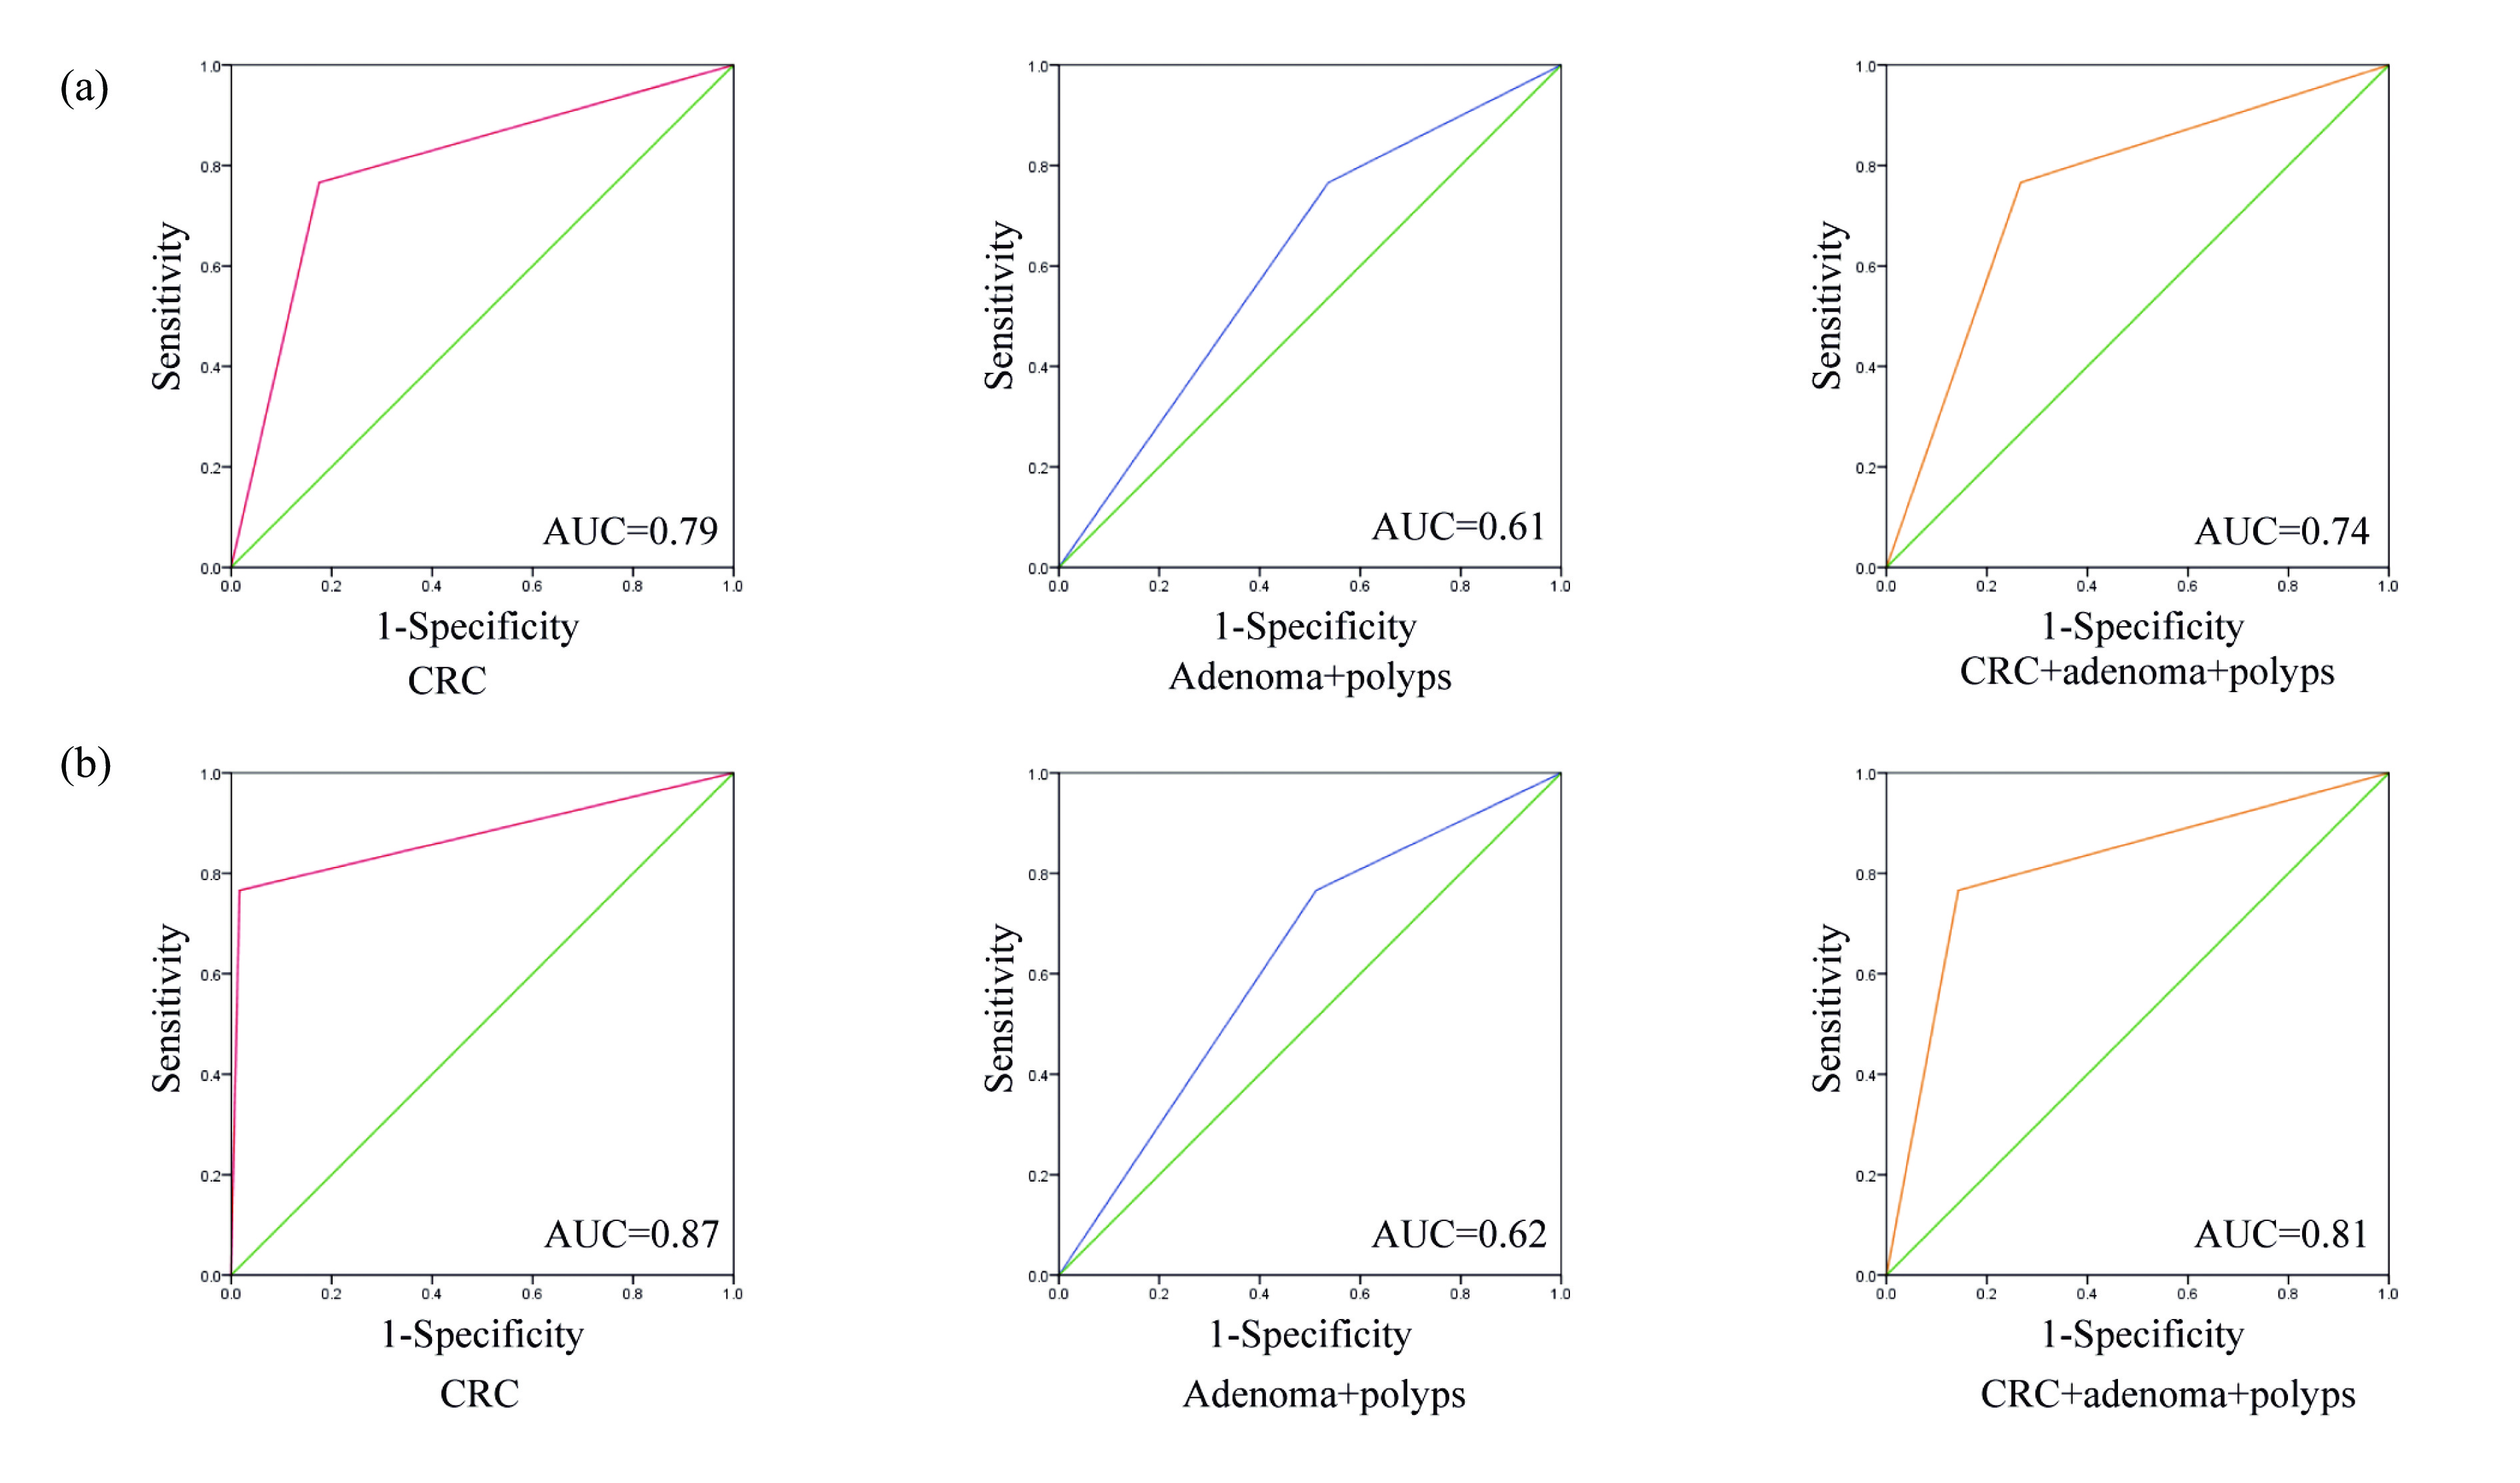
![]() ROC curve analysis of NPY methylation in fecal samples. (a) The sensitivity, specificity, and AUC value of fecal NPY methylation test for the diagnosis of colorectal cancer were 82.5%, 76.6%, and 0.79, respectively. (b) The sensitivity, specificity, and AUC value of fecal NPY methylation test and fecal immunochemical test for the diagnosis of colorectal cancer were 98.3%, 76.6%, and 0.87, respectively.
ROC curve analysis of NPY methylation in fecal samples. (a) The sensitivity, specificity, and AUC value of fecal NPY methylation test for the diagnosis of colorectal cancer were 82.5%, 76.6%, and 0.79, respectively. (b) The sensitivity, specificity, and AUC value of fecal NPY methylation test and fecal immunochemical test for the diagnosis of colorectal cancer were 98.3%, 76.6%, and 0.87, respectively.
-
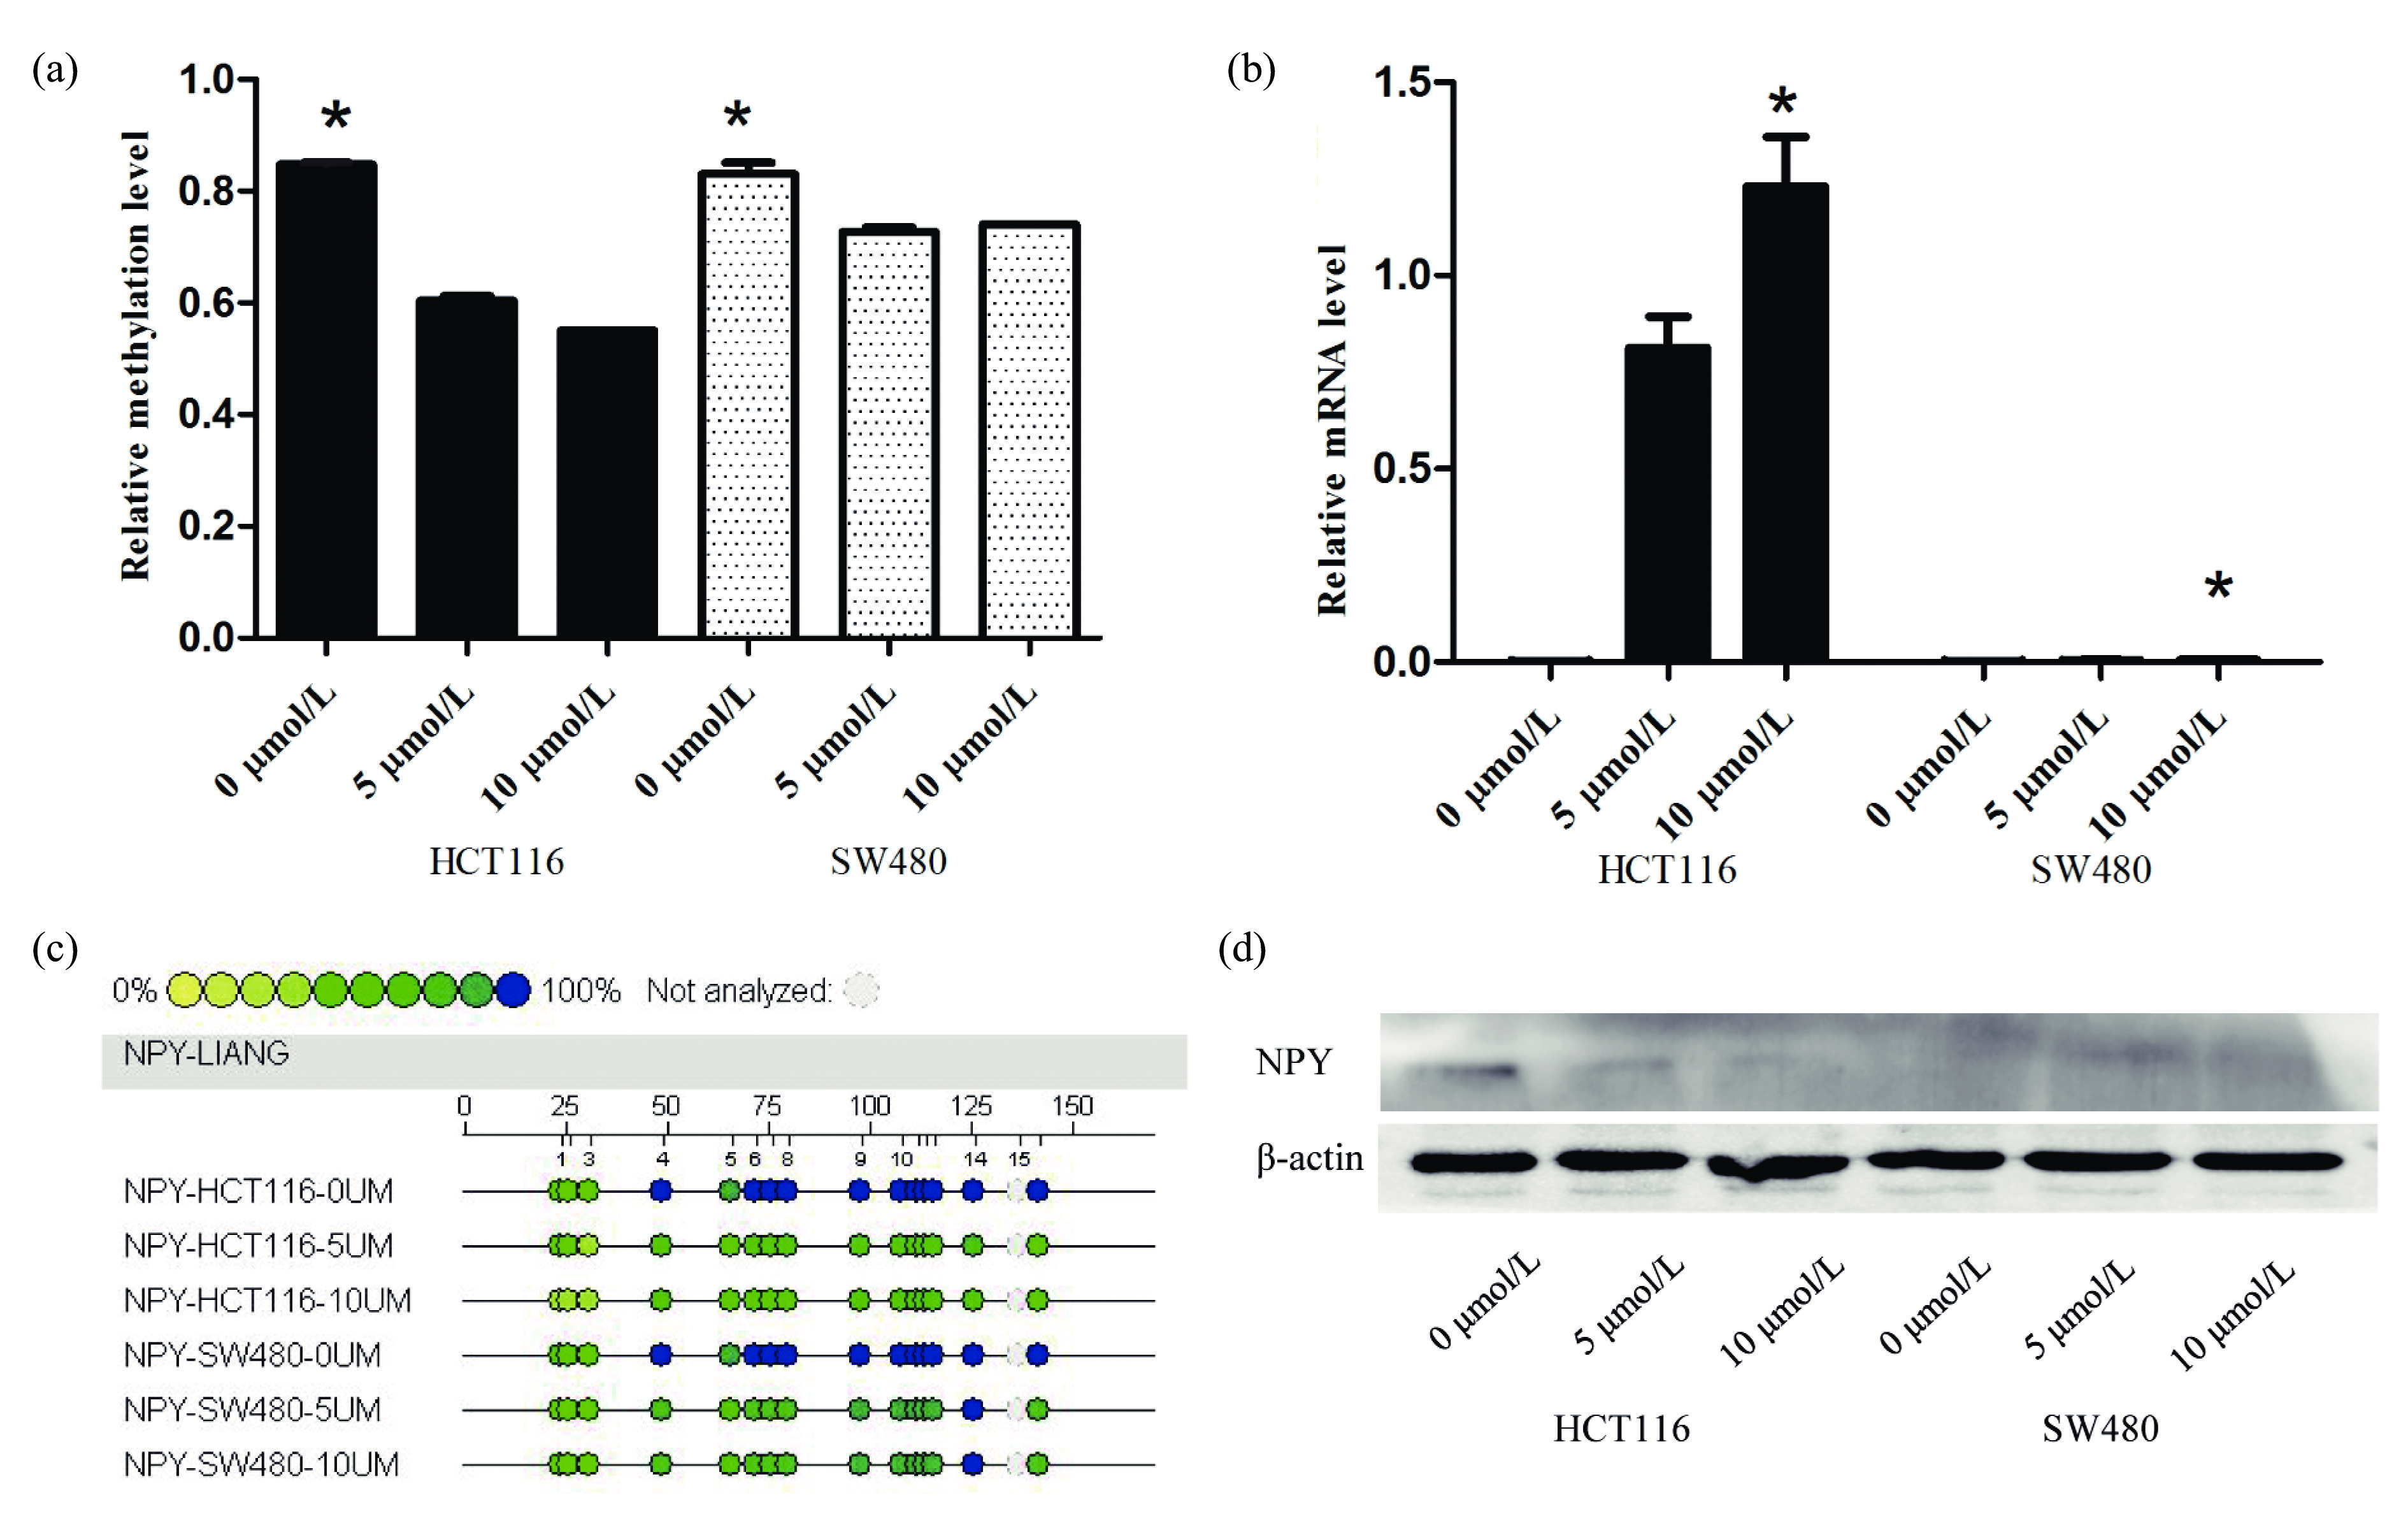
![]() (a, c) Sequenom EpiTYPER system analysis of the average methylation ratio of NPY in CRC cell lines treated with 5-Aza-2’-deoxycytidine (0 μmol/L vs 5 μmol/L vs 10 μmol/L) (*P<0.05). (b) SYBR analysis of the relative mRNA level of NPY in CRC cell lines treated with 5-Aza-2’-deoxycytidine (0 μmol/L vs 5 μmol/L vs 10 μmol/L) (*P<0.05). (d) Western blot analysis of the protein level of NPY in CRC cell lines treated with 5-Aza-2’-deoxycytidine (0 μmol/L vs 5 μmol/L vs 10 μmol/L) (P<0.05).
(a, c) Sequenom EpiTYPER system analysis of the average methylation ratio of NPY in CRC cell lines treated with 5-Aza-2’-deoxycytidine (0 μmol/L vs 5 μmol/L vs 10 μmol/L) (*P<0.05). (b) SYBR analysis of the relative mRNA level of NPY in CRC cell lines treated with 5-Aza-2’-deoxycytidine (0 μmol/L vs 5 μmol/L vs 10 μmol/L) (*P<0.05). (d) Western blot analysis of the protein level of NPY in CRC cell lines treated with 5-Aza-2’-deoxycytidine (0 μmol/L vs 5 μmol/L vs 10 μmol/L) (P<0.05).
Related articles
-
2023, 53(3): 0303. DOI: 10.52396/JUSTC-2022-0167
-
2022, 52(9): 3-1-3-13. DOI: 10.52396/JUSTC-2022-0010
-
2021, 51(2): 140-146. DOI: 10.52396/JUST-2020-0006
-
2021, 51(1): 12-21. DOI: 10.52396/JUST-2020-0007
-
2020, 50(11): 1411. DOI: 10.3969/j.issn.0253-2778.2020.11.005
-
2020, 50(4): 474-478. DOI: 10.3969/j.issn.0253-2778.2020.04.012
-
2015, 45(5): 388-396. DOI: 10.3969/j.issn.0253-2778.2015.05.007
-
2014, 44(8): 623-636. DOI: 10.3969/j.issn.0253-2778.2014.08.001
-
2014, 44(4): 270-277. DOI: 10.3969/j.issn.0253-2778.2014.04.003
-
1990, 20(1-4): 1-704.
