
 Download:
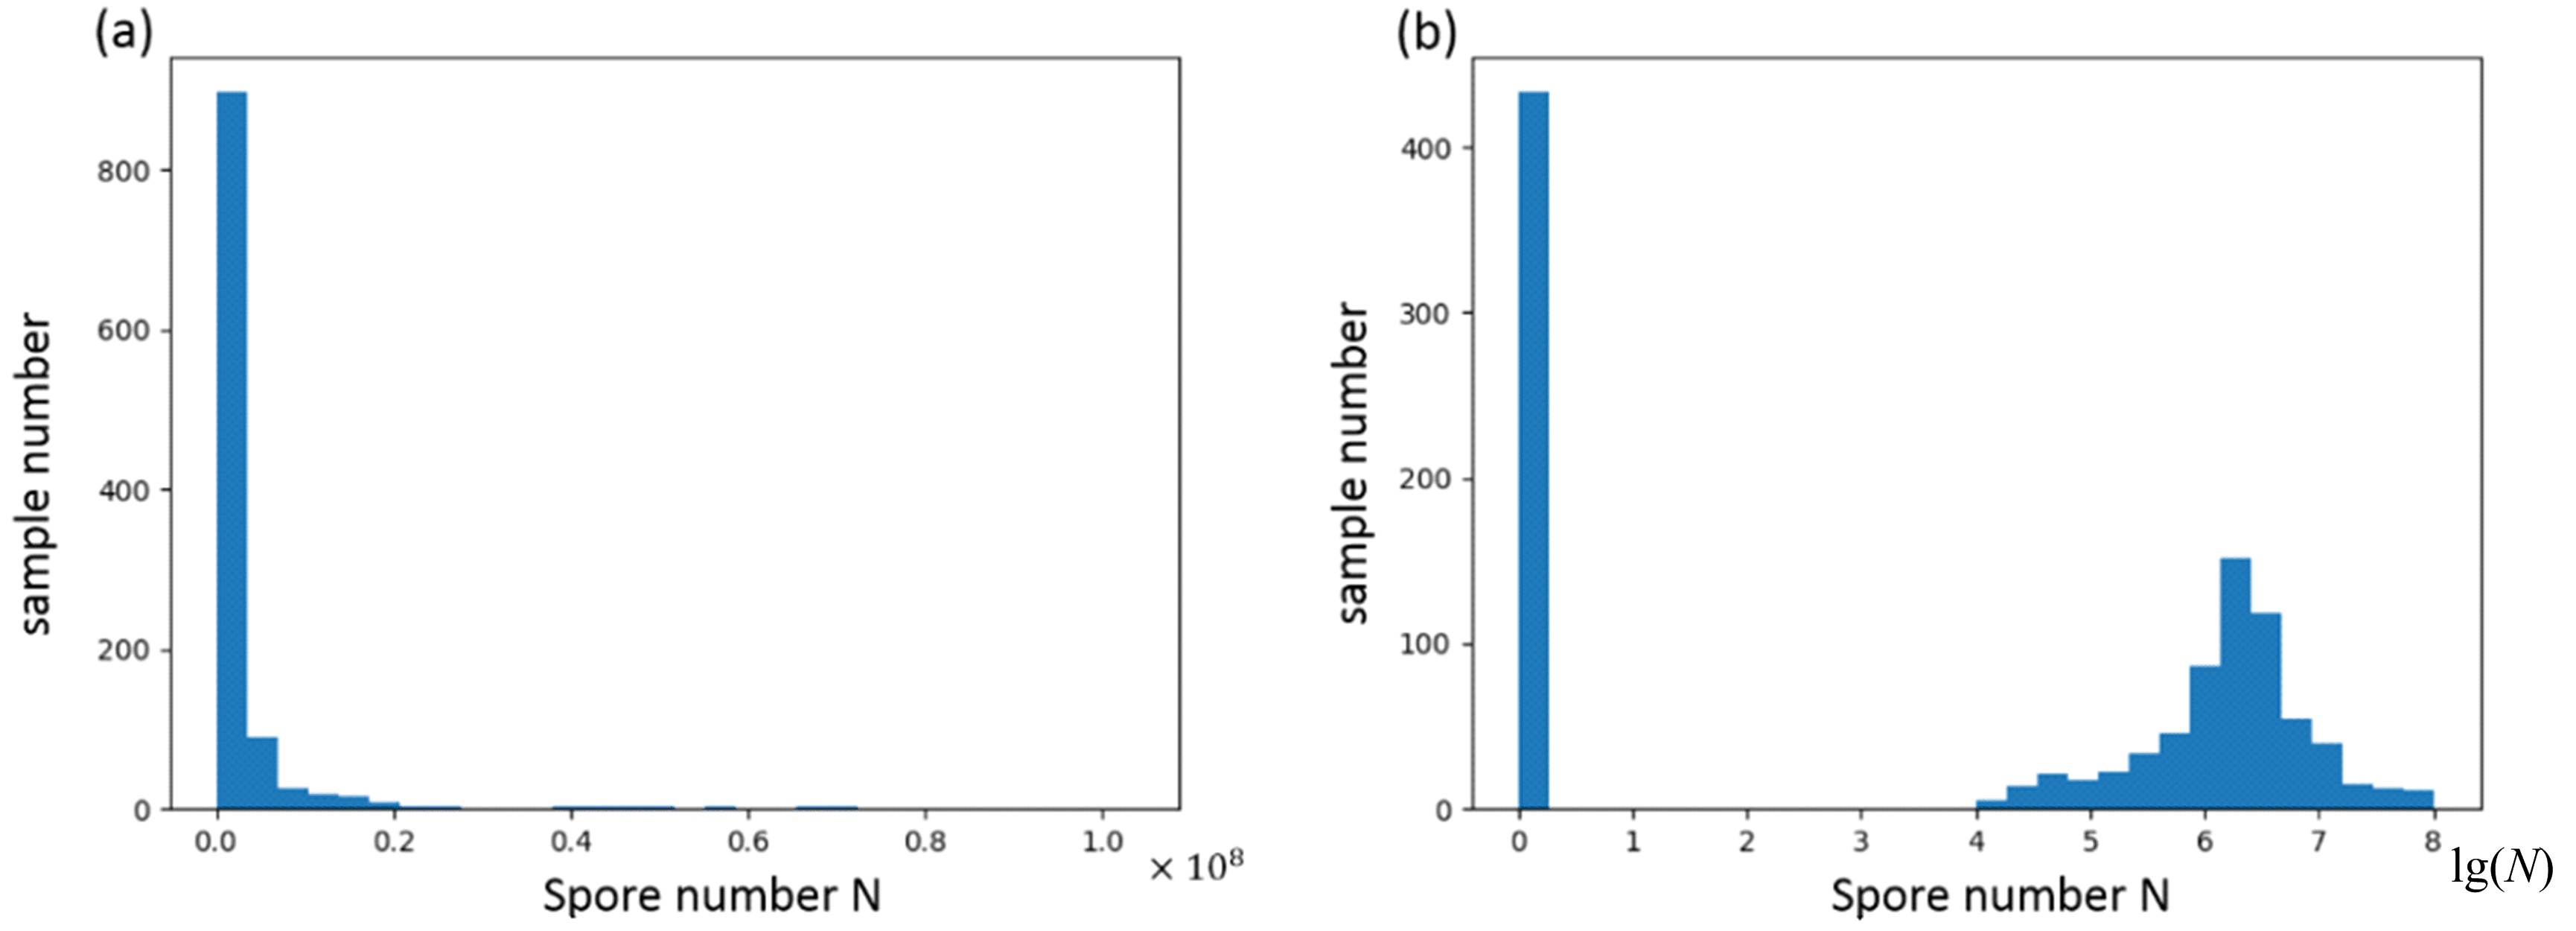
The distribution of spore number.
Figures of the Article
-
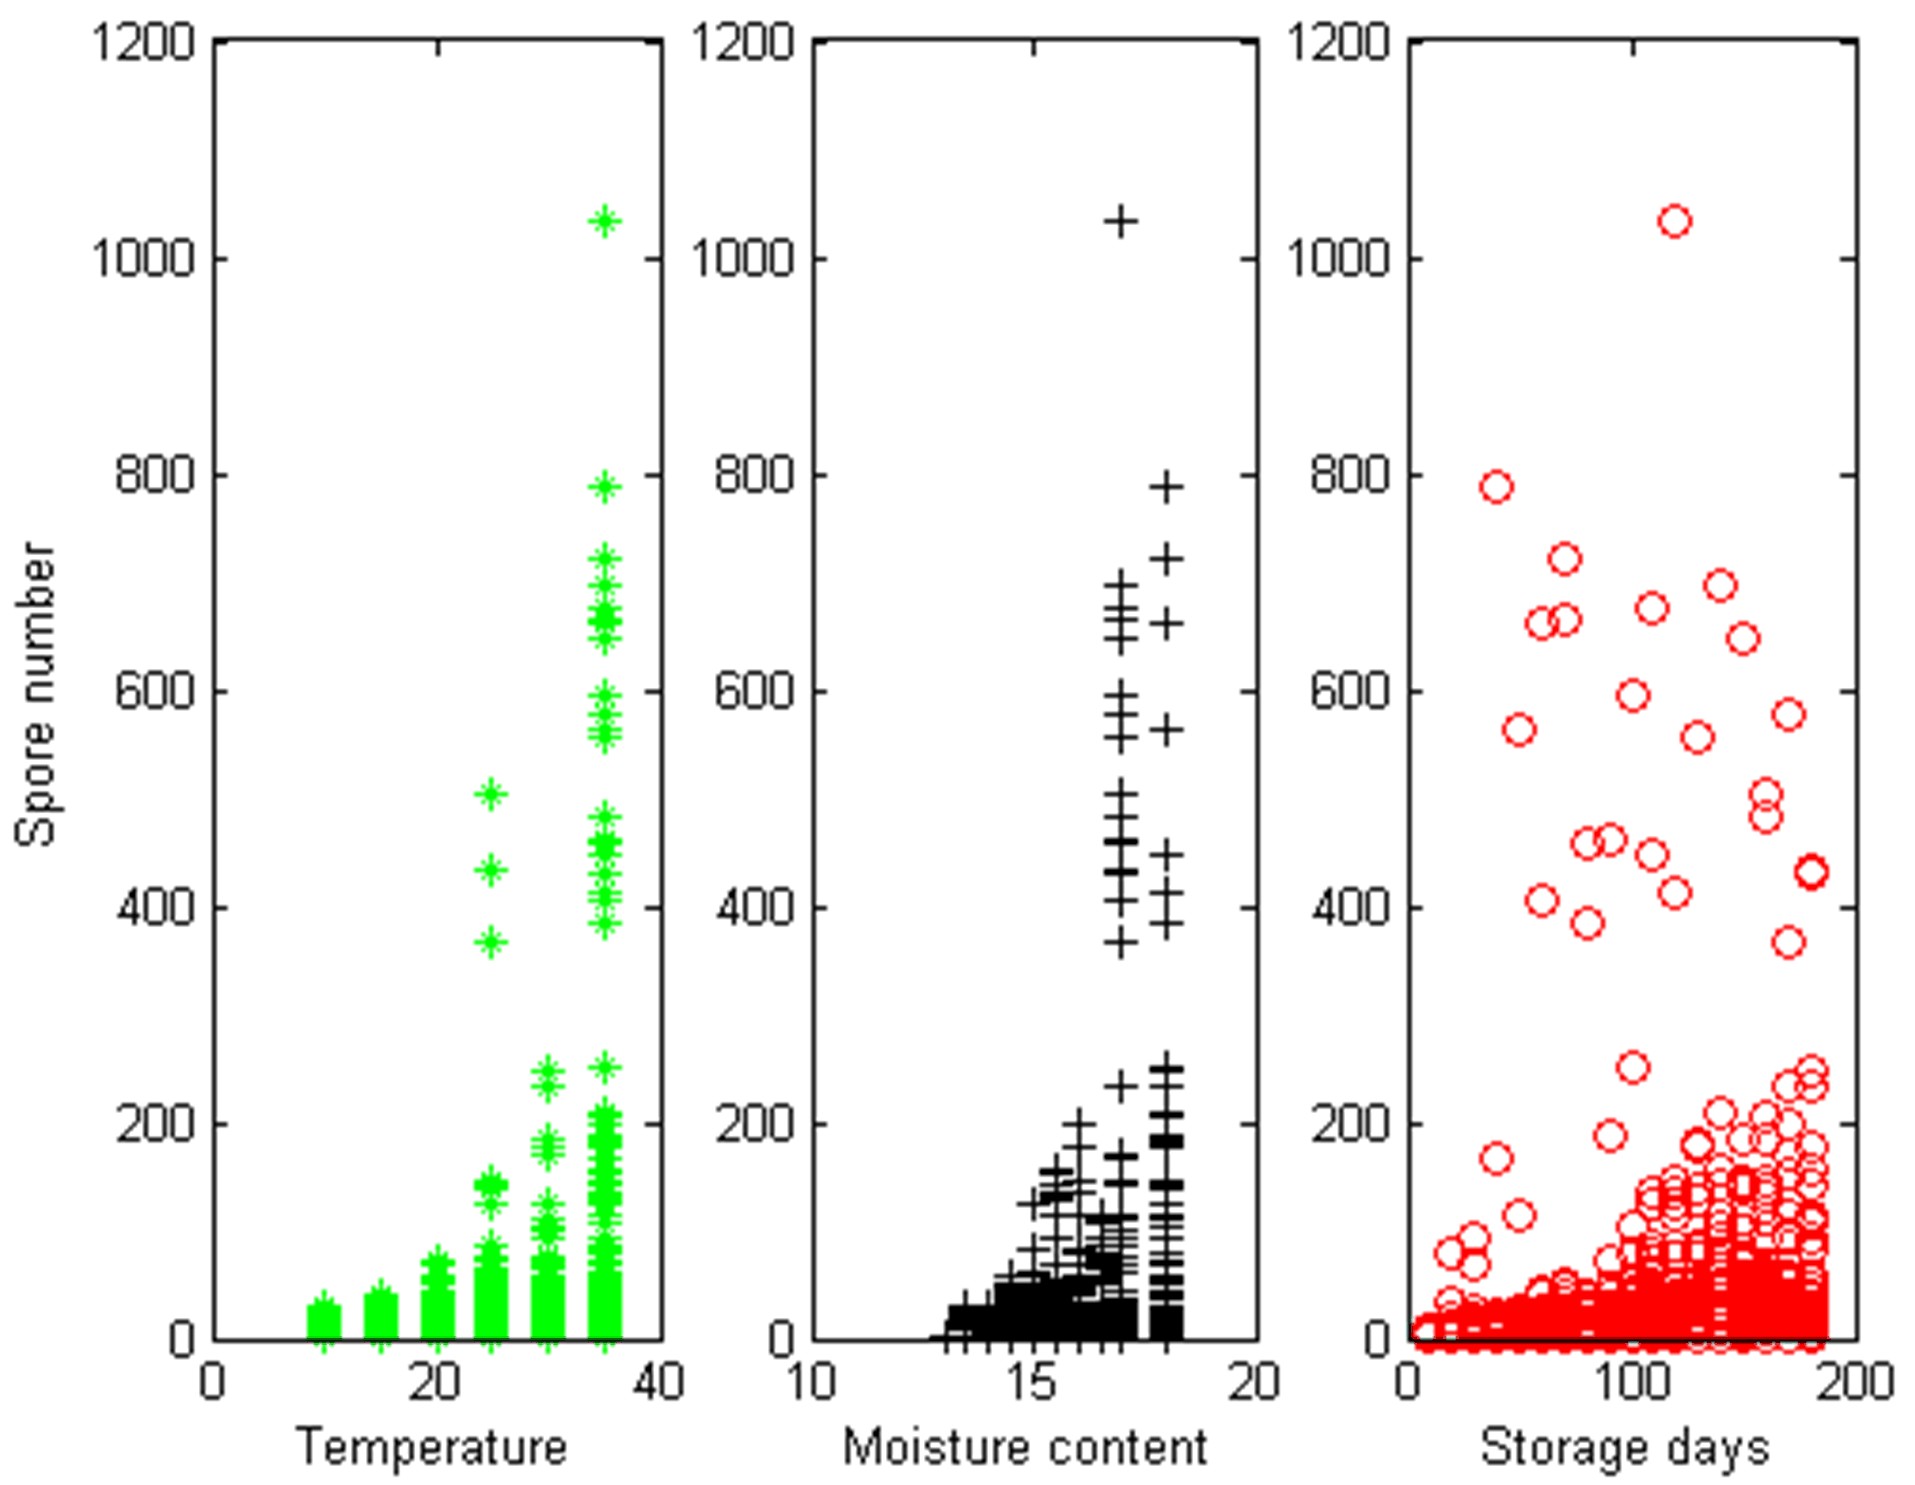
![]() Spore number along with ambient temperature, rice moisture content and storage days.
Spore number along with ambient temperature, rice moisture content and storage days.
-
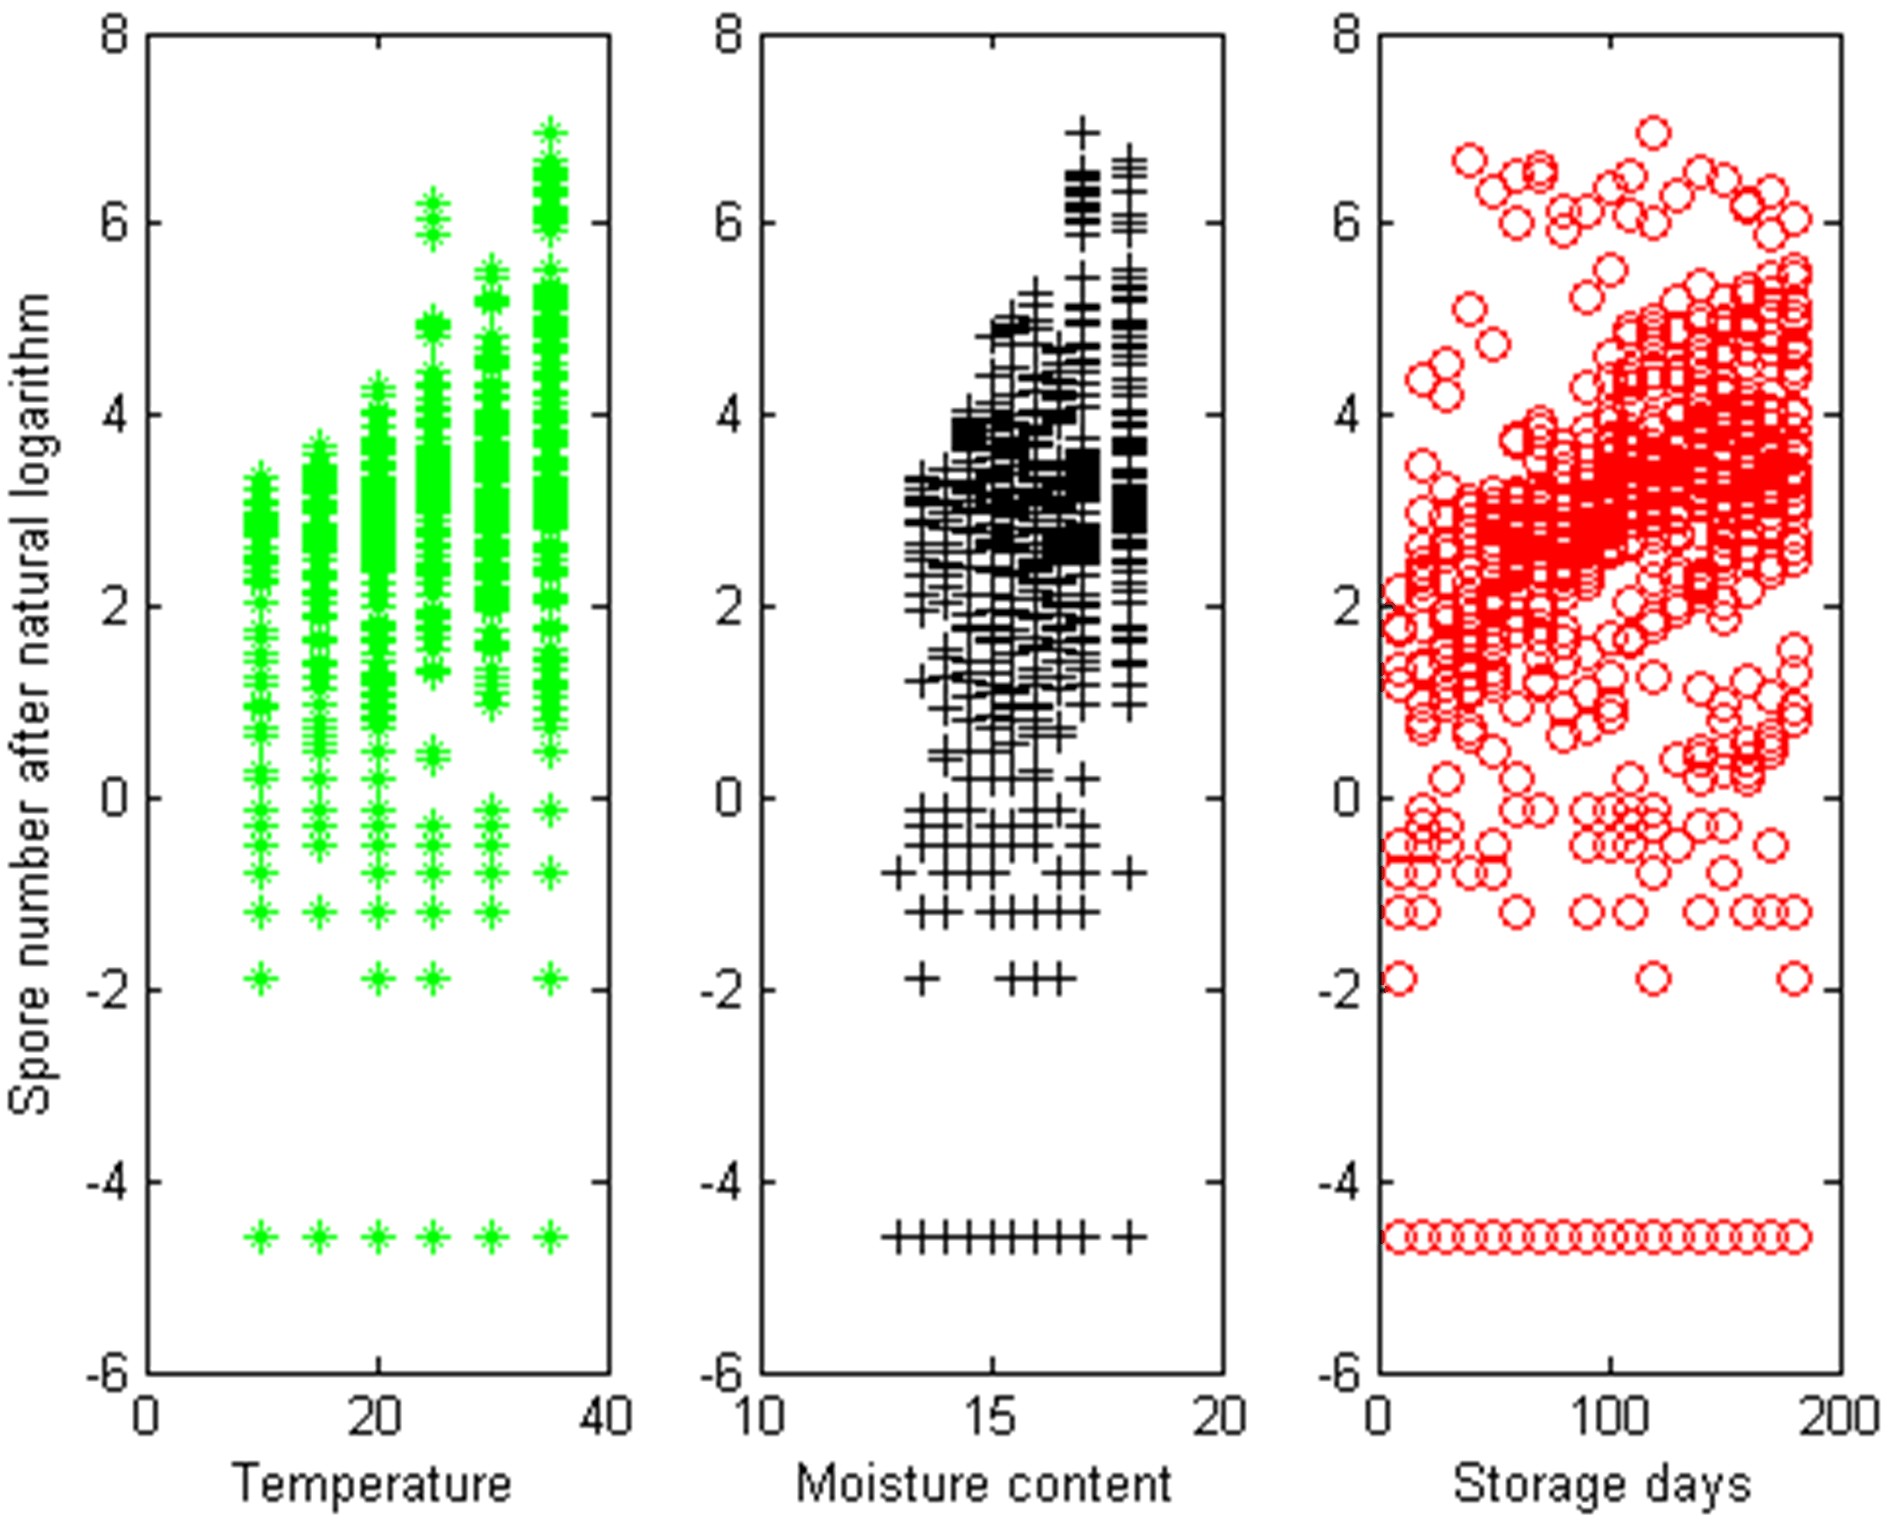
![]() Scatter plot after taking a natural logarithm of the spore number.
Scatter plot after taking a natural logarithm of the spore number.
-
![]() Residual case order plot.
Residual case order plot.
-
![]() The distribution of spore number.
The distribution of spore number.
-
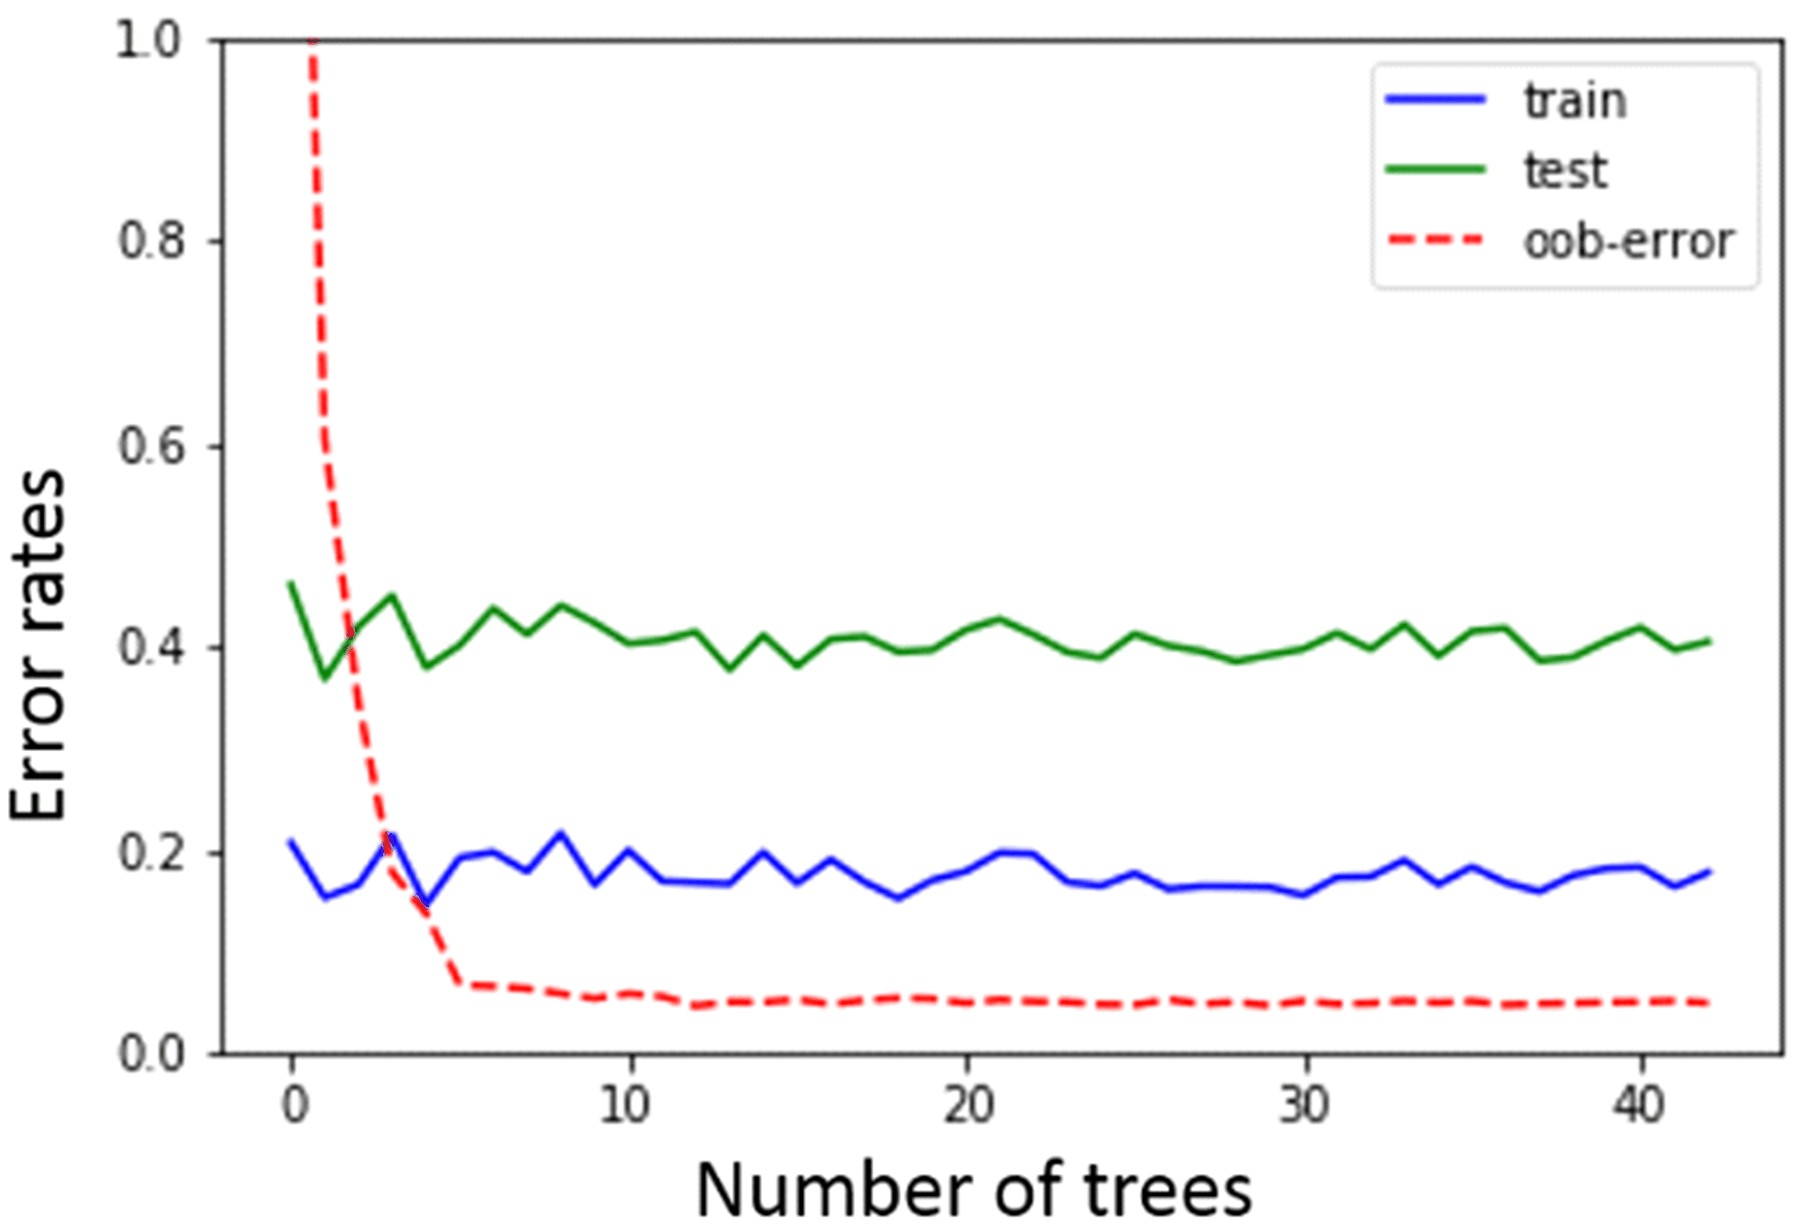
![]() Comparison of training, out-of-bag, and independent test set error rates for random forest as the number of trees increases.
Comparison of training, out-of-bag, and independent test set error rates for random forest as the number of trees increases.
-
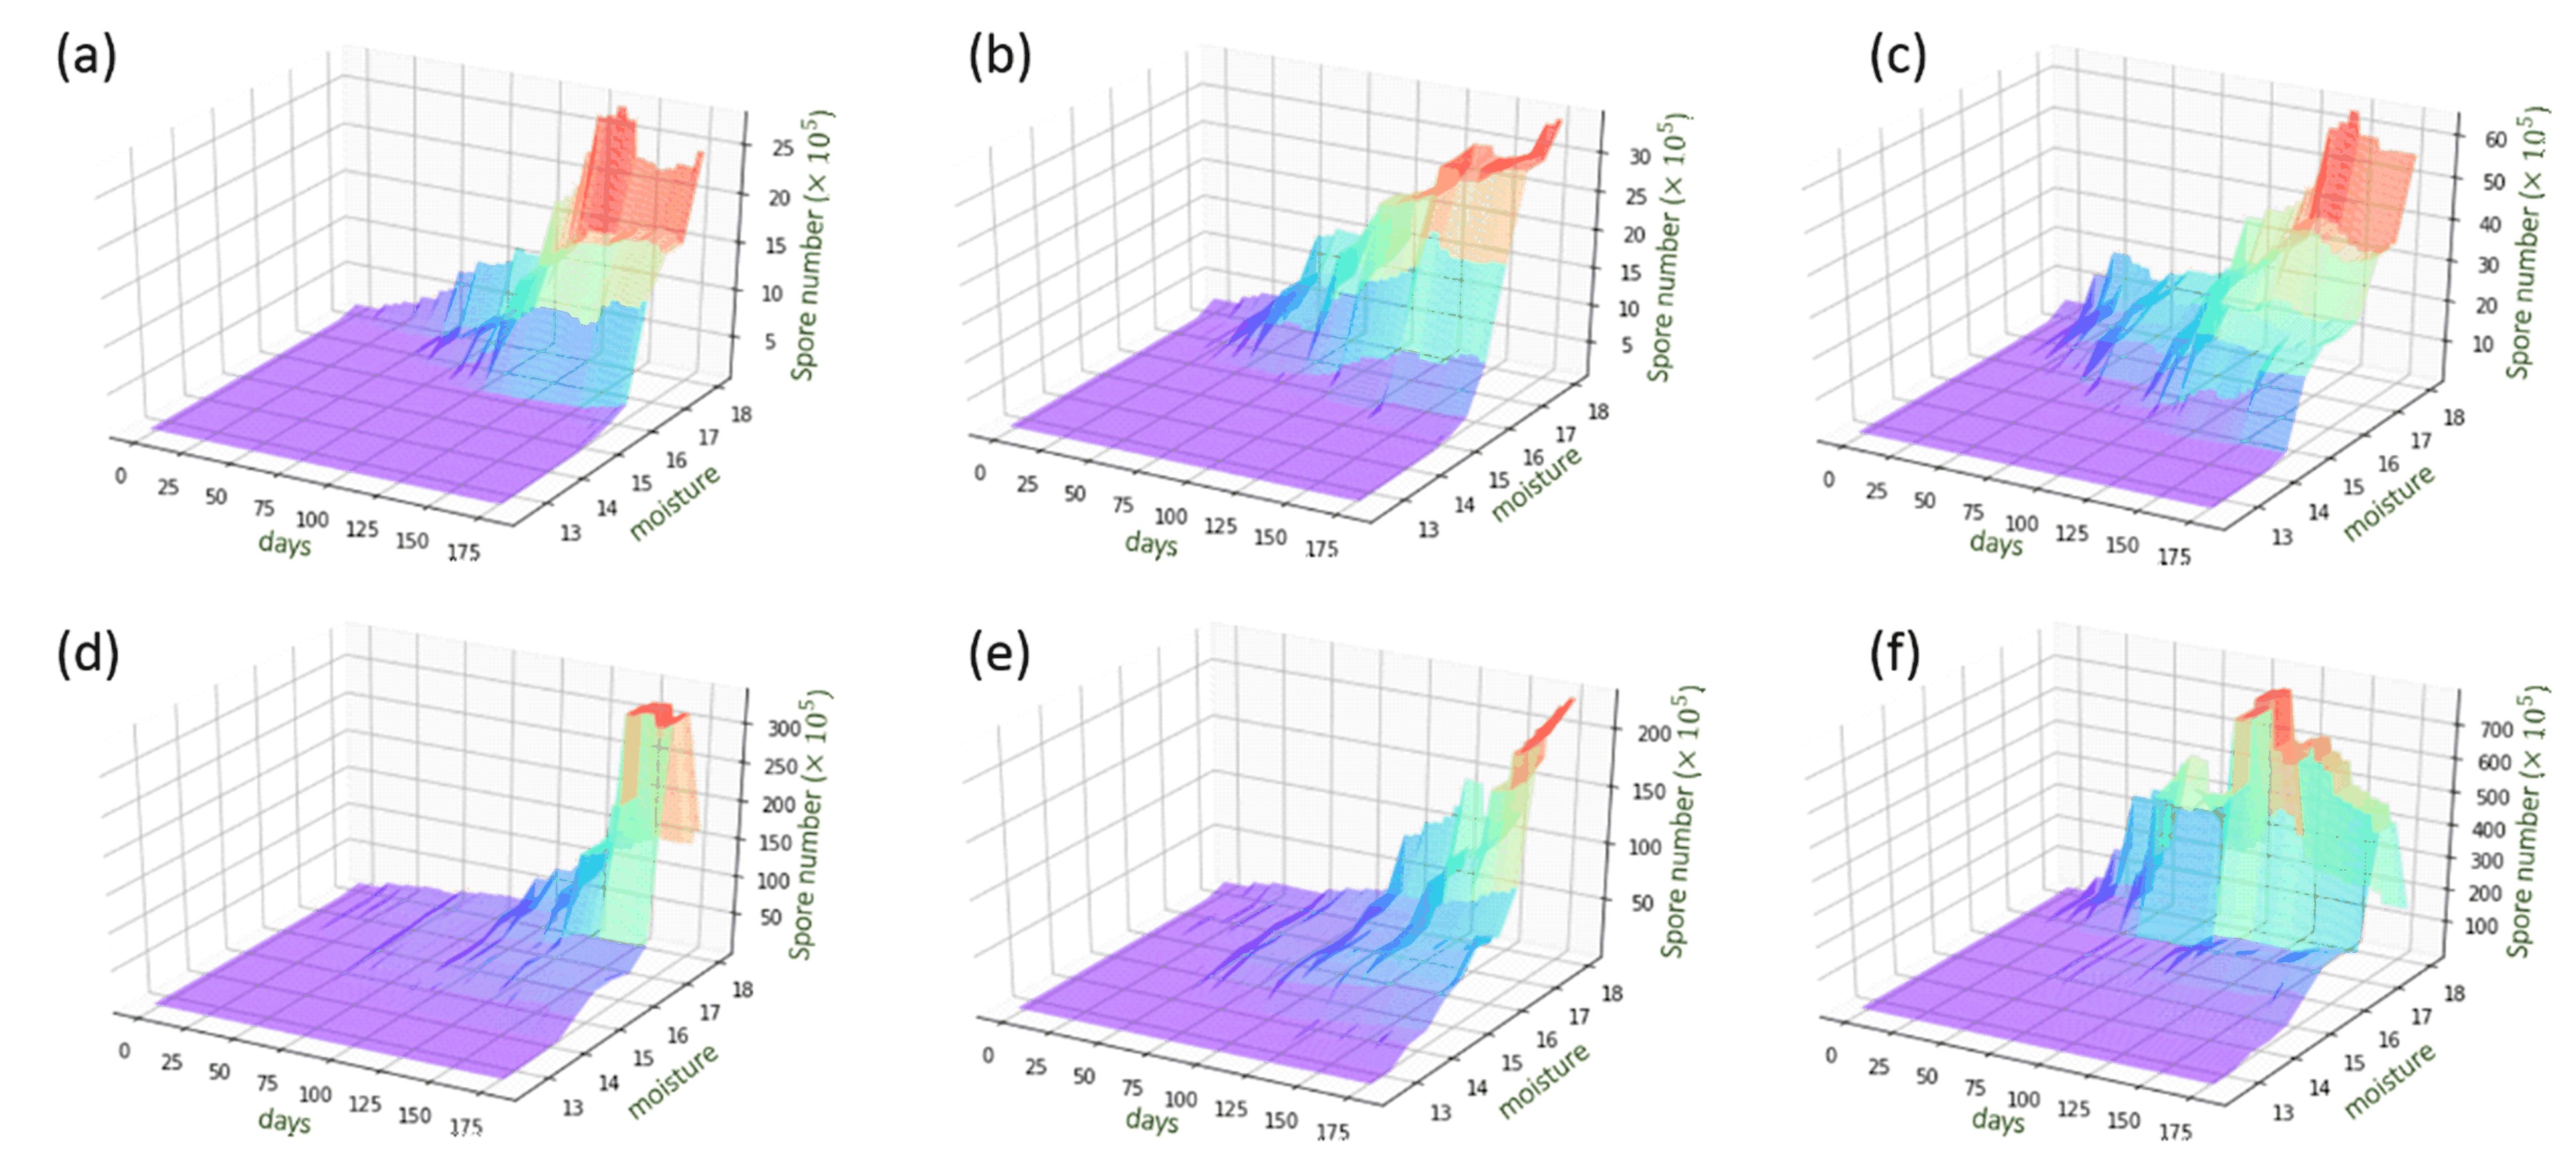
![]() Prediction surface graph in different temperature of 10 ℃ (a), 15 ℃ (b), 20 ℃ (c), 25 ℃ (d), 30 ℃ (e), 35 ℃(f).
Prediction surface graph in different temperature of 10 ℃ (a), 15 ℃ (b), 20 ℃ (c), 25 ℃ (d), 30 ℃ (e), 35 ℃(f).
-
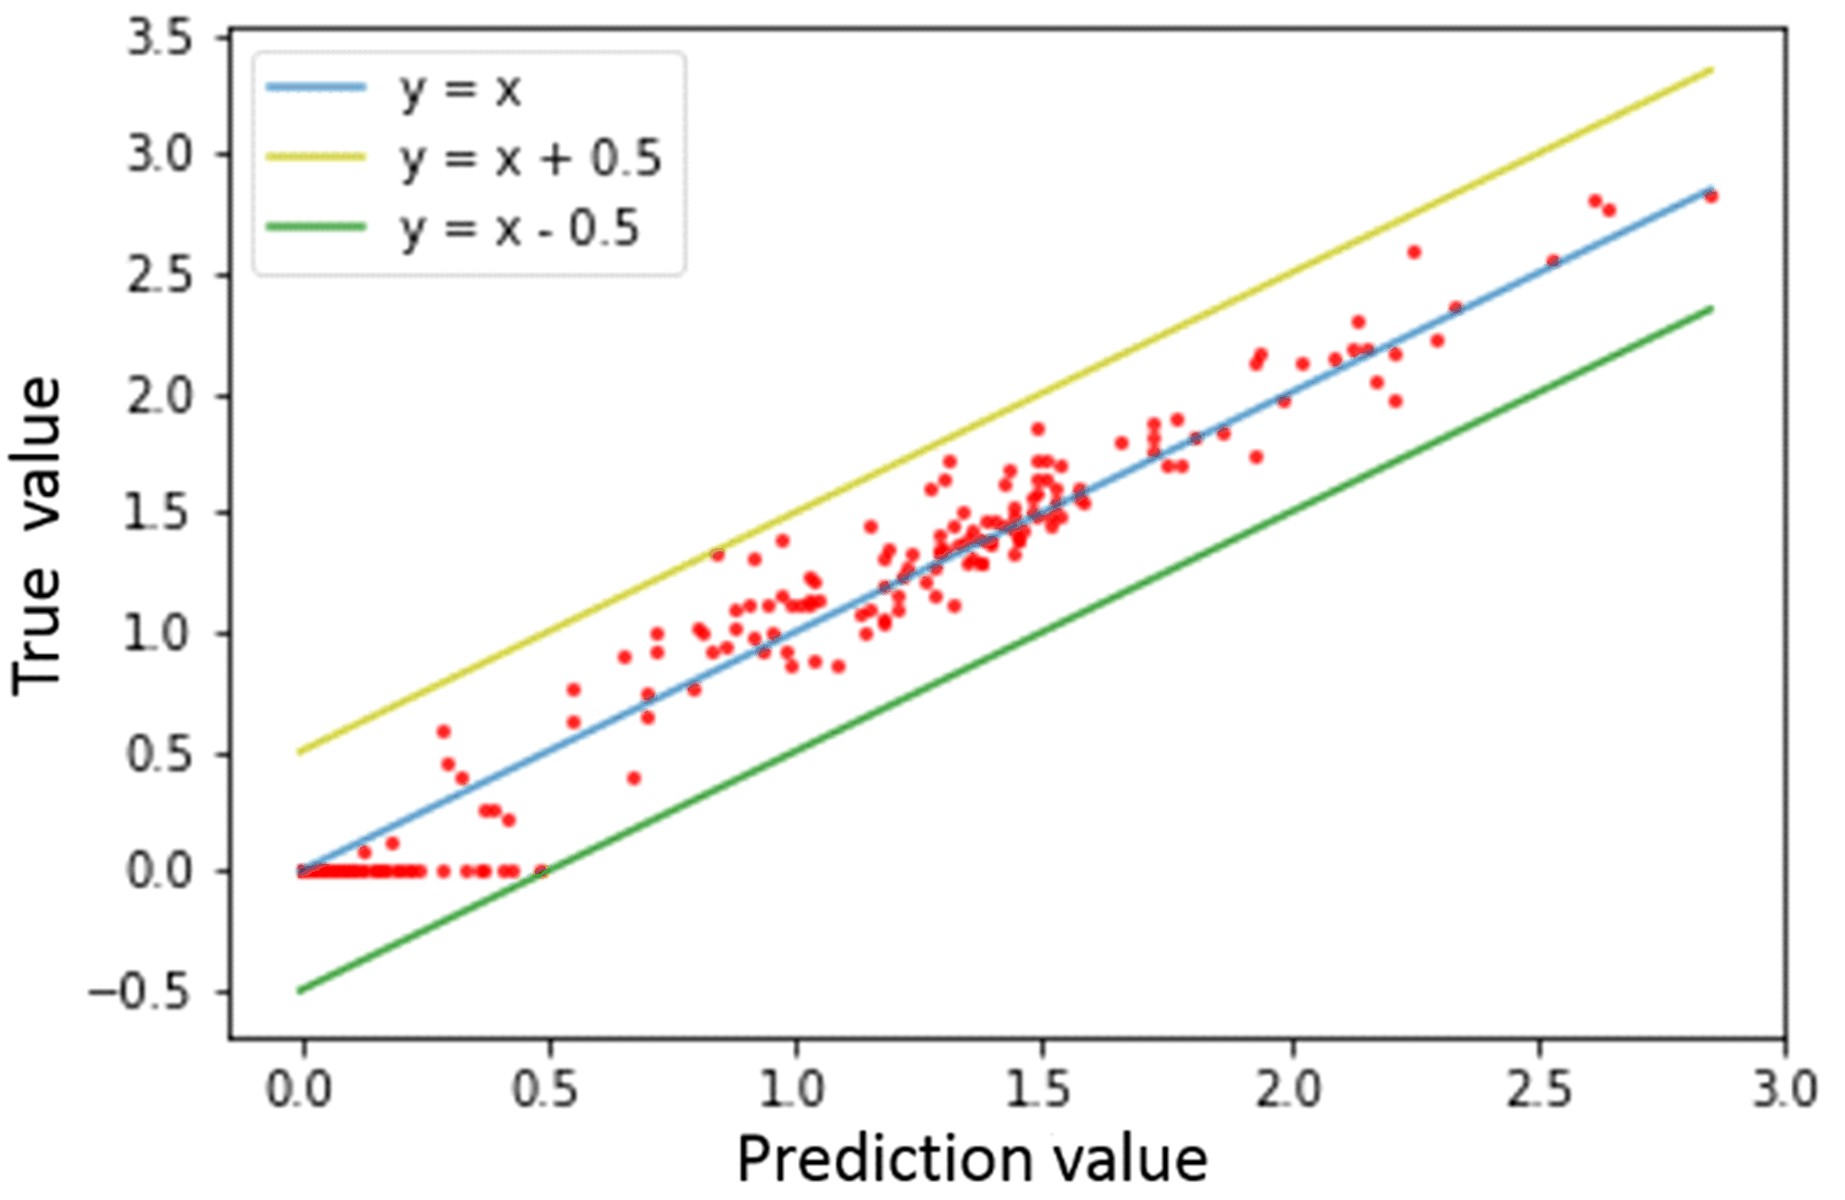
![]() The Scatter plot of prediction value and true value.
The Scatter plot of prediction value and true value.

Related articles
-
2022, 52(5): 2-1-2-6. DOI: 10.52396/JUSTC-2021-0208
-
2022, 52(4): 5-1-5-8. DOI: 10.52396/JUSTC-2022-0016
-
2021, 51(3): 216-227. DOI: 10.52396/JUST-2021-0053
-
2020, 50(10): 1291. DOI: 10.3969/j.issn.0253-2778.2020.10.002
-
2019, 49(8): 635-644. DOI: 10.3969/j.issn.0253-2778.2019.08.007
-
2019, 49(5): 390-396. DOI: 10.3969/j.issn.0253-2778.2019.05.006
-
2018, 48(4): 284-289. DOI: 10.3969/j.issn.0253-2778.2018.04.003
-
2018, 48(1): 28-34. DOI: 10.3969/j.issn.0253-2778.2018.01.004
-
2017, 47(8): 653-664. DOI: 10.3969/j.issn.0253-2778.2017.08.004
-
2015, 45(2): 101-106. DOI: 10.3969/j.issn.0253-2778.2015.02.002
