DOCX format
JUSTC-2024-0025 Supporting information
Download(233KB)JUSTC-2024-0025 Supporting information
Figures of the Article
-
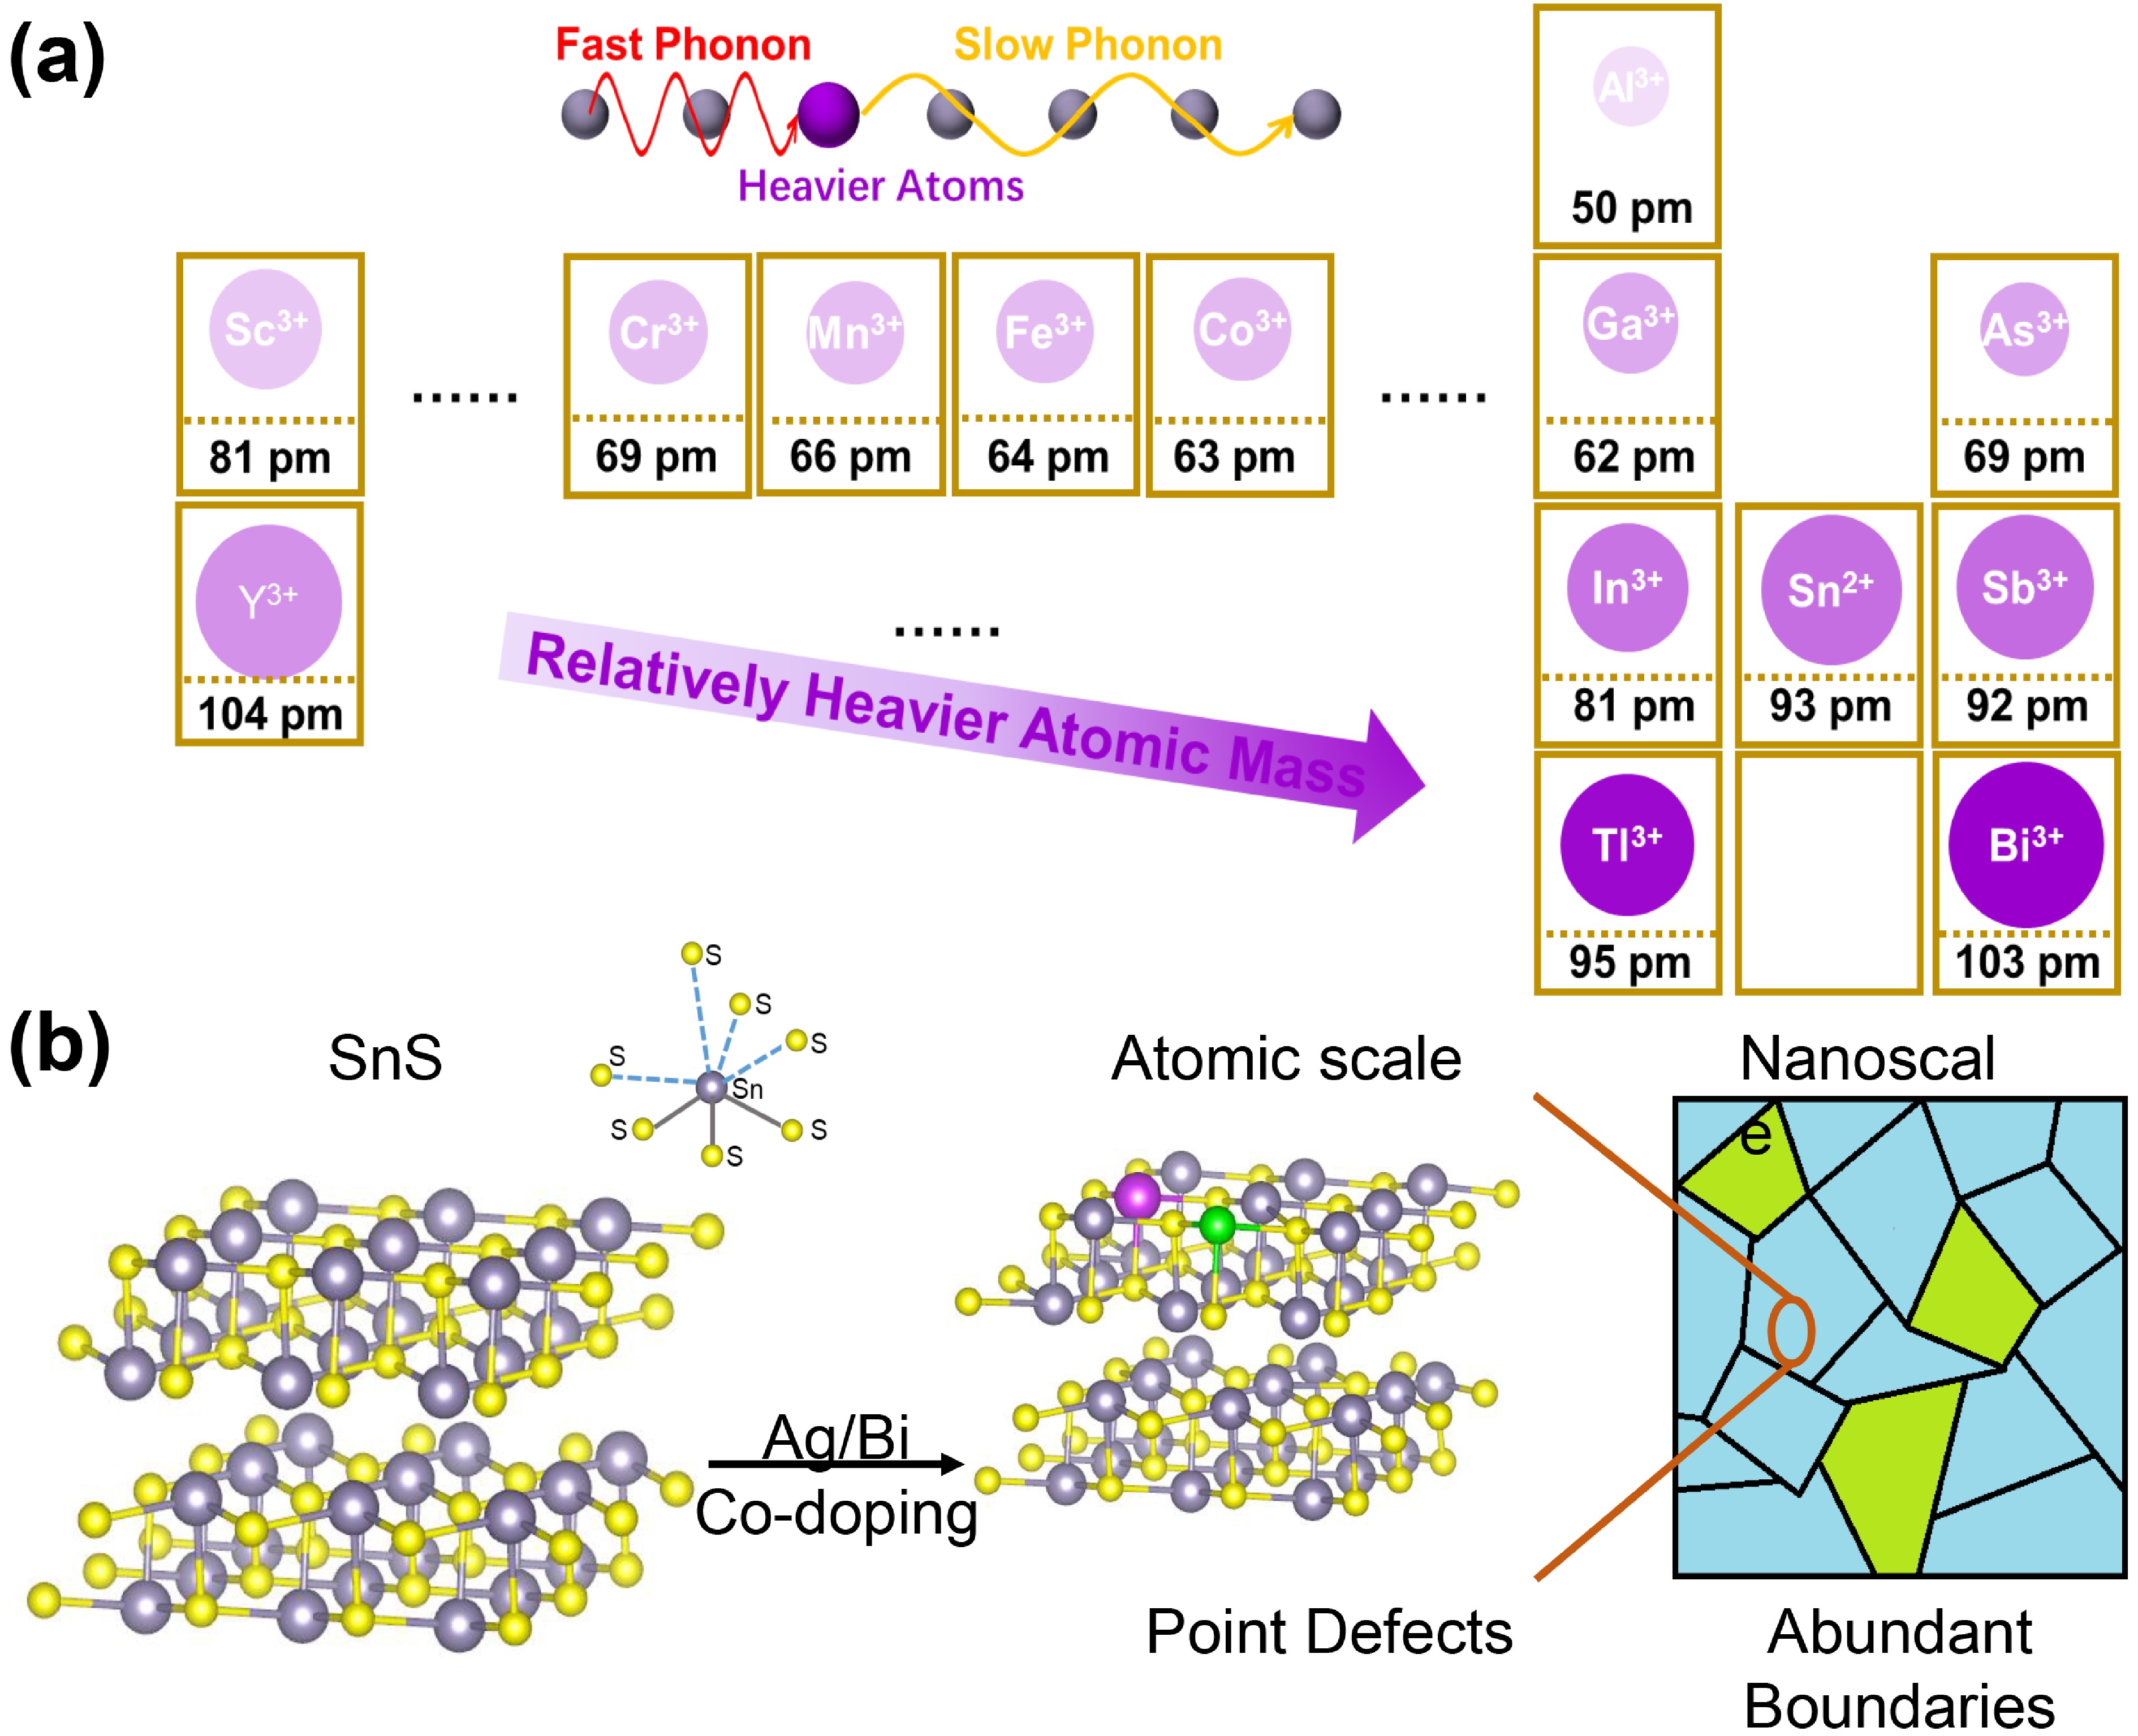
![]() (a) Illustration of atomic mass of metals with trivalent ions. Darker colors mean heavier atomic mass, and the radii of the circles reflect of their trivalent ions. Top scheme shows phonons’ group velocity declines when meeting with heavier atoms. (b) Illustration of SnS crystal structure and changes after charge balance codoping, in which gray, yellow, purple, and green balls refers to Sn2+, S2−, Bi3+, and Ag+, respectively.
(a) Illustration of atomic mass of metals with trivalent ions. Darker colors mean heavier atomic mass, and the radii of the circles reflect of their trivalent ions. Top scheme shows phonons’ group velocity declines when meeting with heavier atoms. (b) Illustration of SnS crystal structure and changes after charge balance codoping, in which gray, yellow, purple, and green balls refers to Sn2+, S2−, Bi3+, and Ag+, respectively.
-
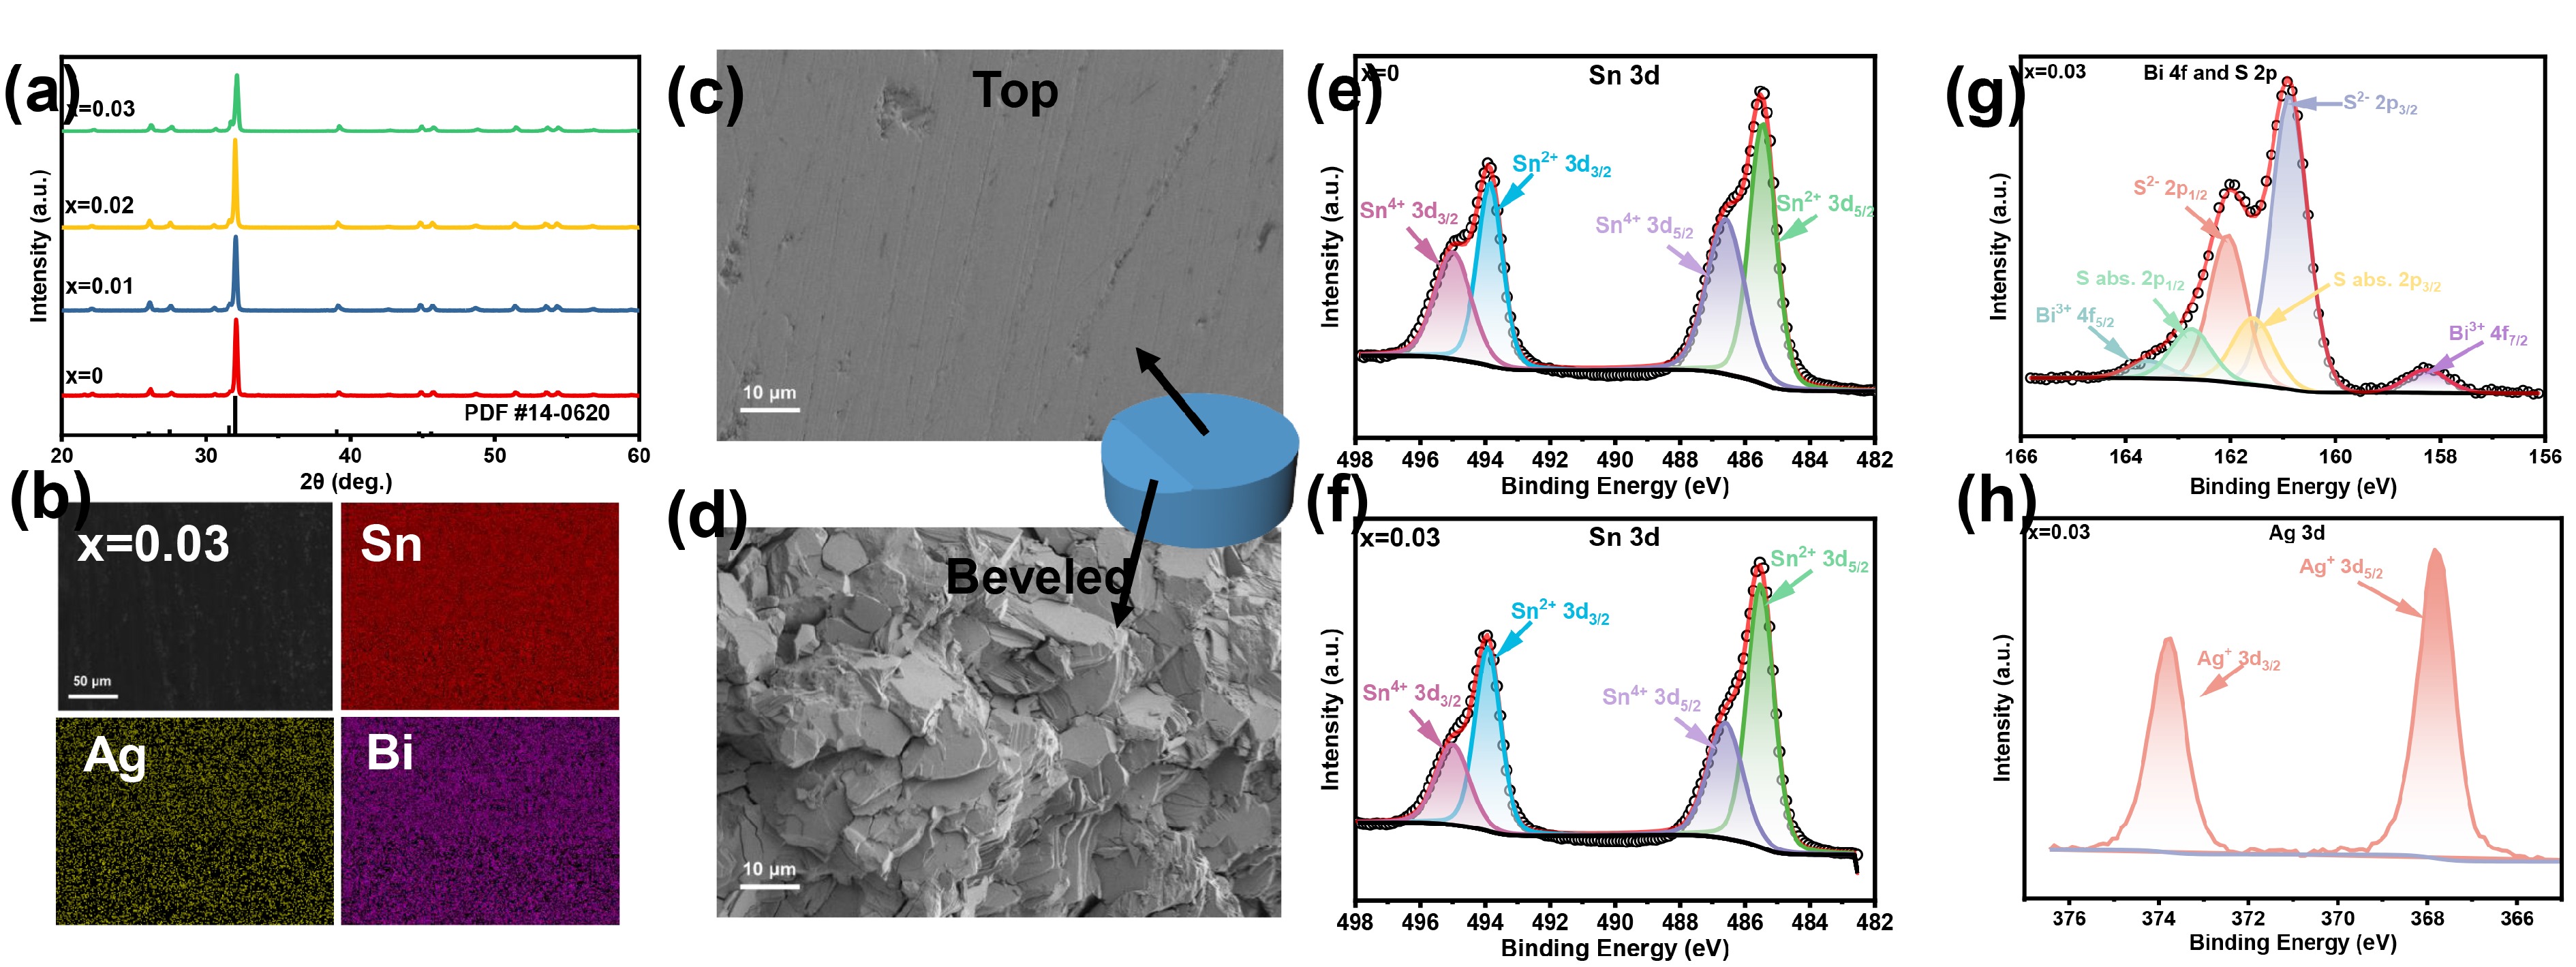
![]() (a) XRD patterns of Sn1-2xAgxBixS (x = 0, 0.01, 0.02, 0.03). (b) SEM‒EDS mapping of Sn0.94Ag0.03Bi0.03S, showing even dispersion. (c, d) SEM images of Sn0.94Ag0.03Bi0.03S pellets from top view and beveled view, respectively. XPS spectra of SnS and Sn0.94Ag0.03Bi0.03S: (e, f) 3d orbitals of Sn element; (g) 2p orbitals of S element and 4f orbitals of Bi; (h) 3d orbitals of Ag element.
(a) XRD patterns of Sn1-2xAgxBixS (x = 0, 0.01, 0.02, 0.03). (b) SEM‒EDS mapping of Sn0.94Ag0.03Bi0.03S, showing even dispersion. (c, d) SEM images of Sn0.94Ag0.03Bi0.03S pellets from top view and beveled view, respectively. XPS spectra of SnS and Sn0.94Ag0.03Bi0.03S: (e, f) 3d orbitals of Sn element; (g) 2p orbitals of S element and 4f orbitals of Bi; (h) 3d orbitals of Ag element.
-
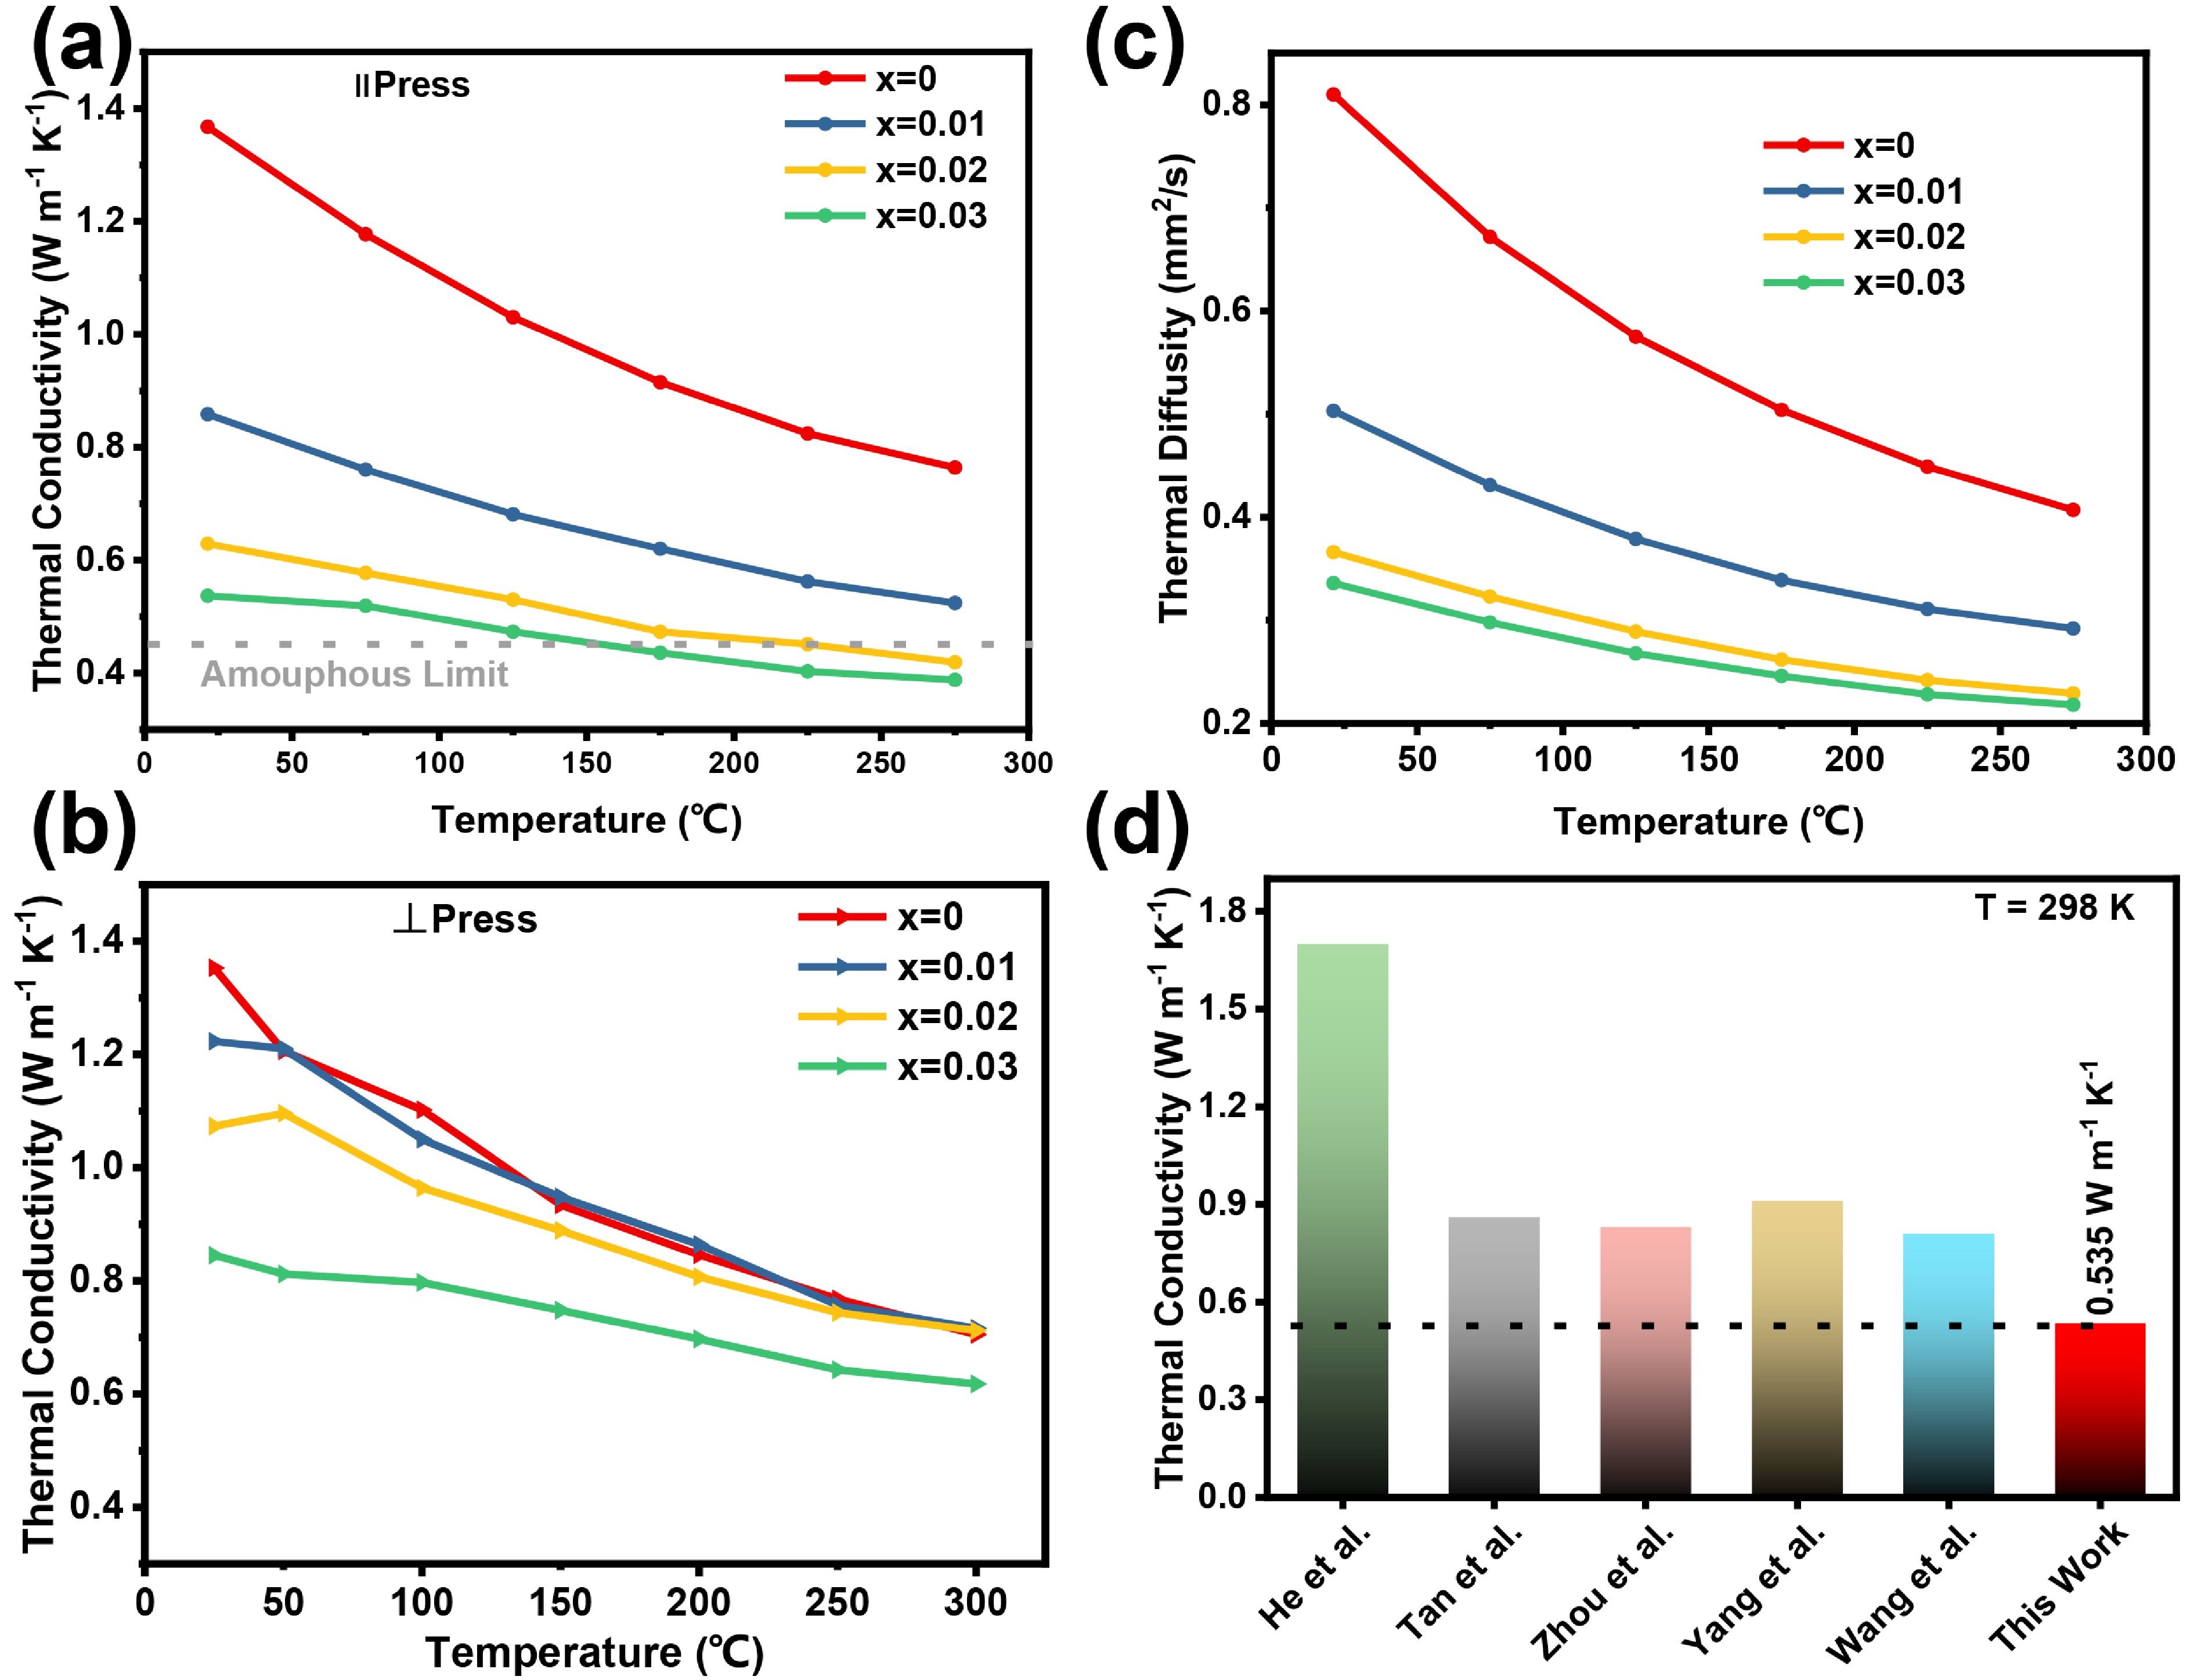
![]() Thermal transport properties of Sn1-2xAgxBixS (x = 0, 0.01, 0.02, 0.03). (a) Thermal conductivity parallel to the press. (b) Thermal conductivity vertical to the press. (c) Thermal diffusivity parallel to the press. (d) Comparison of ultralow thermal conductivity of SnS in previous researched and this work.
Thermal transport properties of Sn1-2xAgxBixS (x = 0, 0.01, 0.02, 0.03). (a) Thermal conductivity parallel to the press. (b) Thermal conductivity vertical to the press. (c) Thermal diffusivity parallel to the press. (d) Comparison of ultralow thermal conductivity of SnS in previous researched and this work.
-
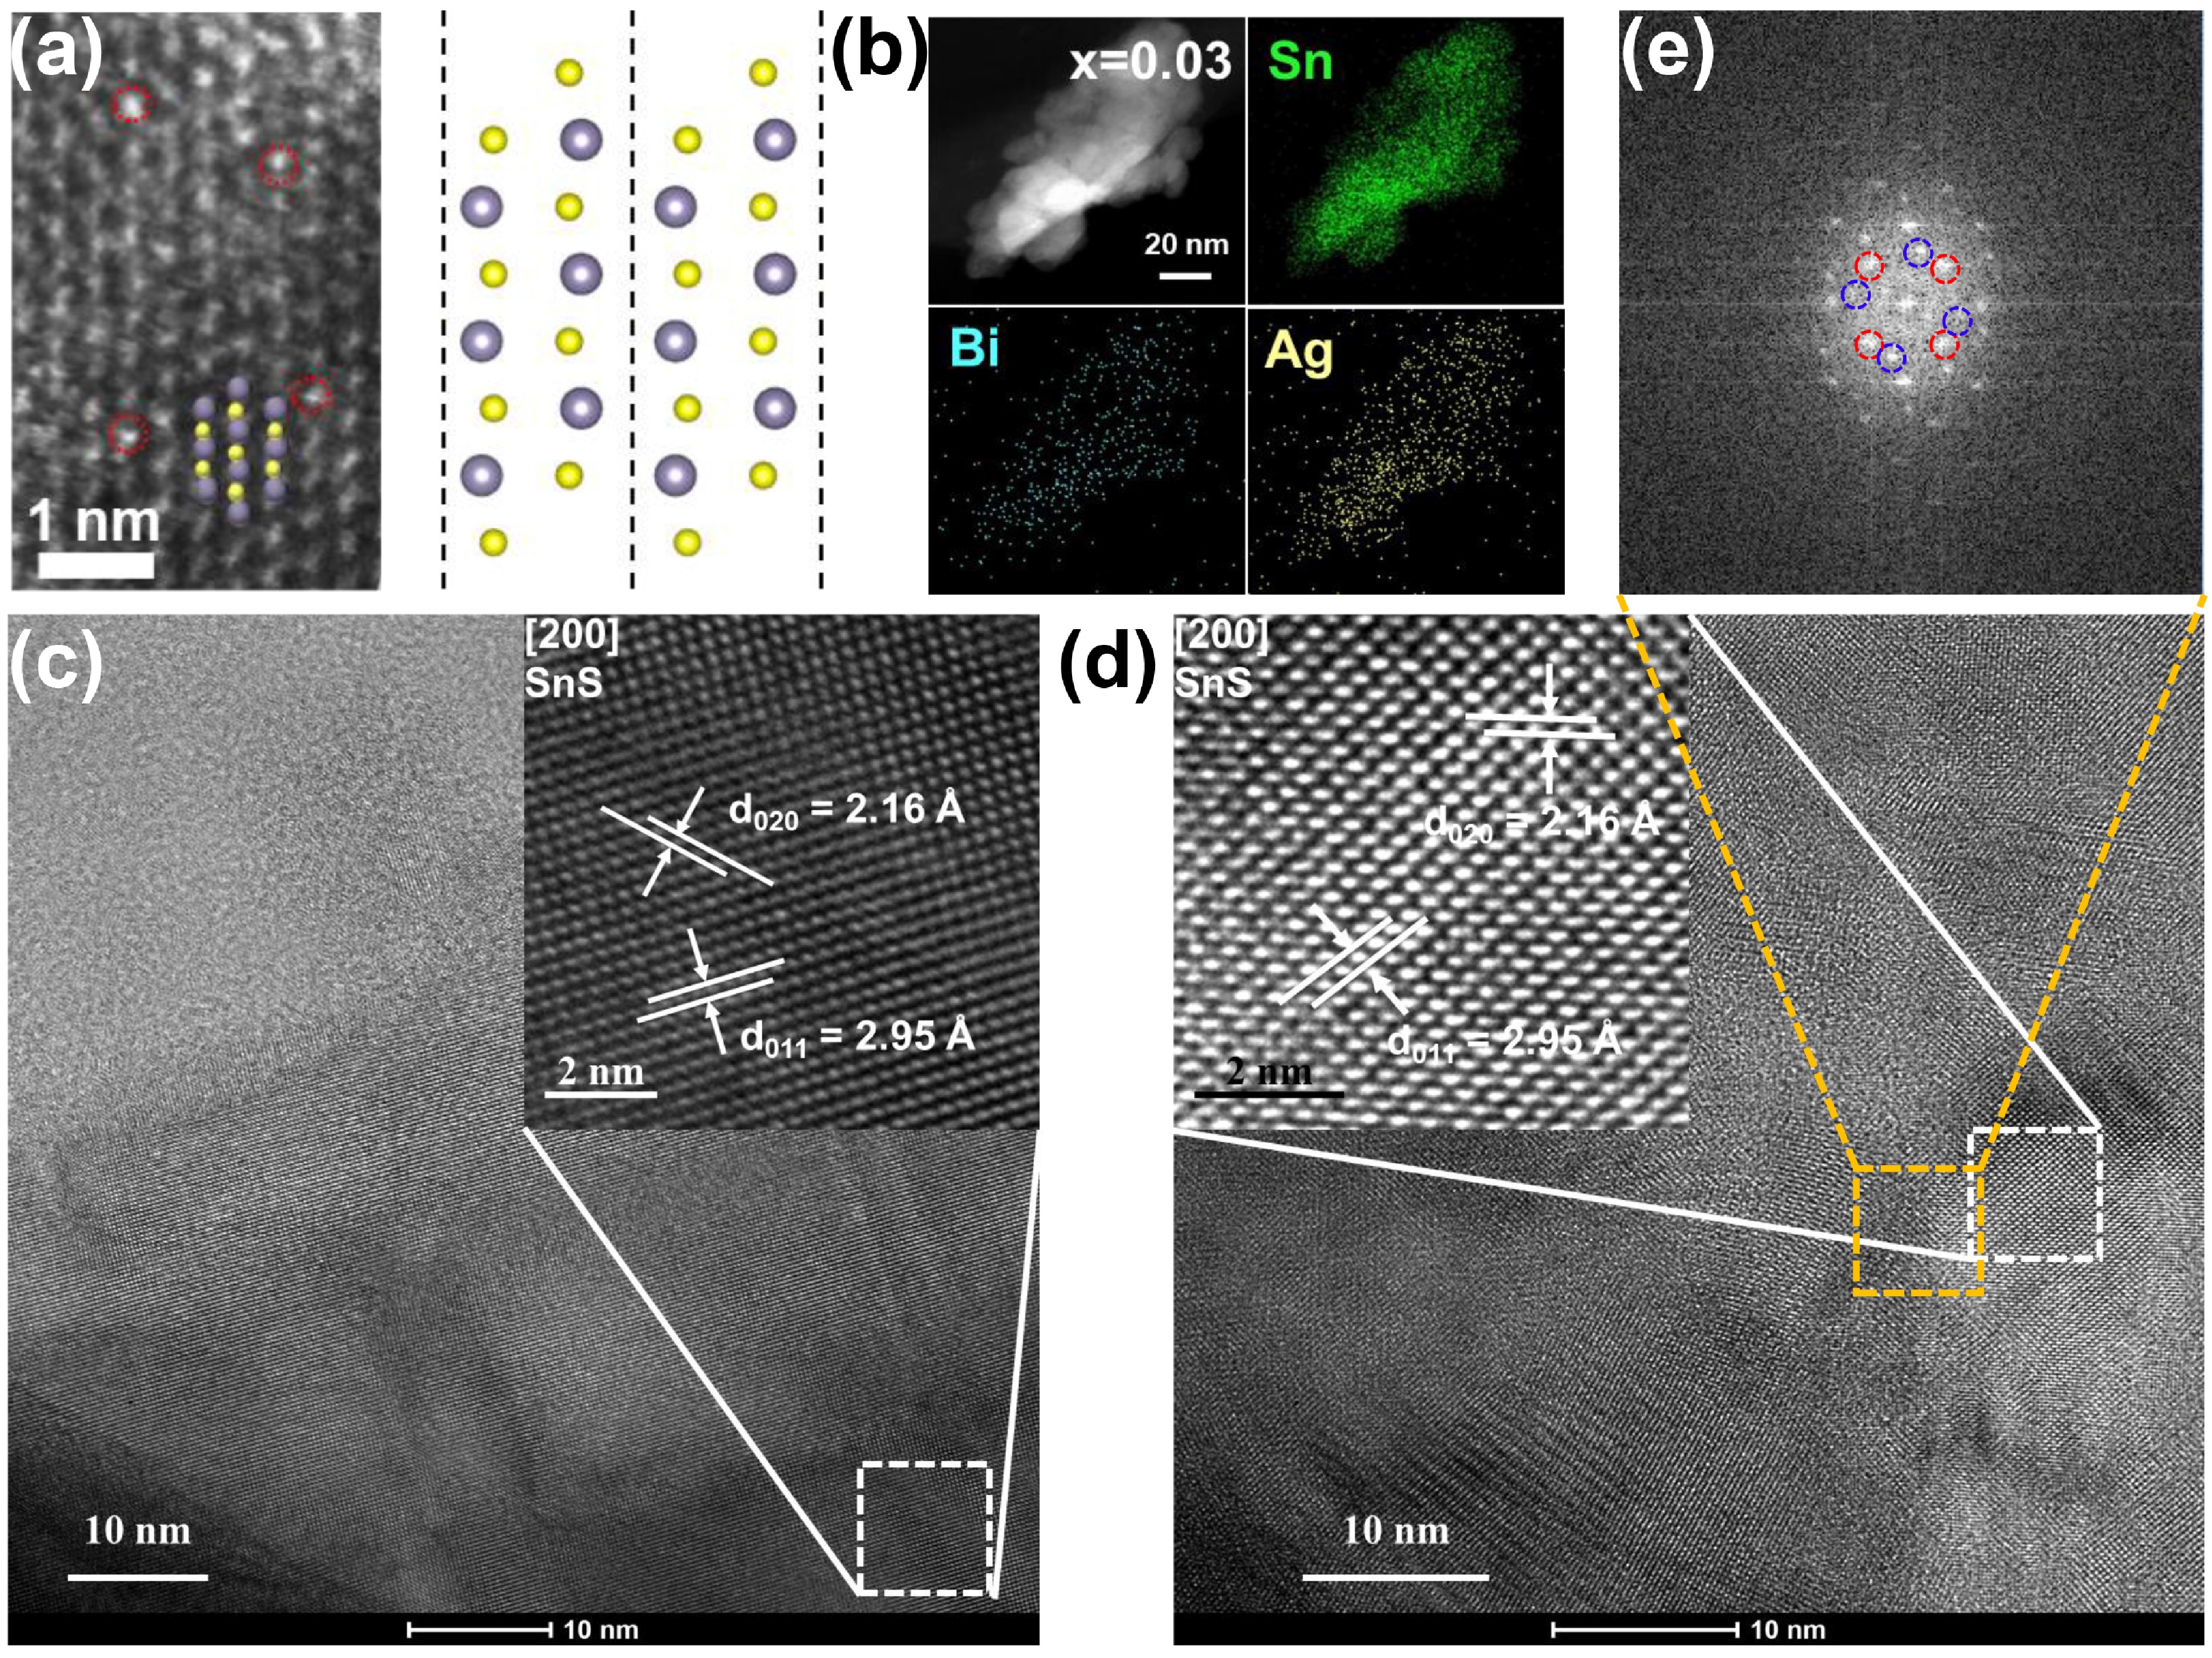
![]() (a) HAADF-STEM image of Sn0.94Ag0.03Bi0.03S along the (100) direction, where Sn and S atoms are depicted in gray and yellow; the red circles are highlighted Bi atoms. The right panel shows the crystal structure of SnS in the same projection. (b) HRTEM-EDS mapping of Sn0.94Ag0.03Bi0.03S. (c, d) HRTEM images of SnS and Sn0.94Ag0.03Bi0.03S, respectively. Insets are enlarged images of selected areas. (e) FFT image of the selected area in (d), showing distinct two sets of diffraction spots.
(a) HAADF-STEM image of Sn0.94Ag0.03Bi0.03S along the (100) direction, where Sn and S atoms are depicted in gray and yellow; the red circles are highlighted Bi atoms. The right panel shows the crystal structure of SnS in the same projection. (b) HRTEM-EDS mapping of Sn0.94Ag0.03Bi0.03S. (c, d) HRTEM images of SnS and Sn0.94Ag0.03Bi0.03S, respectively. Insets are enlarged images of selected areas. (e) FFT image of the selected area in (d), showing distinct two sets of diffraction spots.