Figures of the Article
-
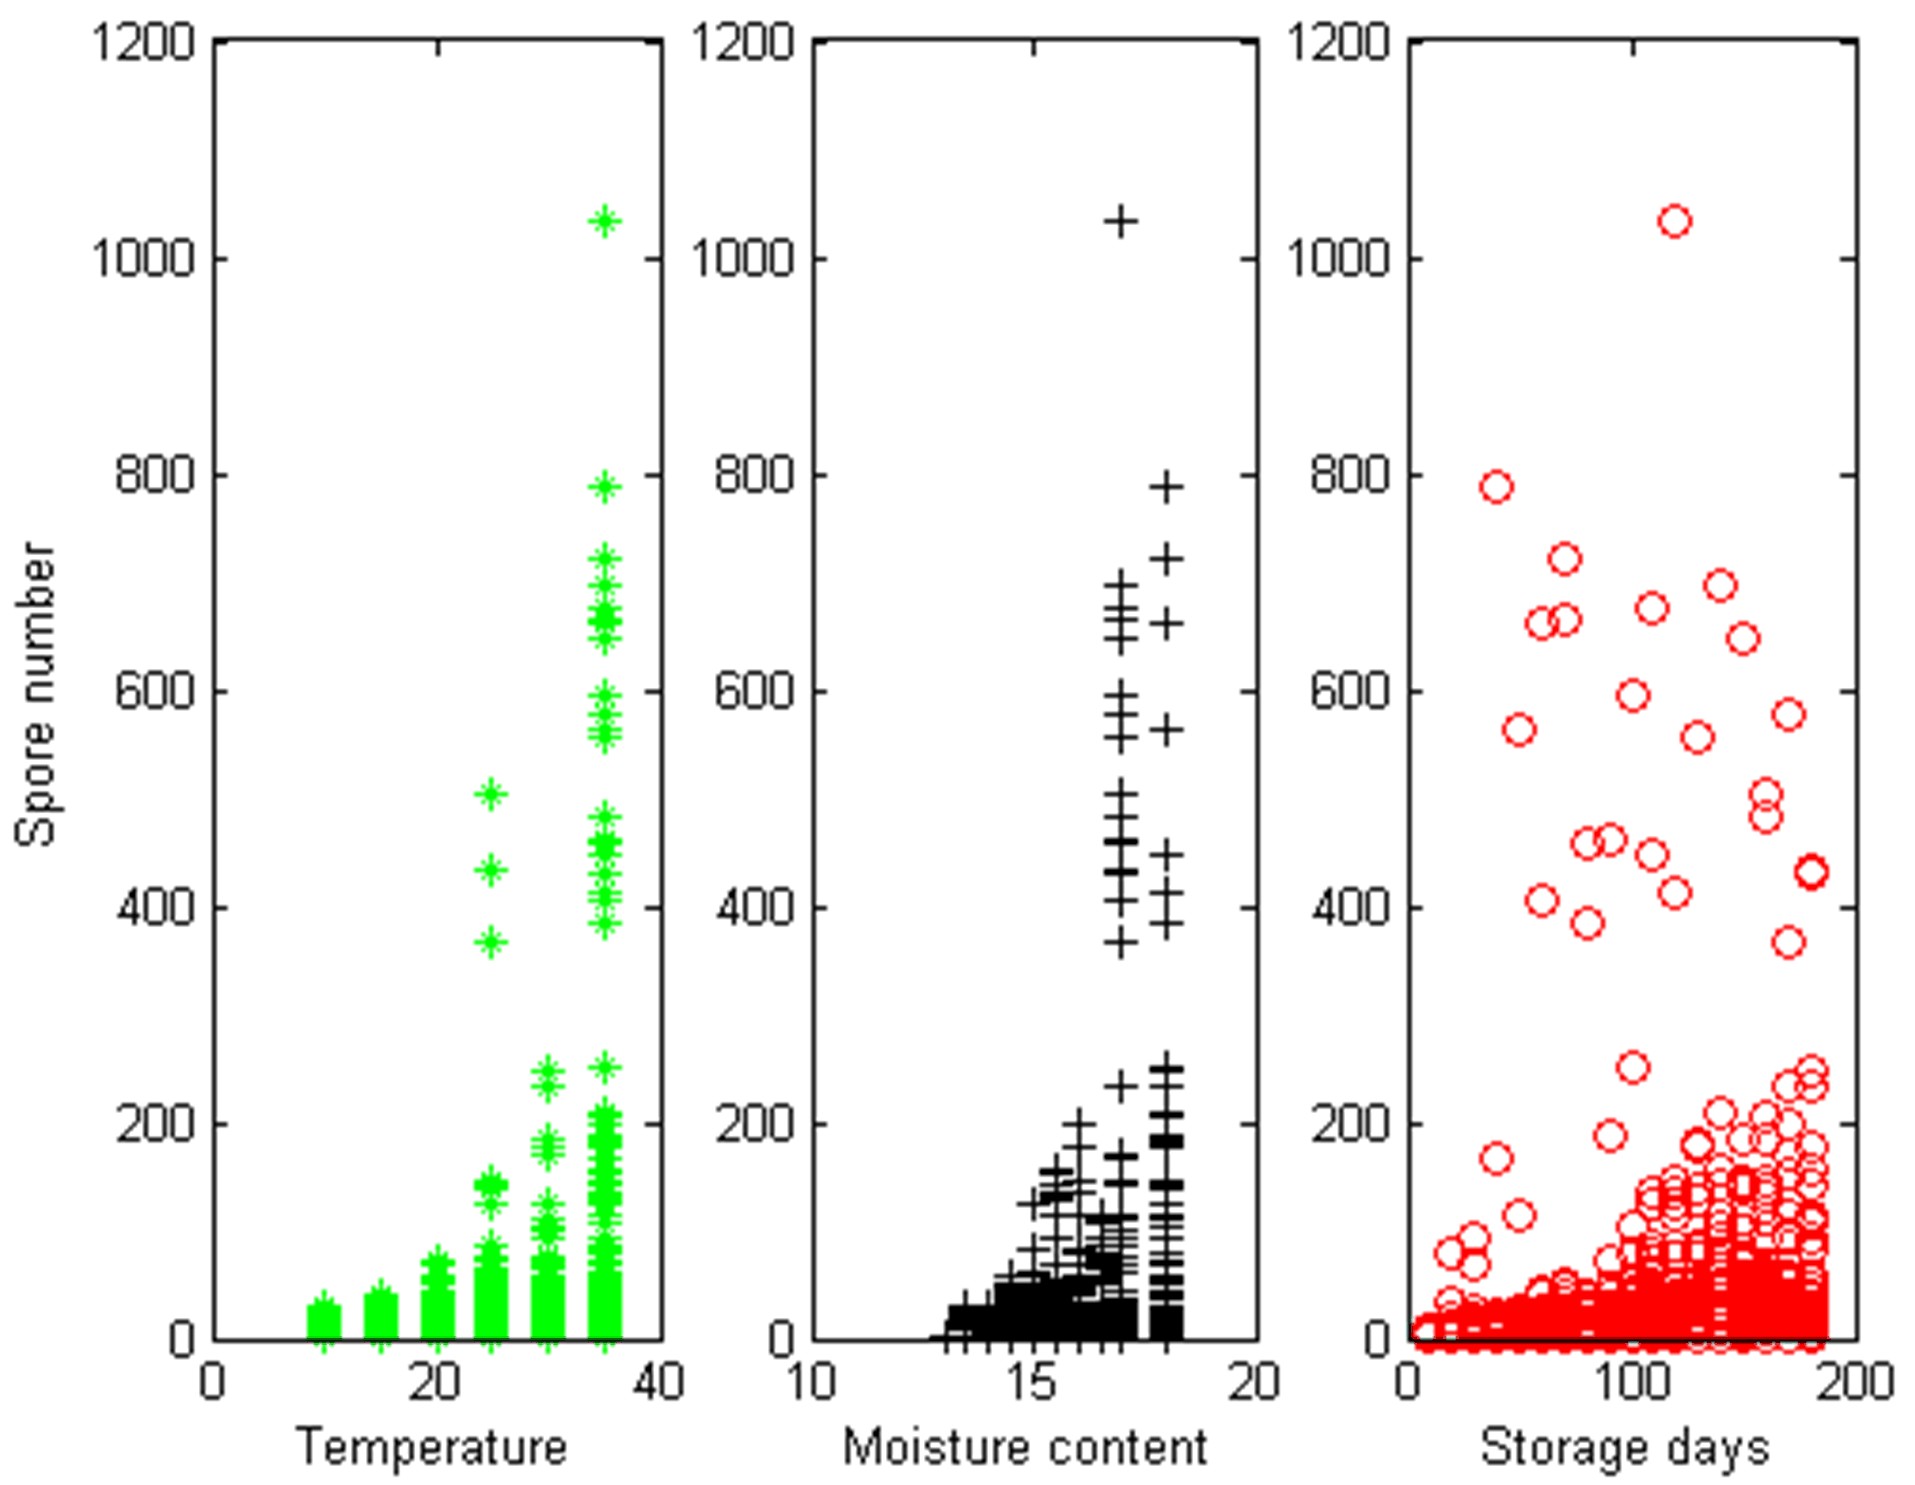
![]() Spore number along with ambient temperature, rice moisture content and storage days.
Spore number along with ambient temperature, rice moisture content and storage days.
-
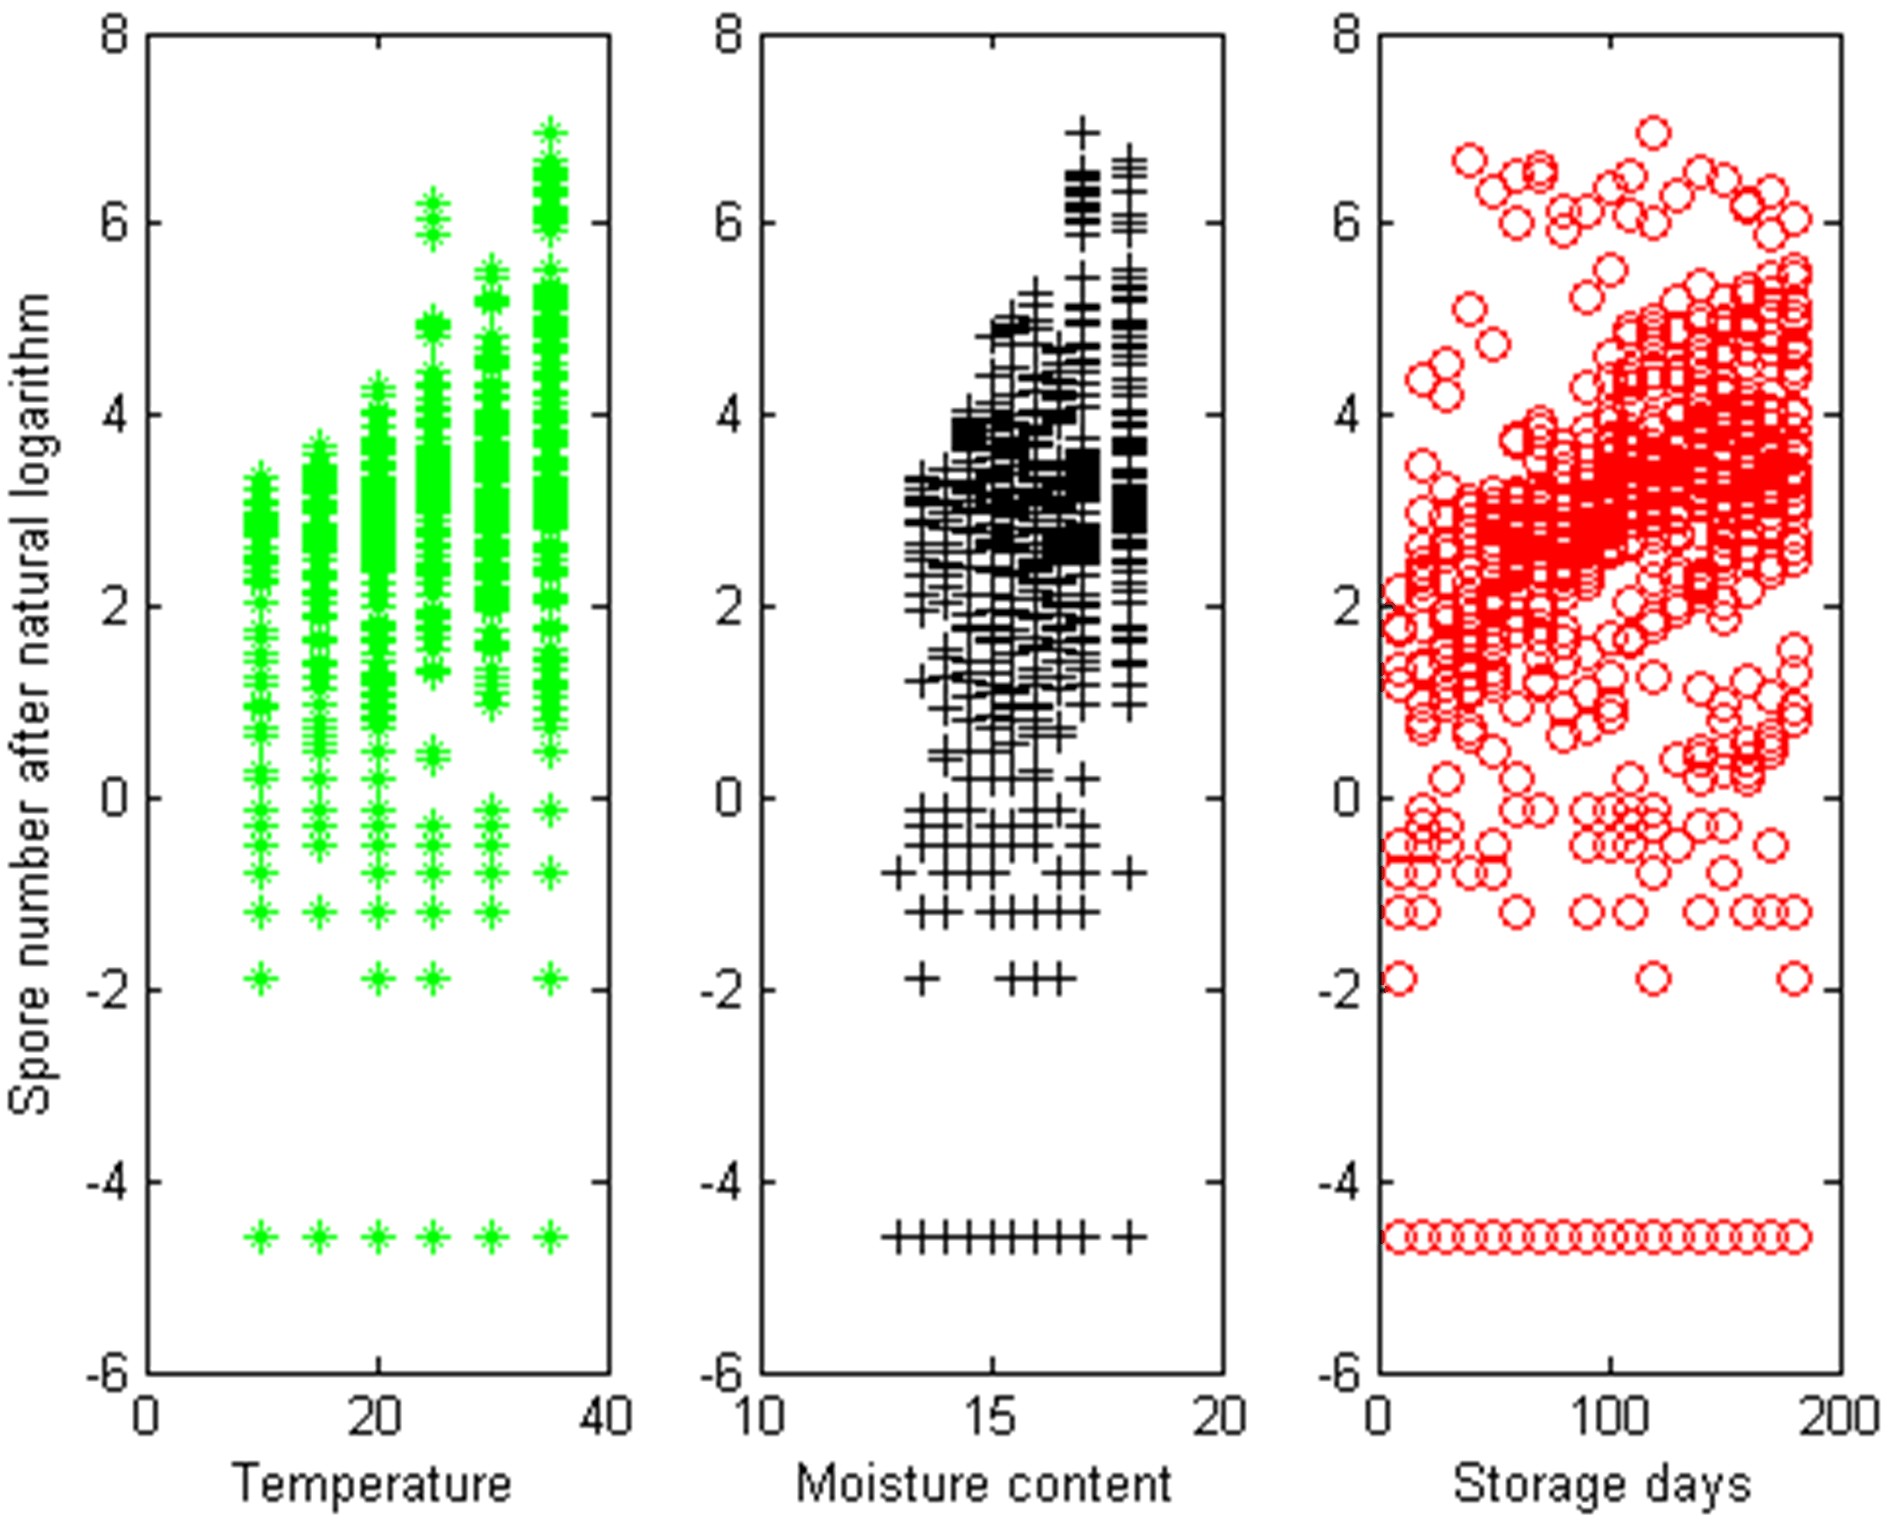
![]() Scatter plot after taking a natural logarithm of the spore number.
Scatter plot after taking a natural logarithm of the spore number.
-
![]() Residual case order plot.
Residual case order plot.
-
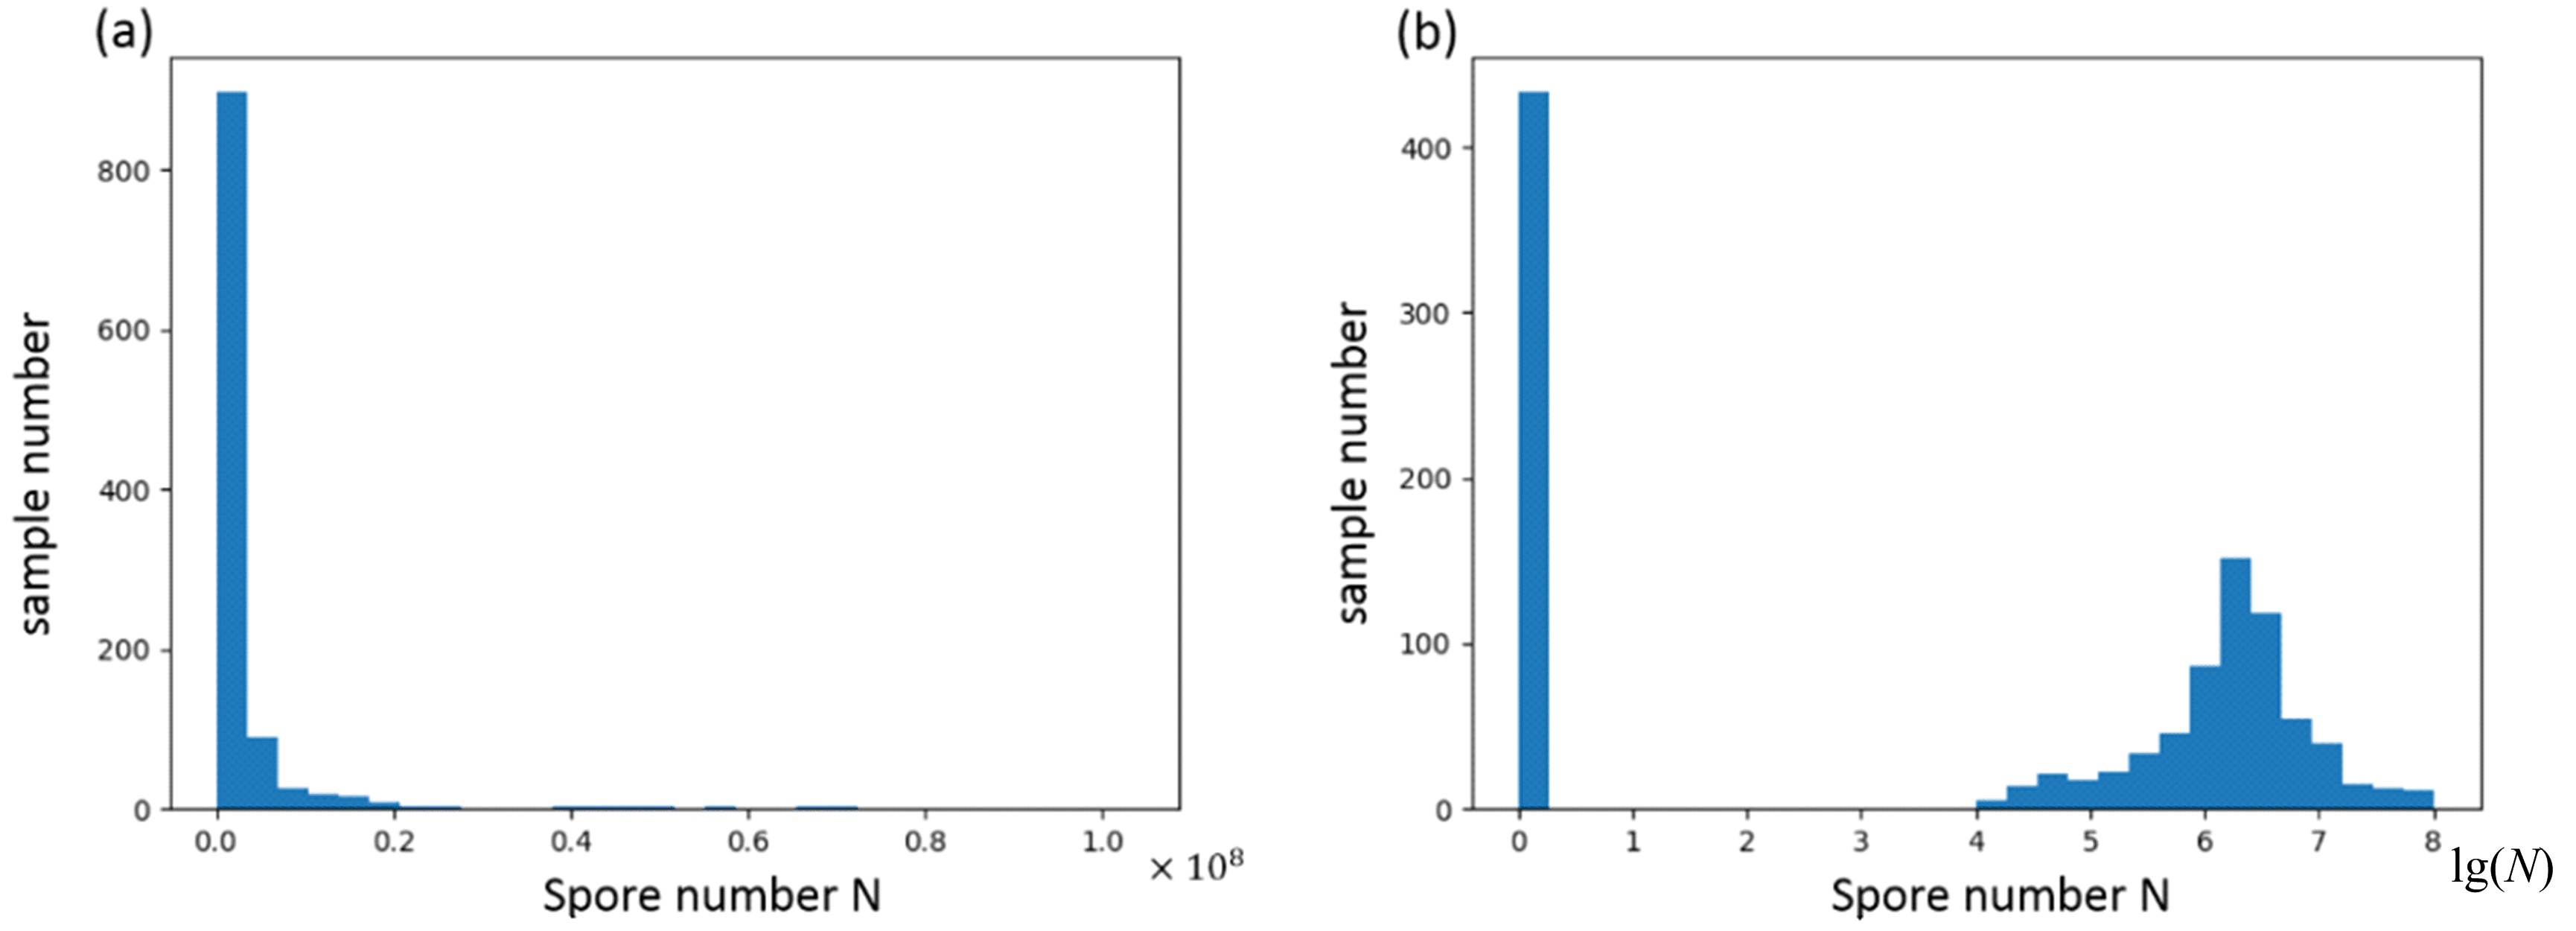
![]() The distribution of spore number.
The distribution of spore number.
-
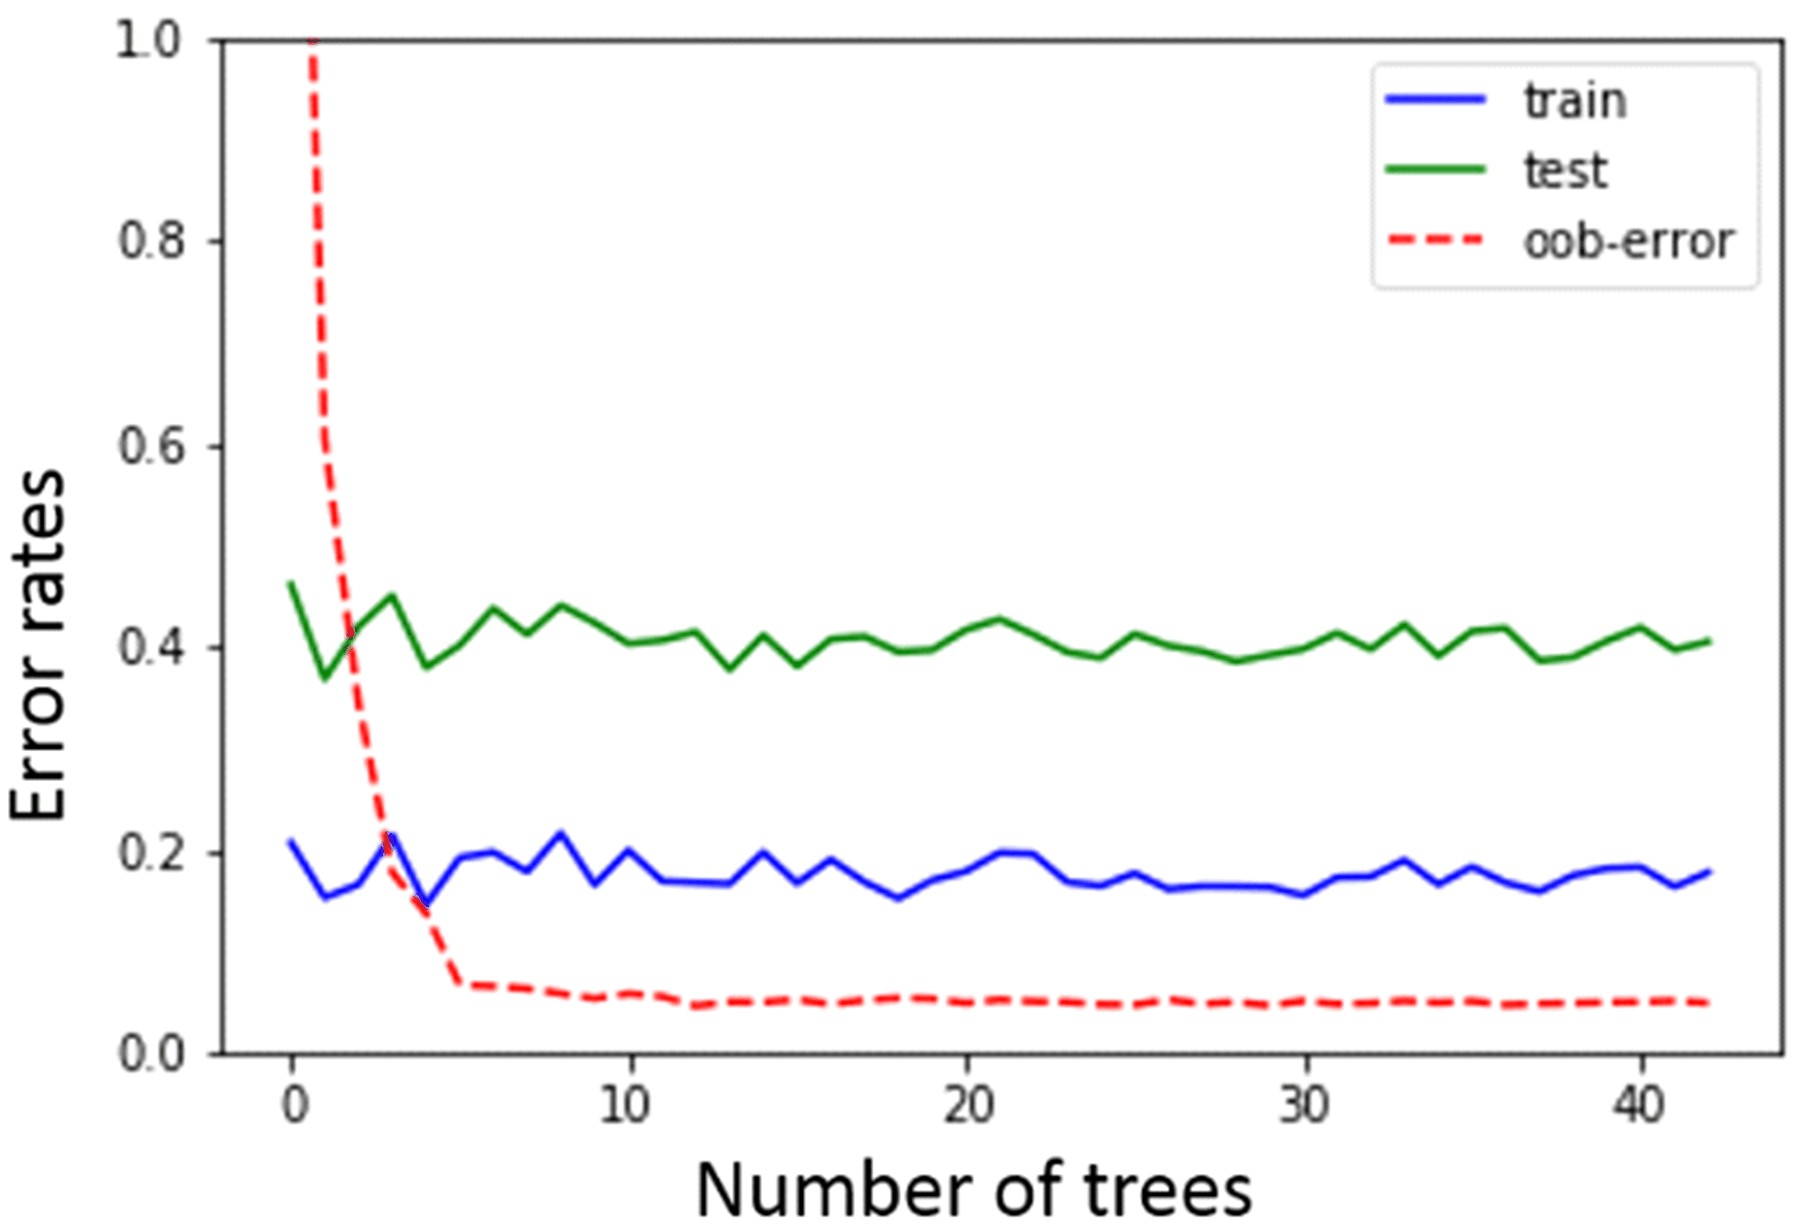
![]() Comparison of training, out-of-bag, and independent test set error rates for random forest as the number of trees increases.
Comparison of training, out-of-bag, and independent test set error rates for random forest as the number of trees increases.
-
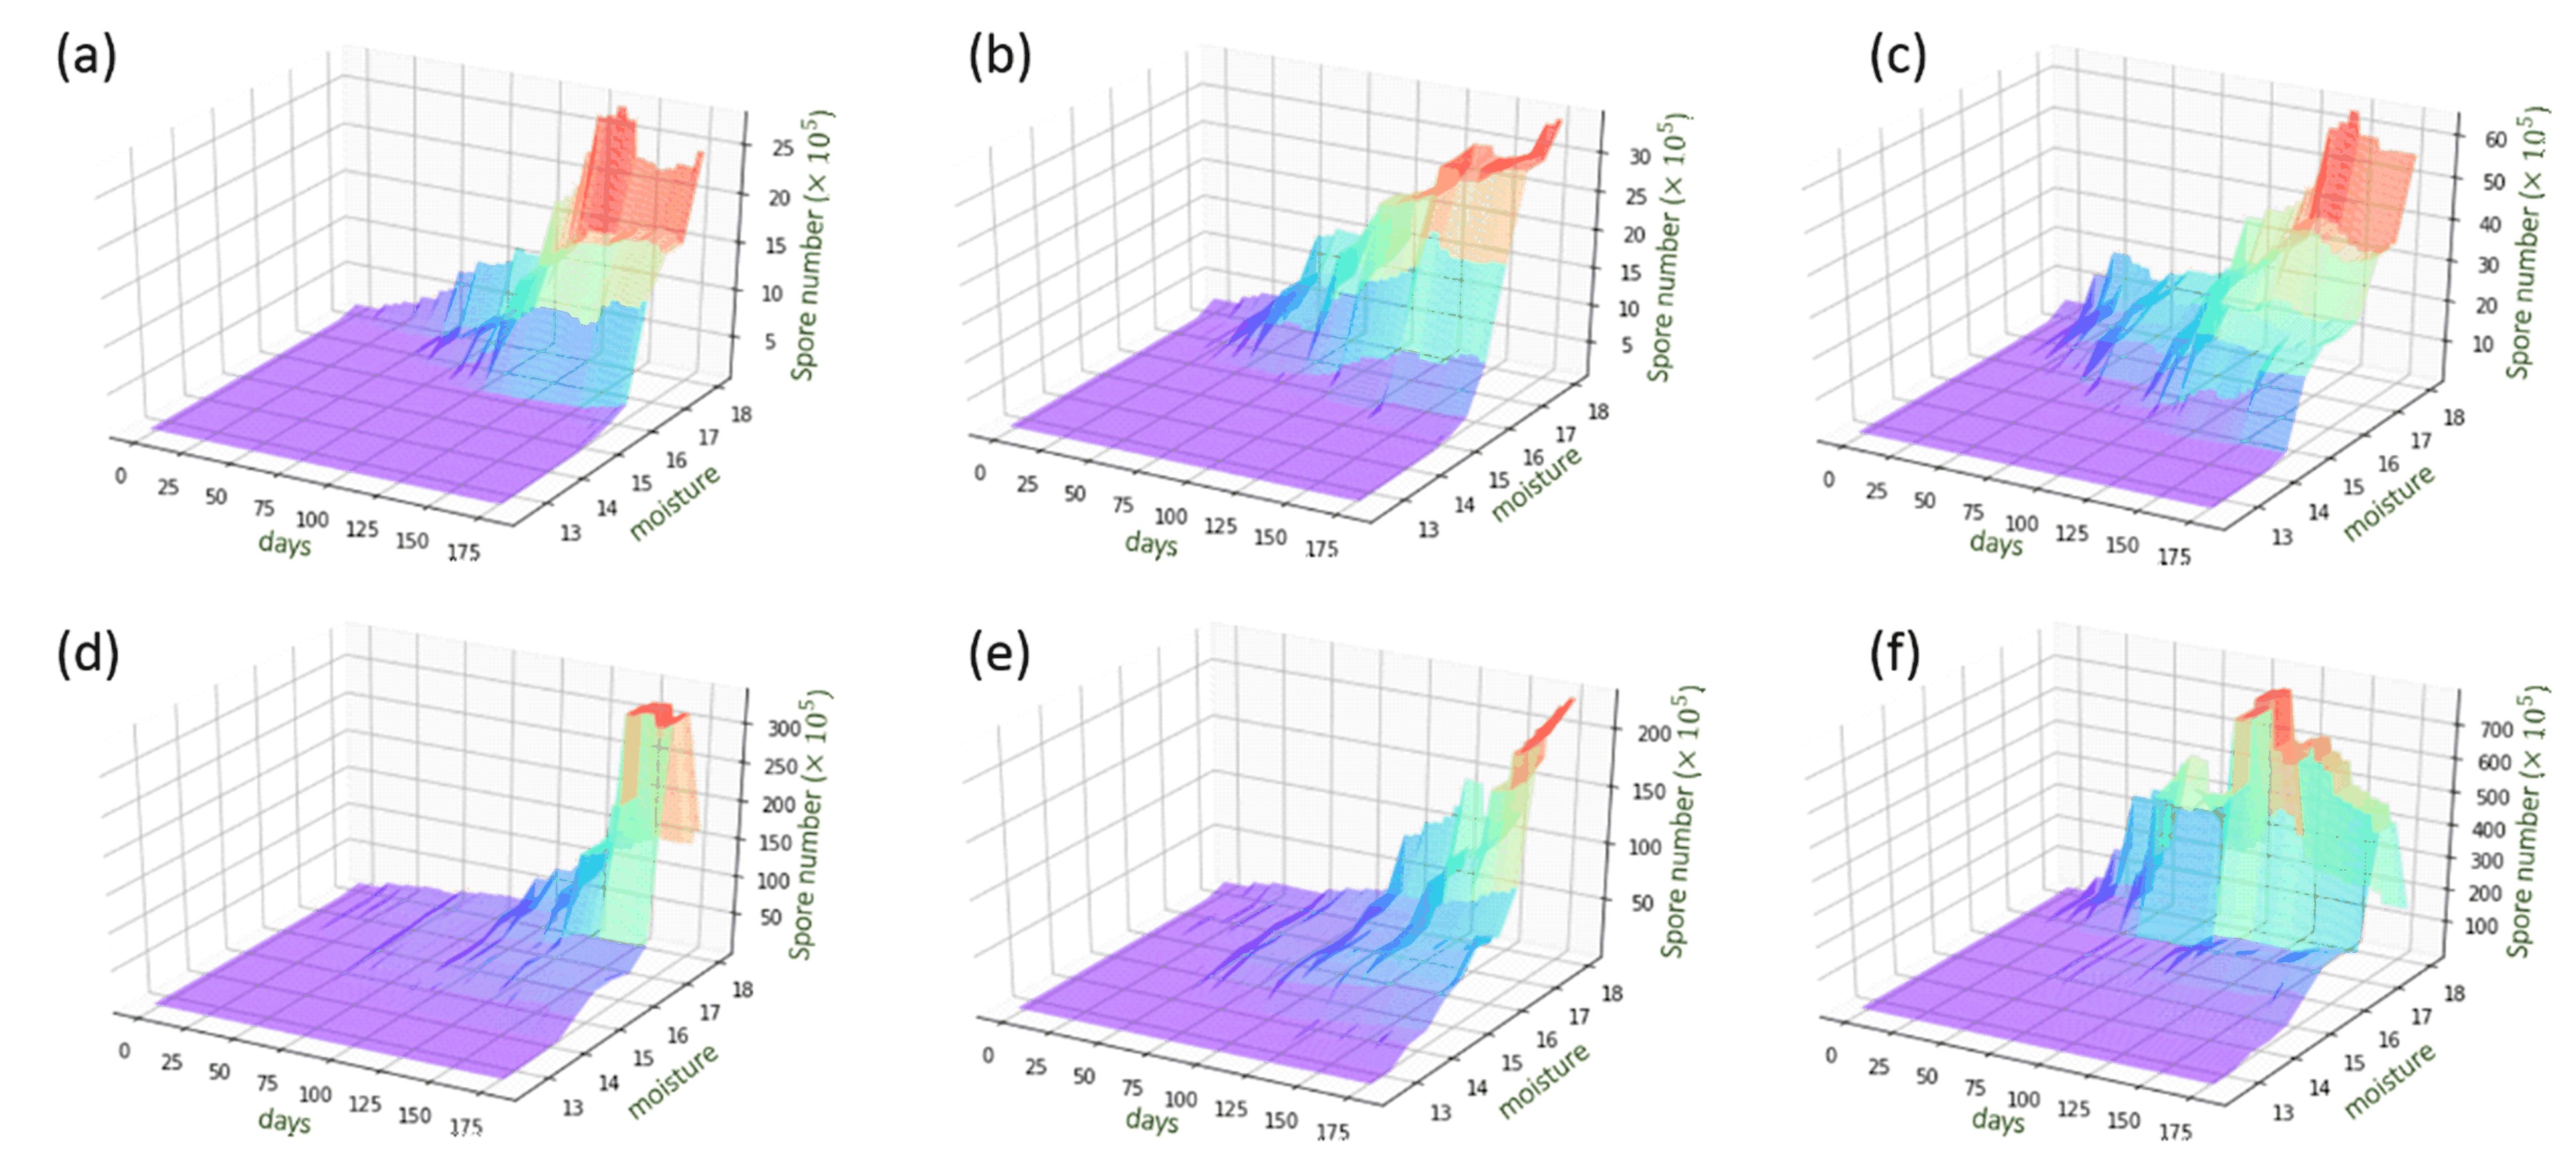
![]() Prediction surface graph in different temperature of 10 ℃ (a), 15 ℃ (b), 20 ℃ (c), 25 ℃ (d), 30 ℃ (e), 35 ℃(f).
Prediction surface graph in different temperature of 10 ℃ (a), 15 ℃ (b), 20 ℃ (c), 25 ℃ (d), 30 ℃ (e), 35 ℃(f).
-
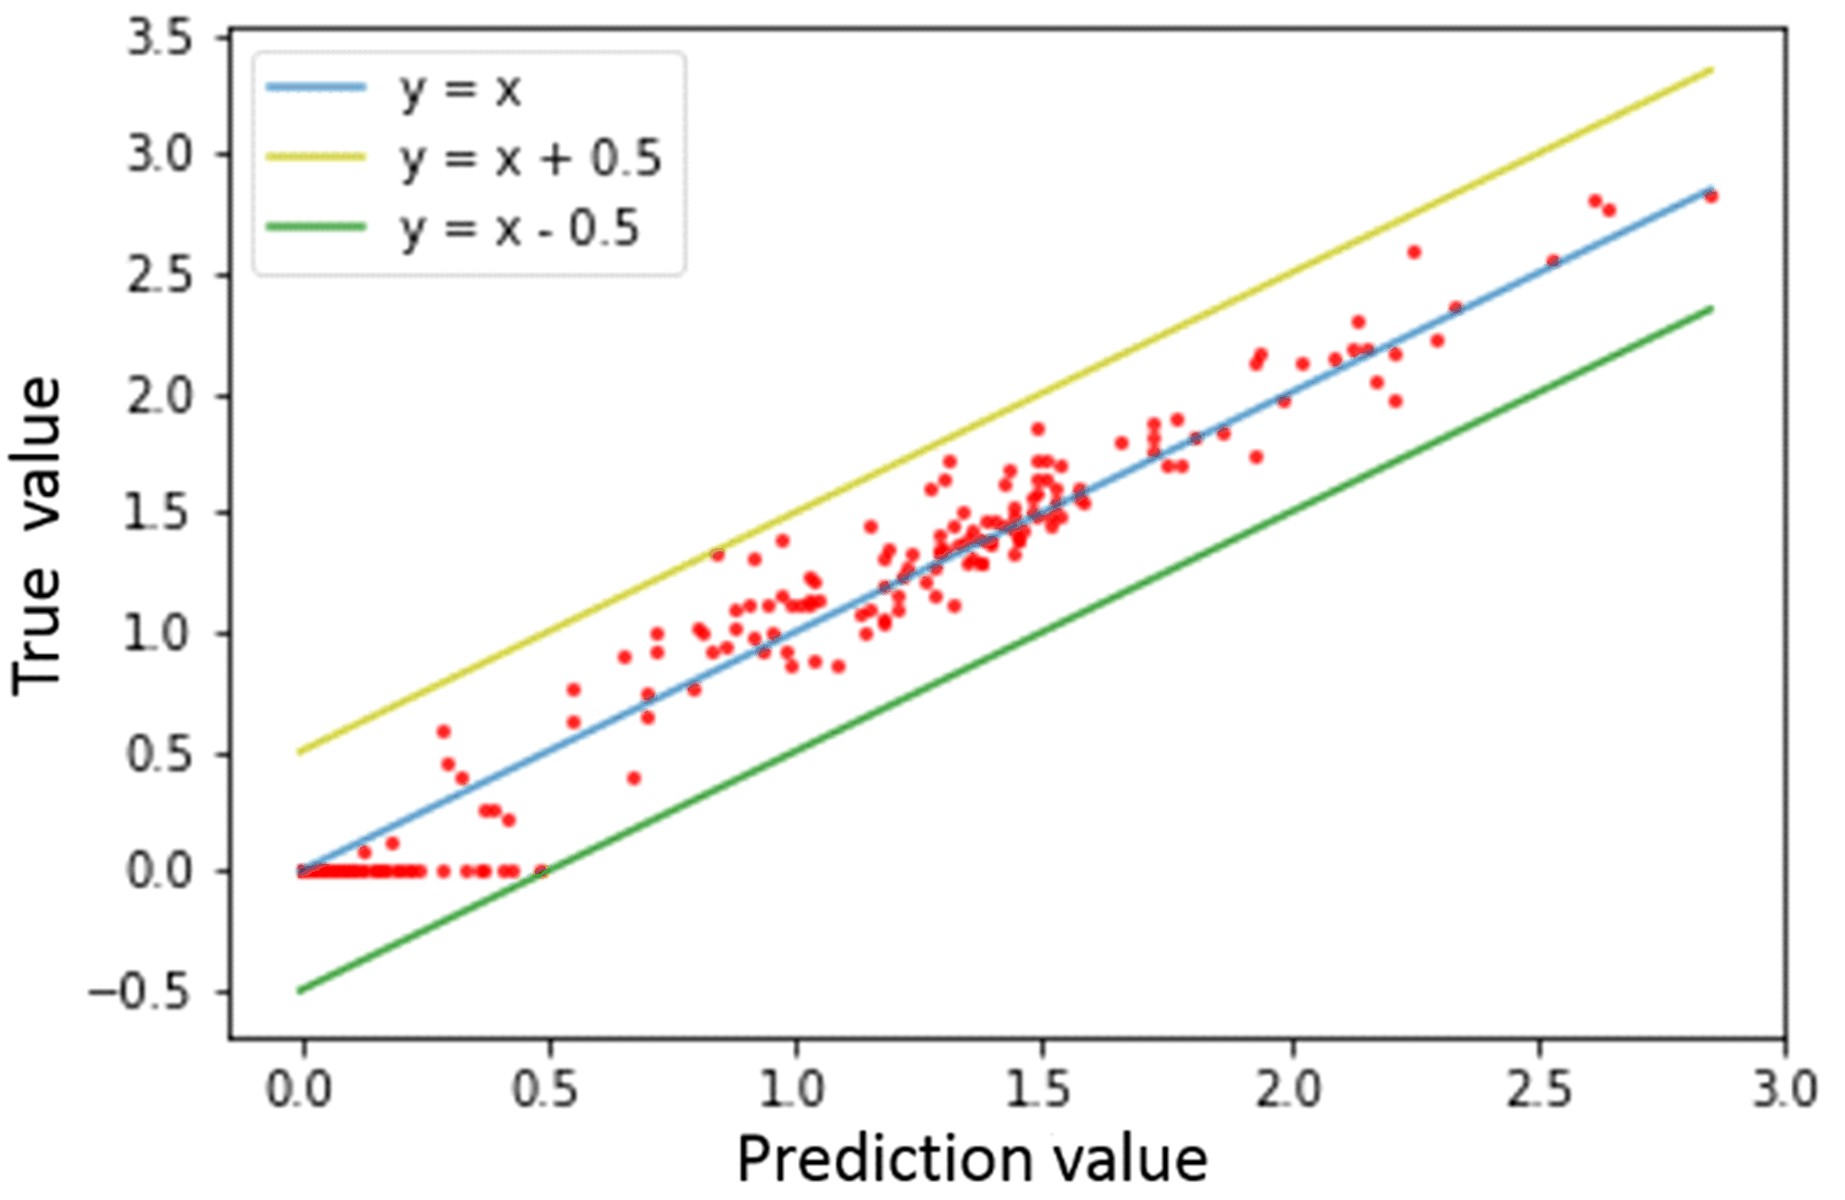
![]() The Scatter plot of prediction value and true value.
The Scatter plot of prediction value and true value.


 Download:
