
 Download:
Figures of the Article
-
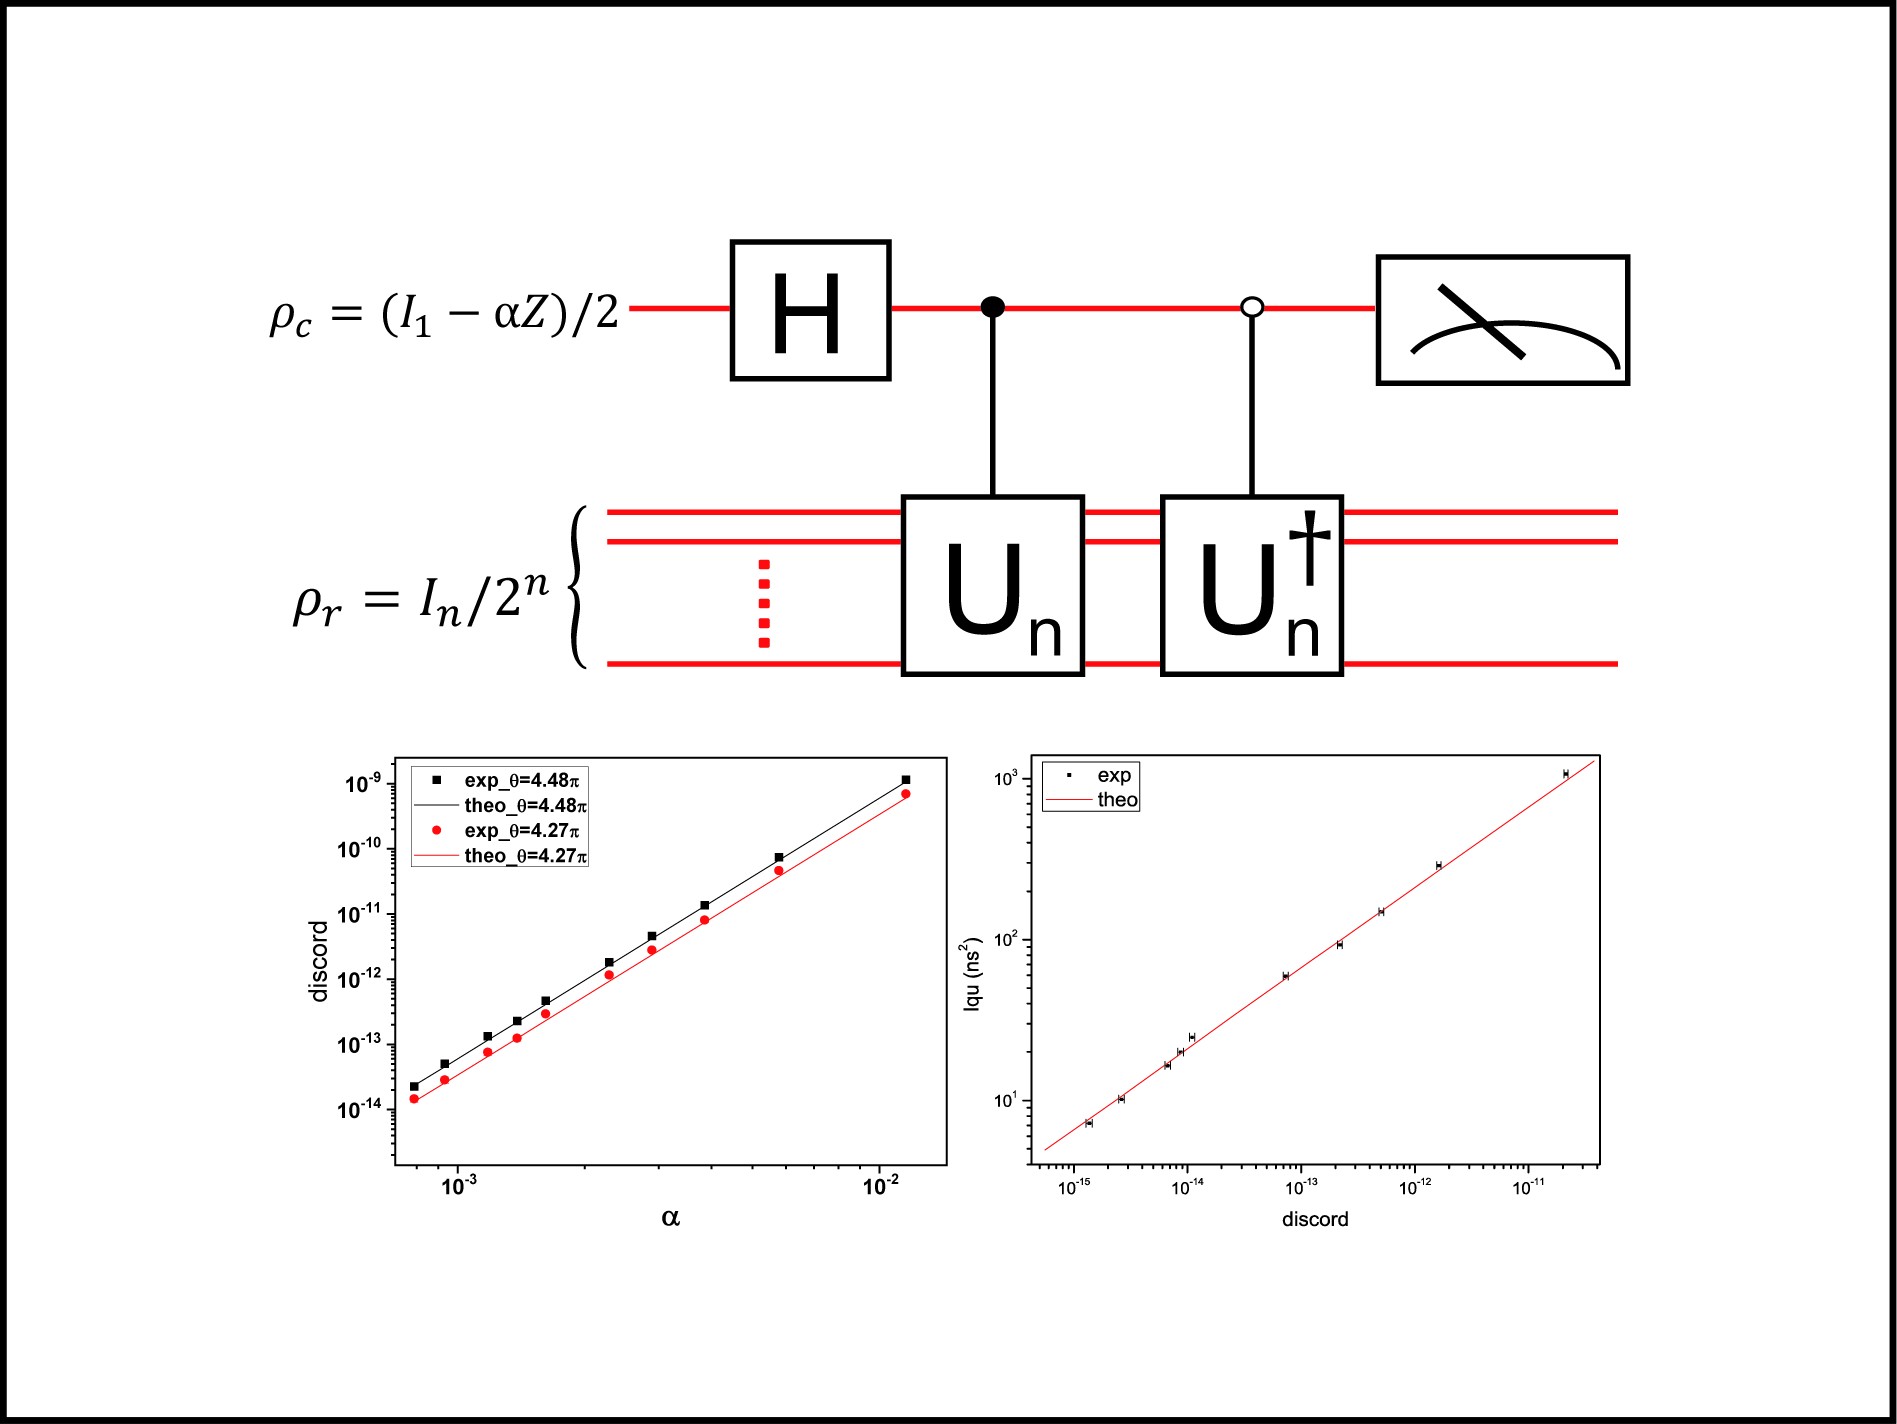
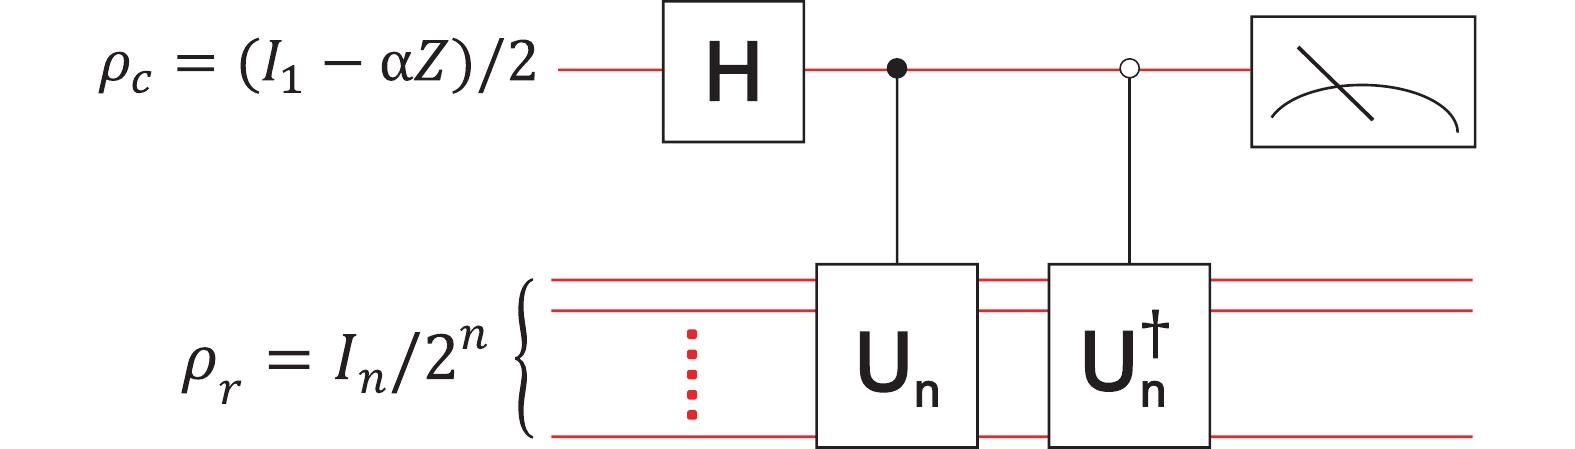
![]() DQC1 algorithm to estimate the normalized trace of
DQC1 algorithm to estimate the normalized trace of Un2 .In is the n-qubit identity,α reflects the degree of purity of control qubitc , andZ denotes the Pauli operatorZ . The normalized traceTr(Un2)/2n can be derived from the expectation values of the output of qubitc measured on the PauliX andY bases. -
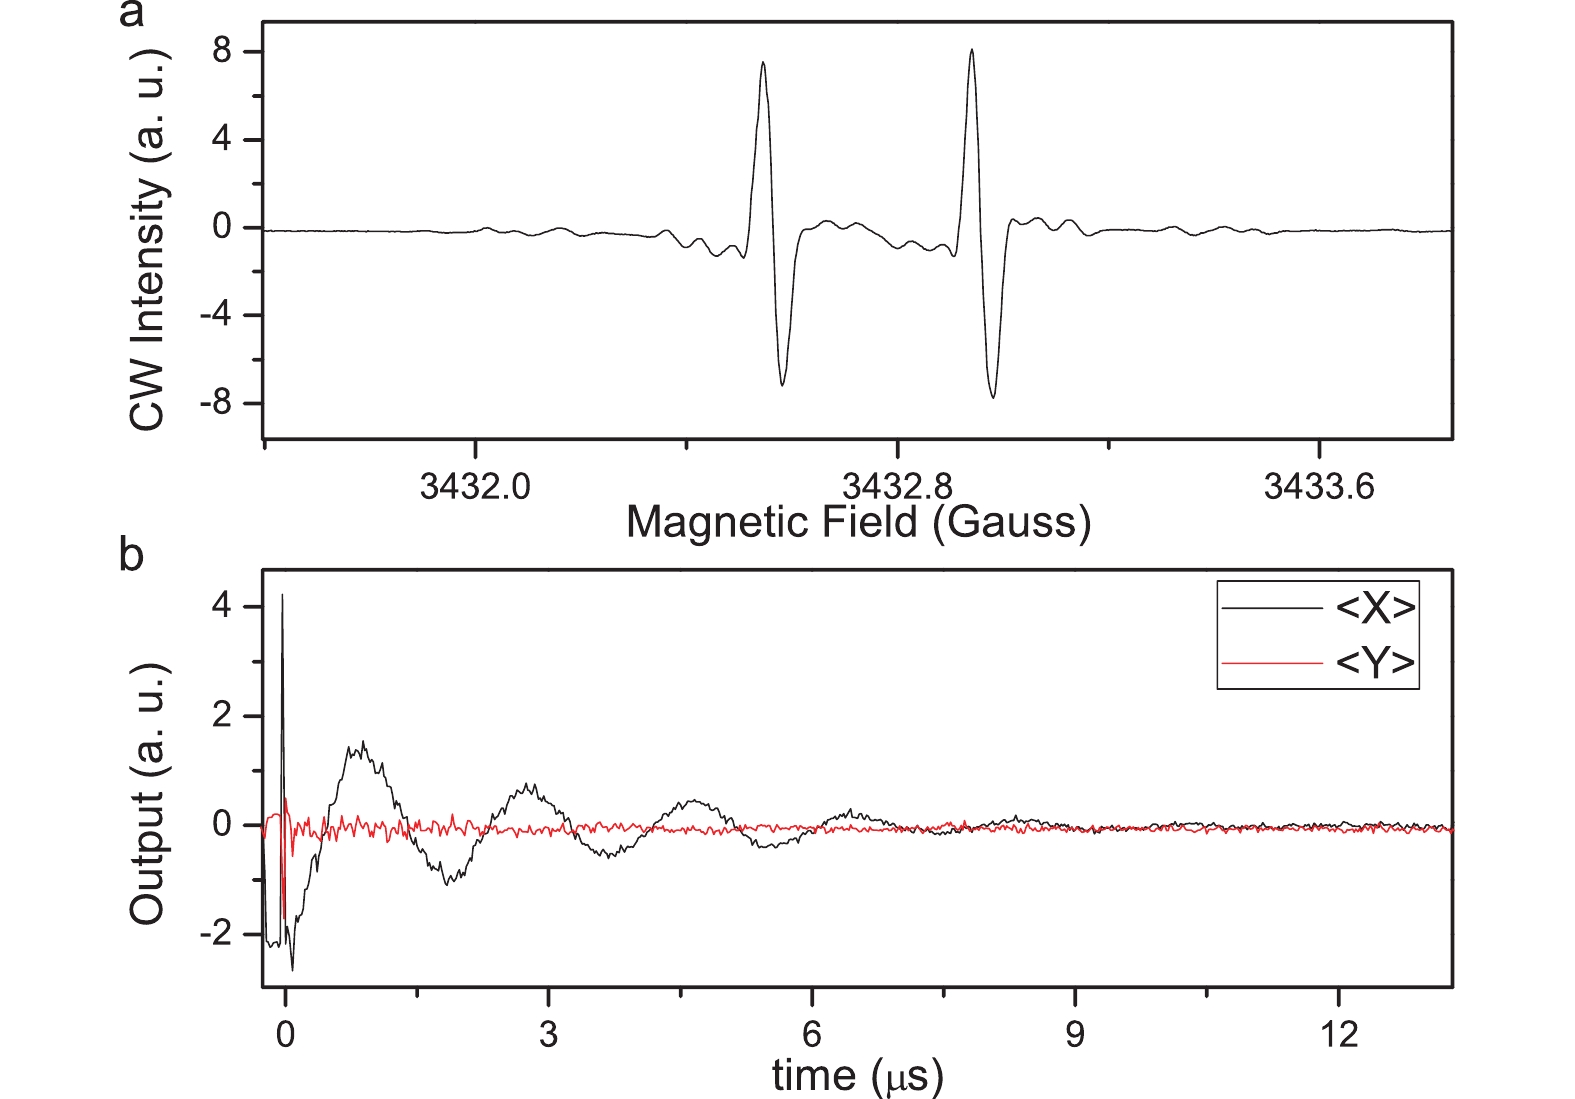
![]() (a) Continuous wave (
(a) Continuous wave (CW ) ESR spectrum of theE′2 center inα -quartz recorded at room temperature with the optical axis of the quartz oriented along the magnetic field. The split of the two peaks indicates the hyperfine coupling of the electron and nuclear spins. (b) Output of algorithm as evolution time varies for temperatureT=80K . TemperatureT and evolution timet representα andθ , respectively, as described in the text. The output value is not normalized. The area with timet<0 is related to the single-qubit gate on the control qubit. The output neart=0 is affected by the protection pulse, and thus it differs from the actual value of the output. The decay of the output originates from the interaction with the environment during the evolution of the system, as described in the text. -
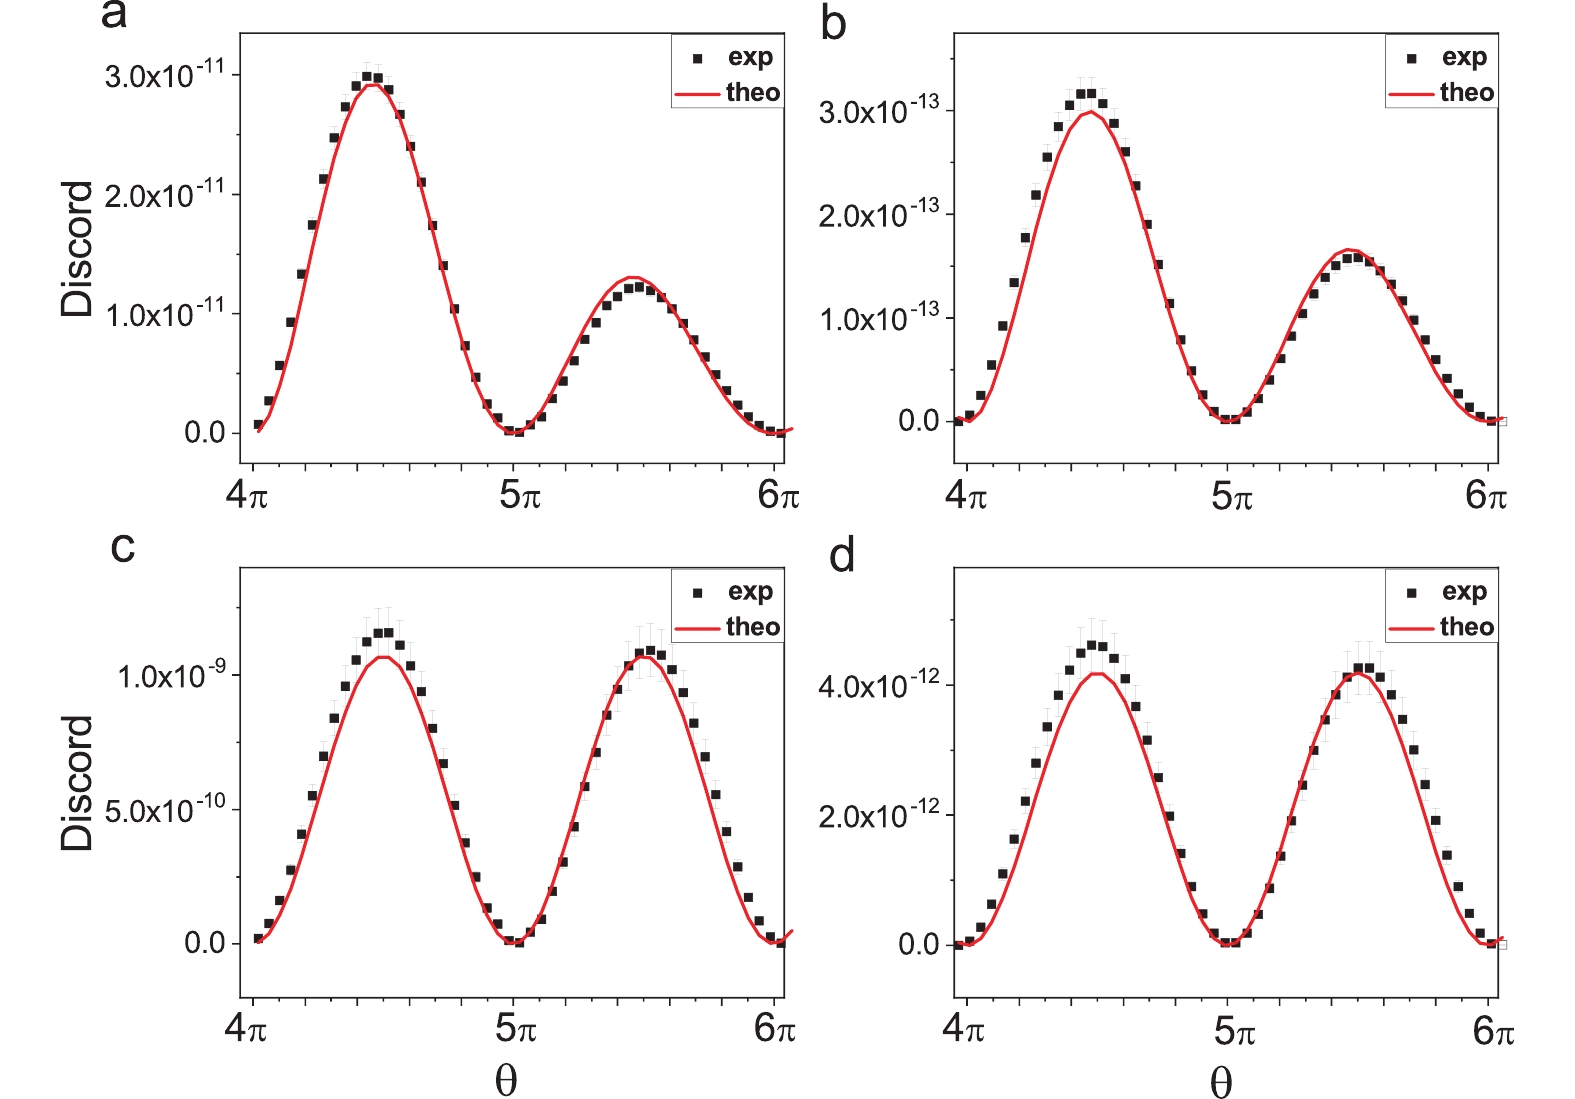
![]() Quantum discord generated for: (a)(c)
Quantum discord generated for: (a)(c) T=20K (α=1.16×10⁻² ), and (b)(d)T=80K (α=2.89×10⁻³ ). In (a) and (b), the experimental data (black square points) are practically detected, quantum discord is calculated with the original reconstructed density matrices of the output state, and the theoretical predictions (red curves) are calculated using Eq. (11) considering the interaction of the system with the environment. In (c) and (d), the experimental data (black square points) are calculated using the compensated density matrices, as described in the text, and the theoretical predictions (red curves) are calculated using Eq. (2) for perfect algorithm circuit operation. The error bars include only the estimated errors in numerically calculating quantum discord with density matrices. -
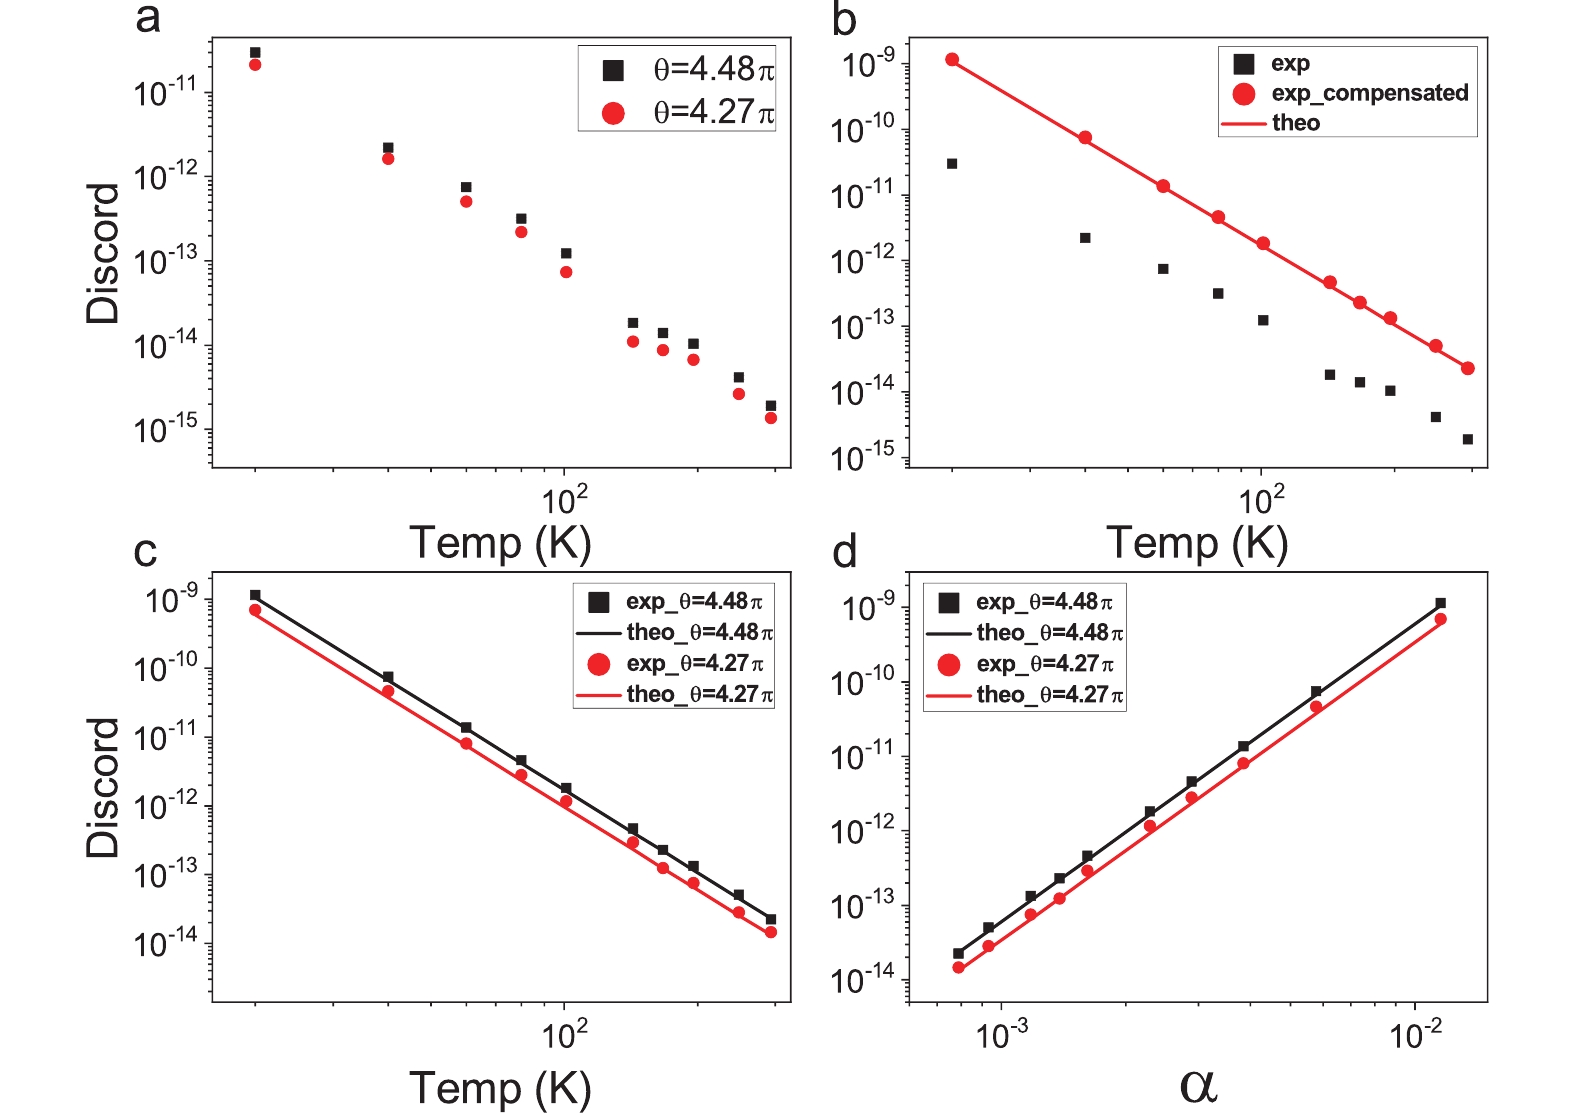
![]() (a) Experimentally detected quantum discord with varying temperature for
(a) Experimentally detected quantum discord with varying temperature for θ=4.48π (black squares) andθ=4.27π (red dots). Discord is calculated with the original reconstructed density matrices of the output state. (b) Comparison of quantum discord calculated using the original (black squares) and compensated (red dots) density matrices forθ=4.48π . The theoretical predictions (red curve) are calculated using Eq. (2) for perfect circuit operation. (c) Quantum discord calculated using compensated density matrices with varying temperature forθ=4.48π (black squares) andθ=4.27π (red dots). The theoretical predictions (black and red curves) are calculated using Eq. (2) for perfect circuit operation. (d) Same as (c), but for quantum discord with varyingα .α and the temperature is related one-to-one according to Eq. (6). Error bars only include the estimated errors for numerical calculation of the quantum discord with density matrices, and are covered by symbols of points. -
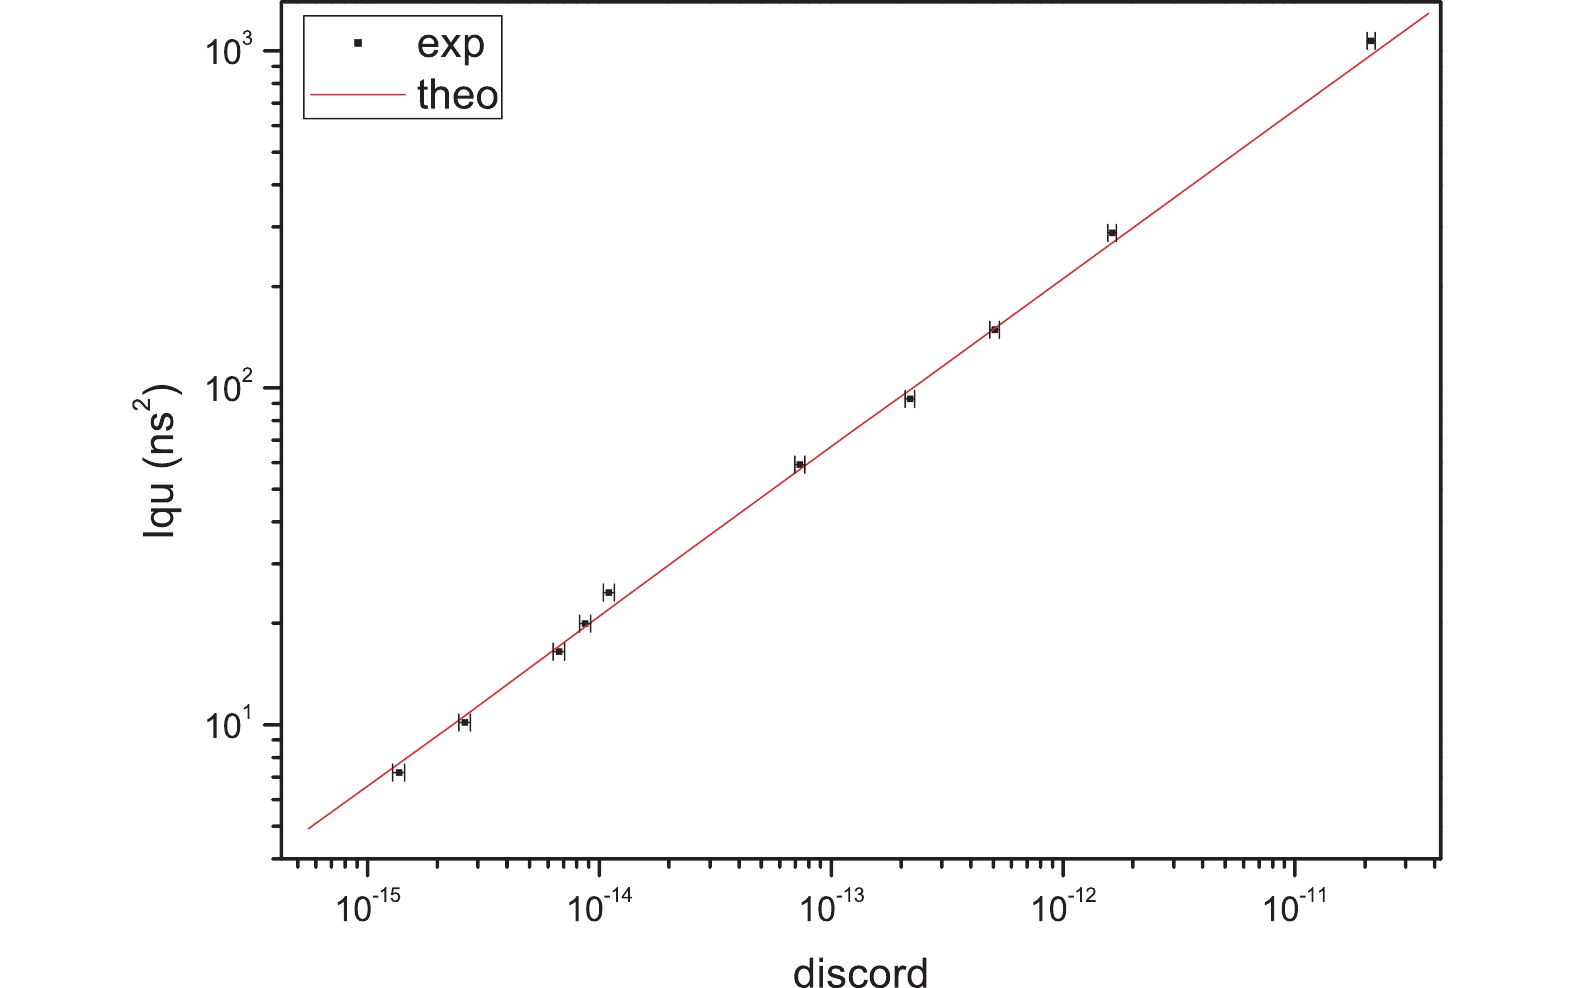
![]() Quantum Fisher information with quantum discord when implementing the DQC1 algorithm to estimate the hyperfine coupling
Quantum Fisher information with quantum discord when implementing the DQC1 algorithm to estimate the hyperfine coupling A . Theoretical predictions are calculated without considering the interaction between the system and environment. Owing to the interaction, the experimental data for quantum Fisher information and quantum discord are much smaller than the corresponding theoretical values. However, their experimentally obtained relationship is in good agreement with the theoretical prediction as shown in the figure. The error bars only include the estimated errors in numerically calculating quantum discord with density matrices.


Related articles
-
2024, 54(1): 1-2.
-
2023, 53(1): 1-2.
-
2019, 49(11): 861-872. DOI: 10.3969/j.issn.0253-2778.2019.11.001
-
2018, 48(12): 968-976. DOI: 10.3969/j.issn.0253-2778.2018.12.002
-
2017, 47(2): 117-128. DOI: 10.3969/j.issn.0253-2778.2017.02.003
-
2010, 40(4): 331-338. DOI: 10.3969/j.issn.0253-2778.2010.04.001
-
1993, 23(1): 1.
-
1992, 22(1): 1.
-
1991, 21(1): 1.
-
1989, 19(1): 1.
