 Download:
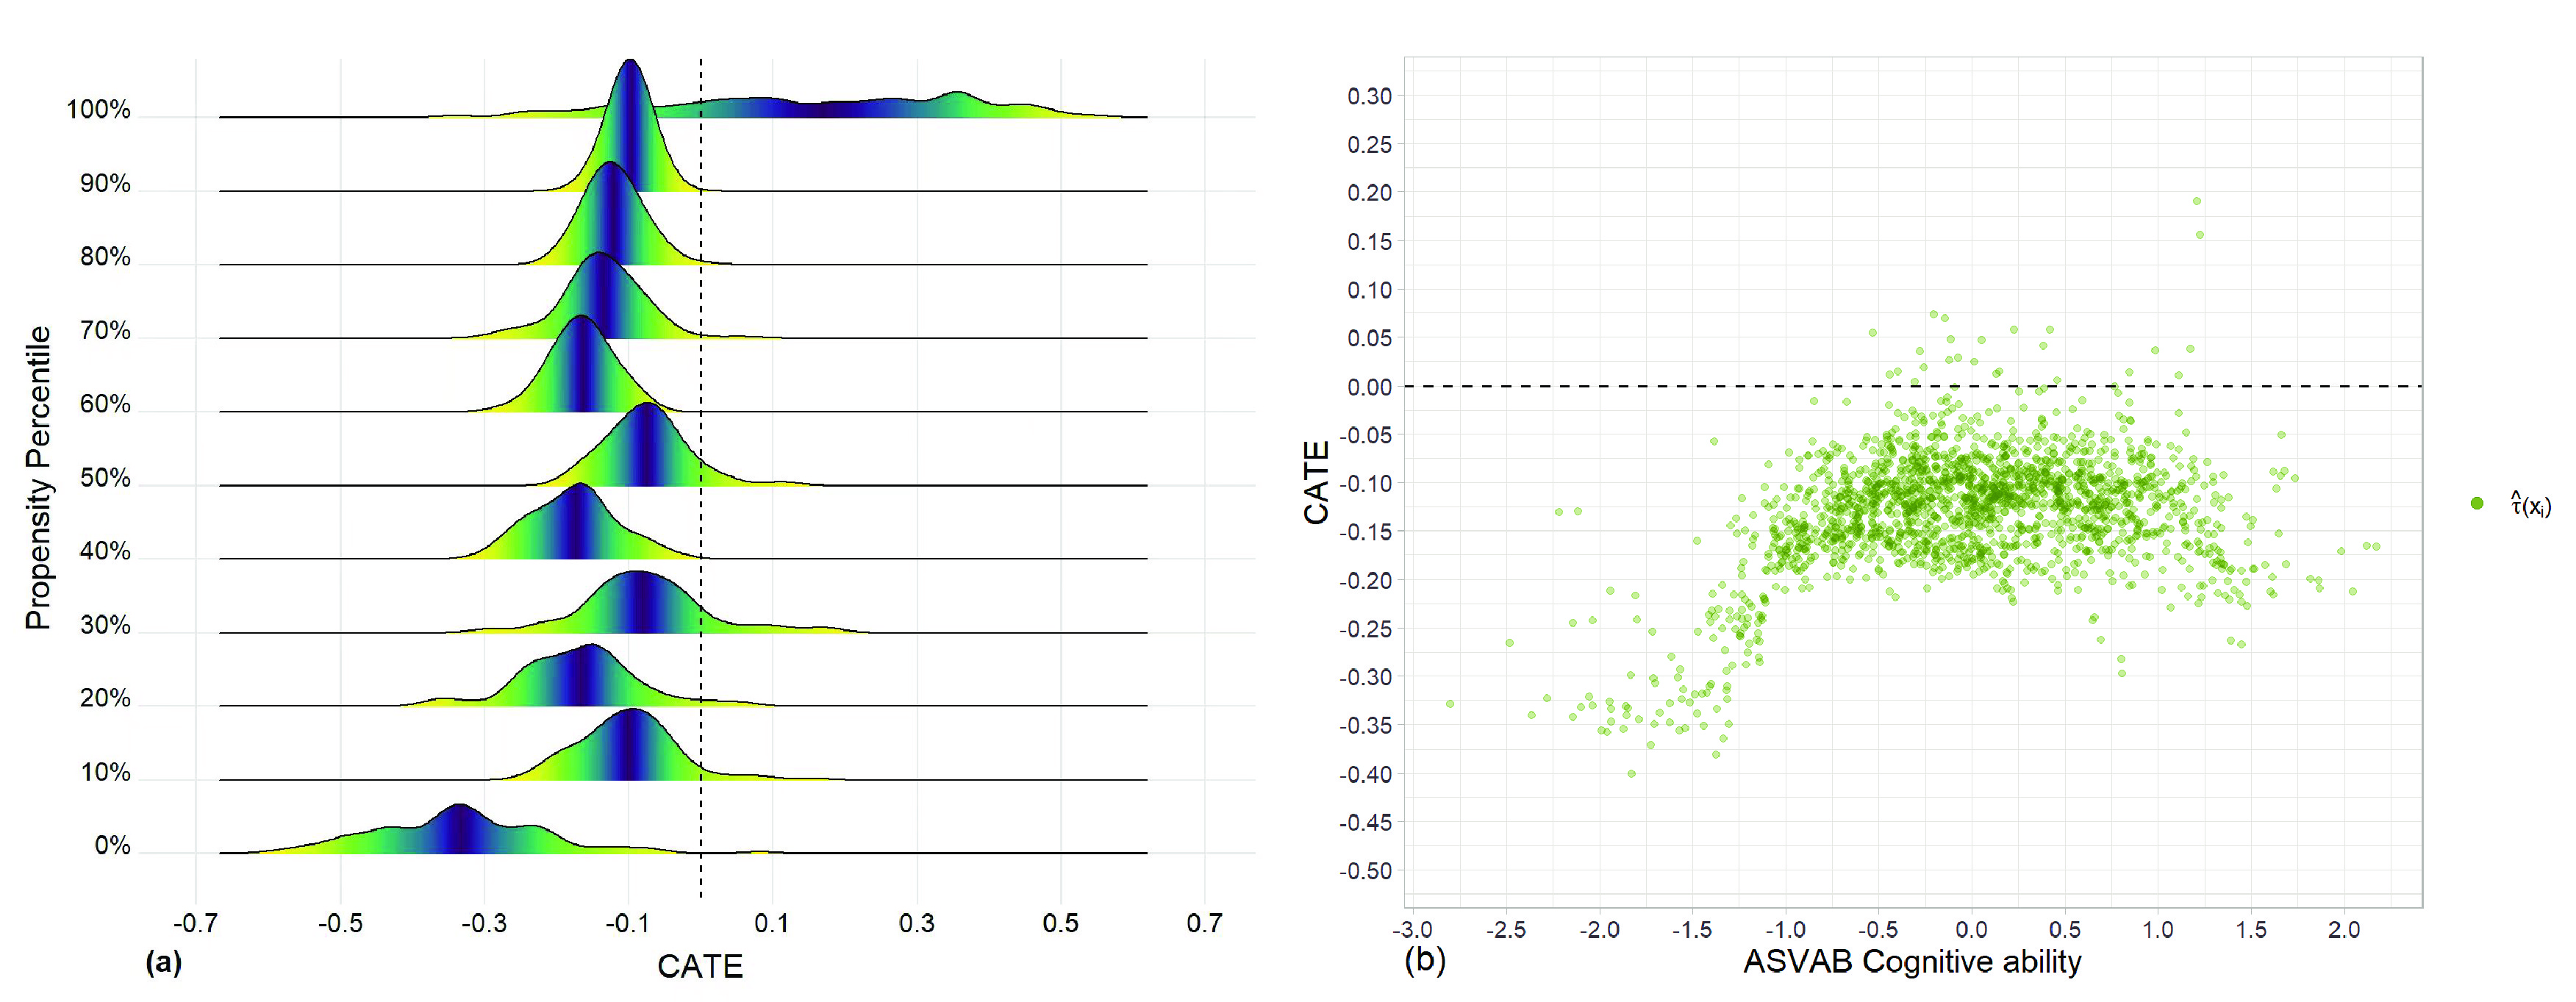
(a) The graph displays the distribution of estimated heterogeneous treatment effects corresponding to the approximated propensity score percentiles. (b) Scatter plots of estimated treatment effect (averaged over the 100 iterations) against ASVAB cognitive ability.
Figures of the Article
-
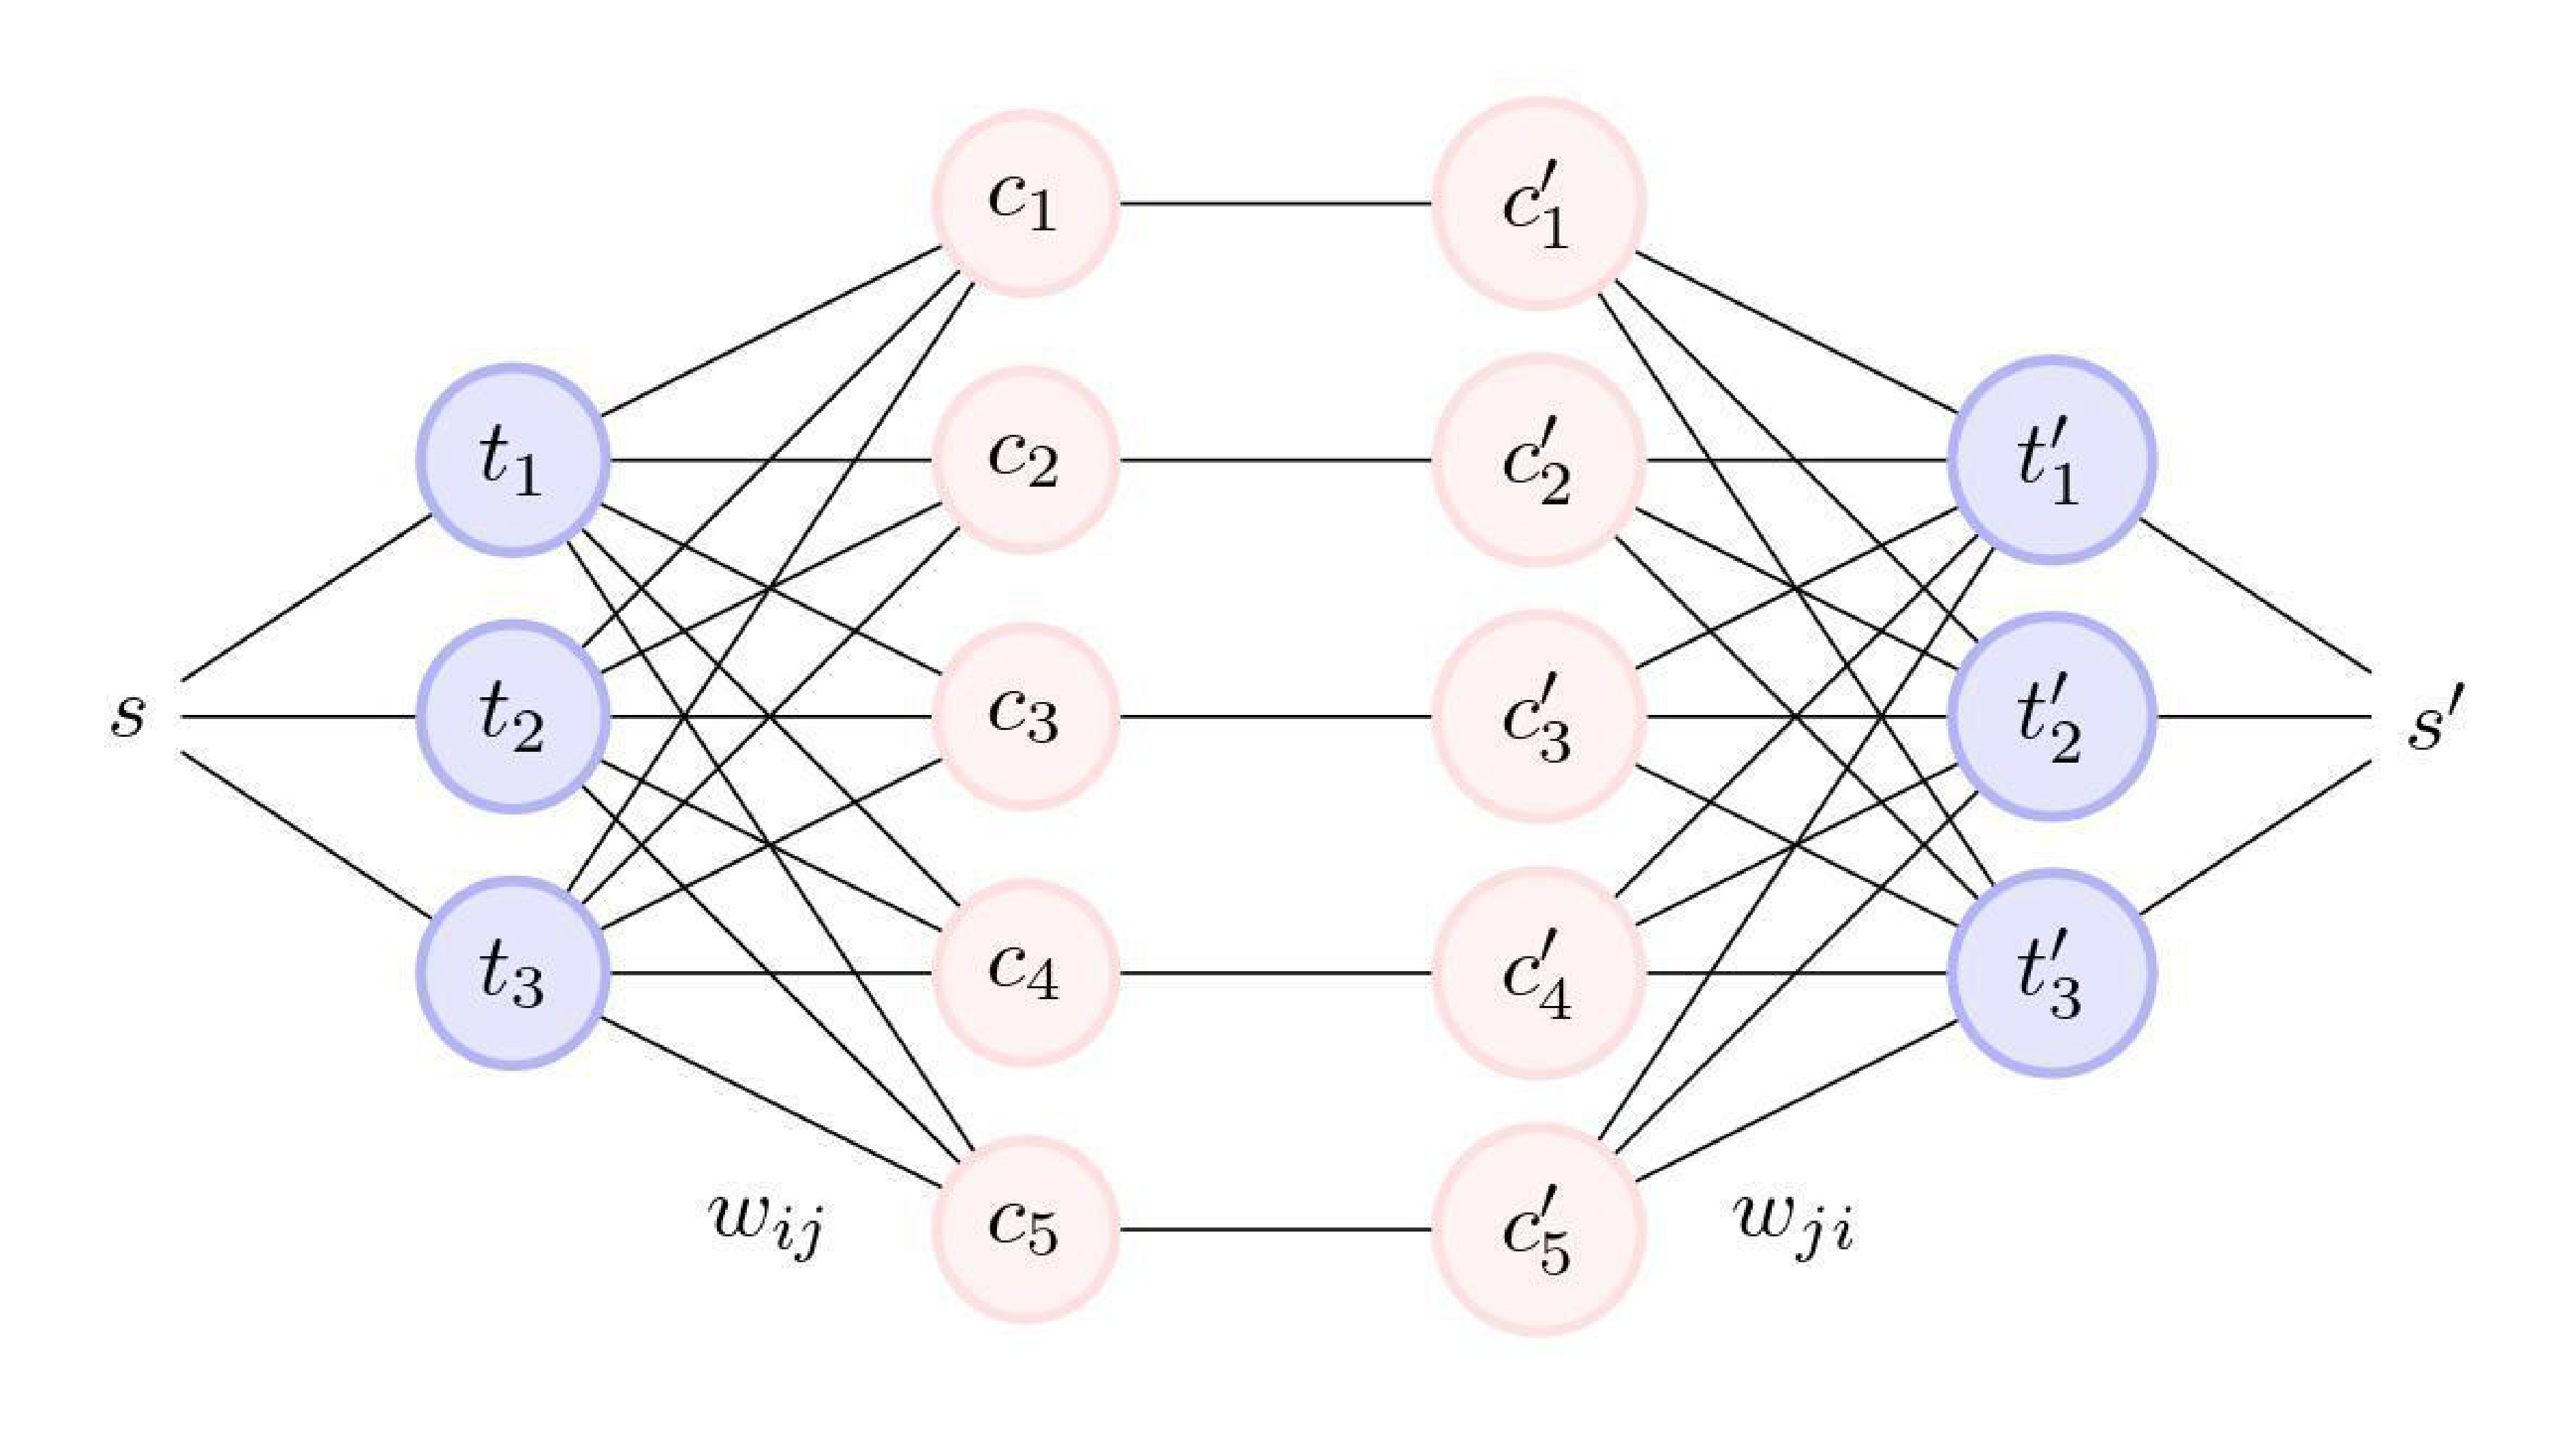
![]() Tripartite network structure.
Tripartite network structure.
-
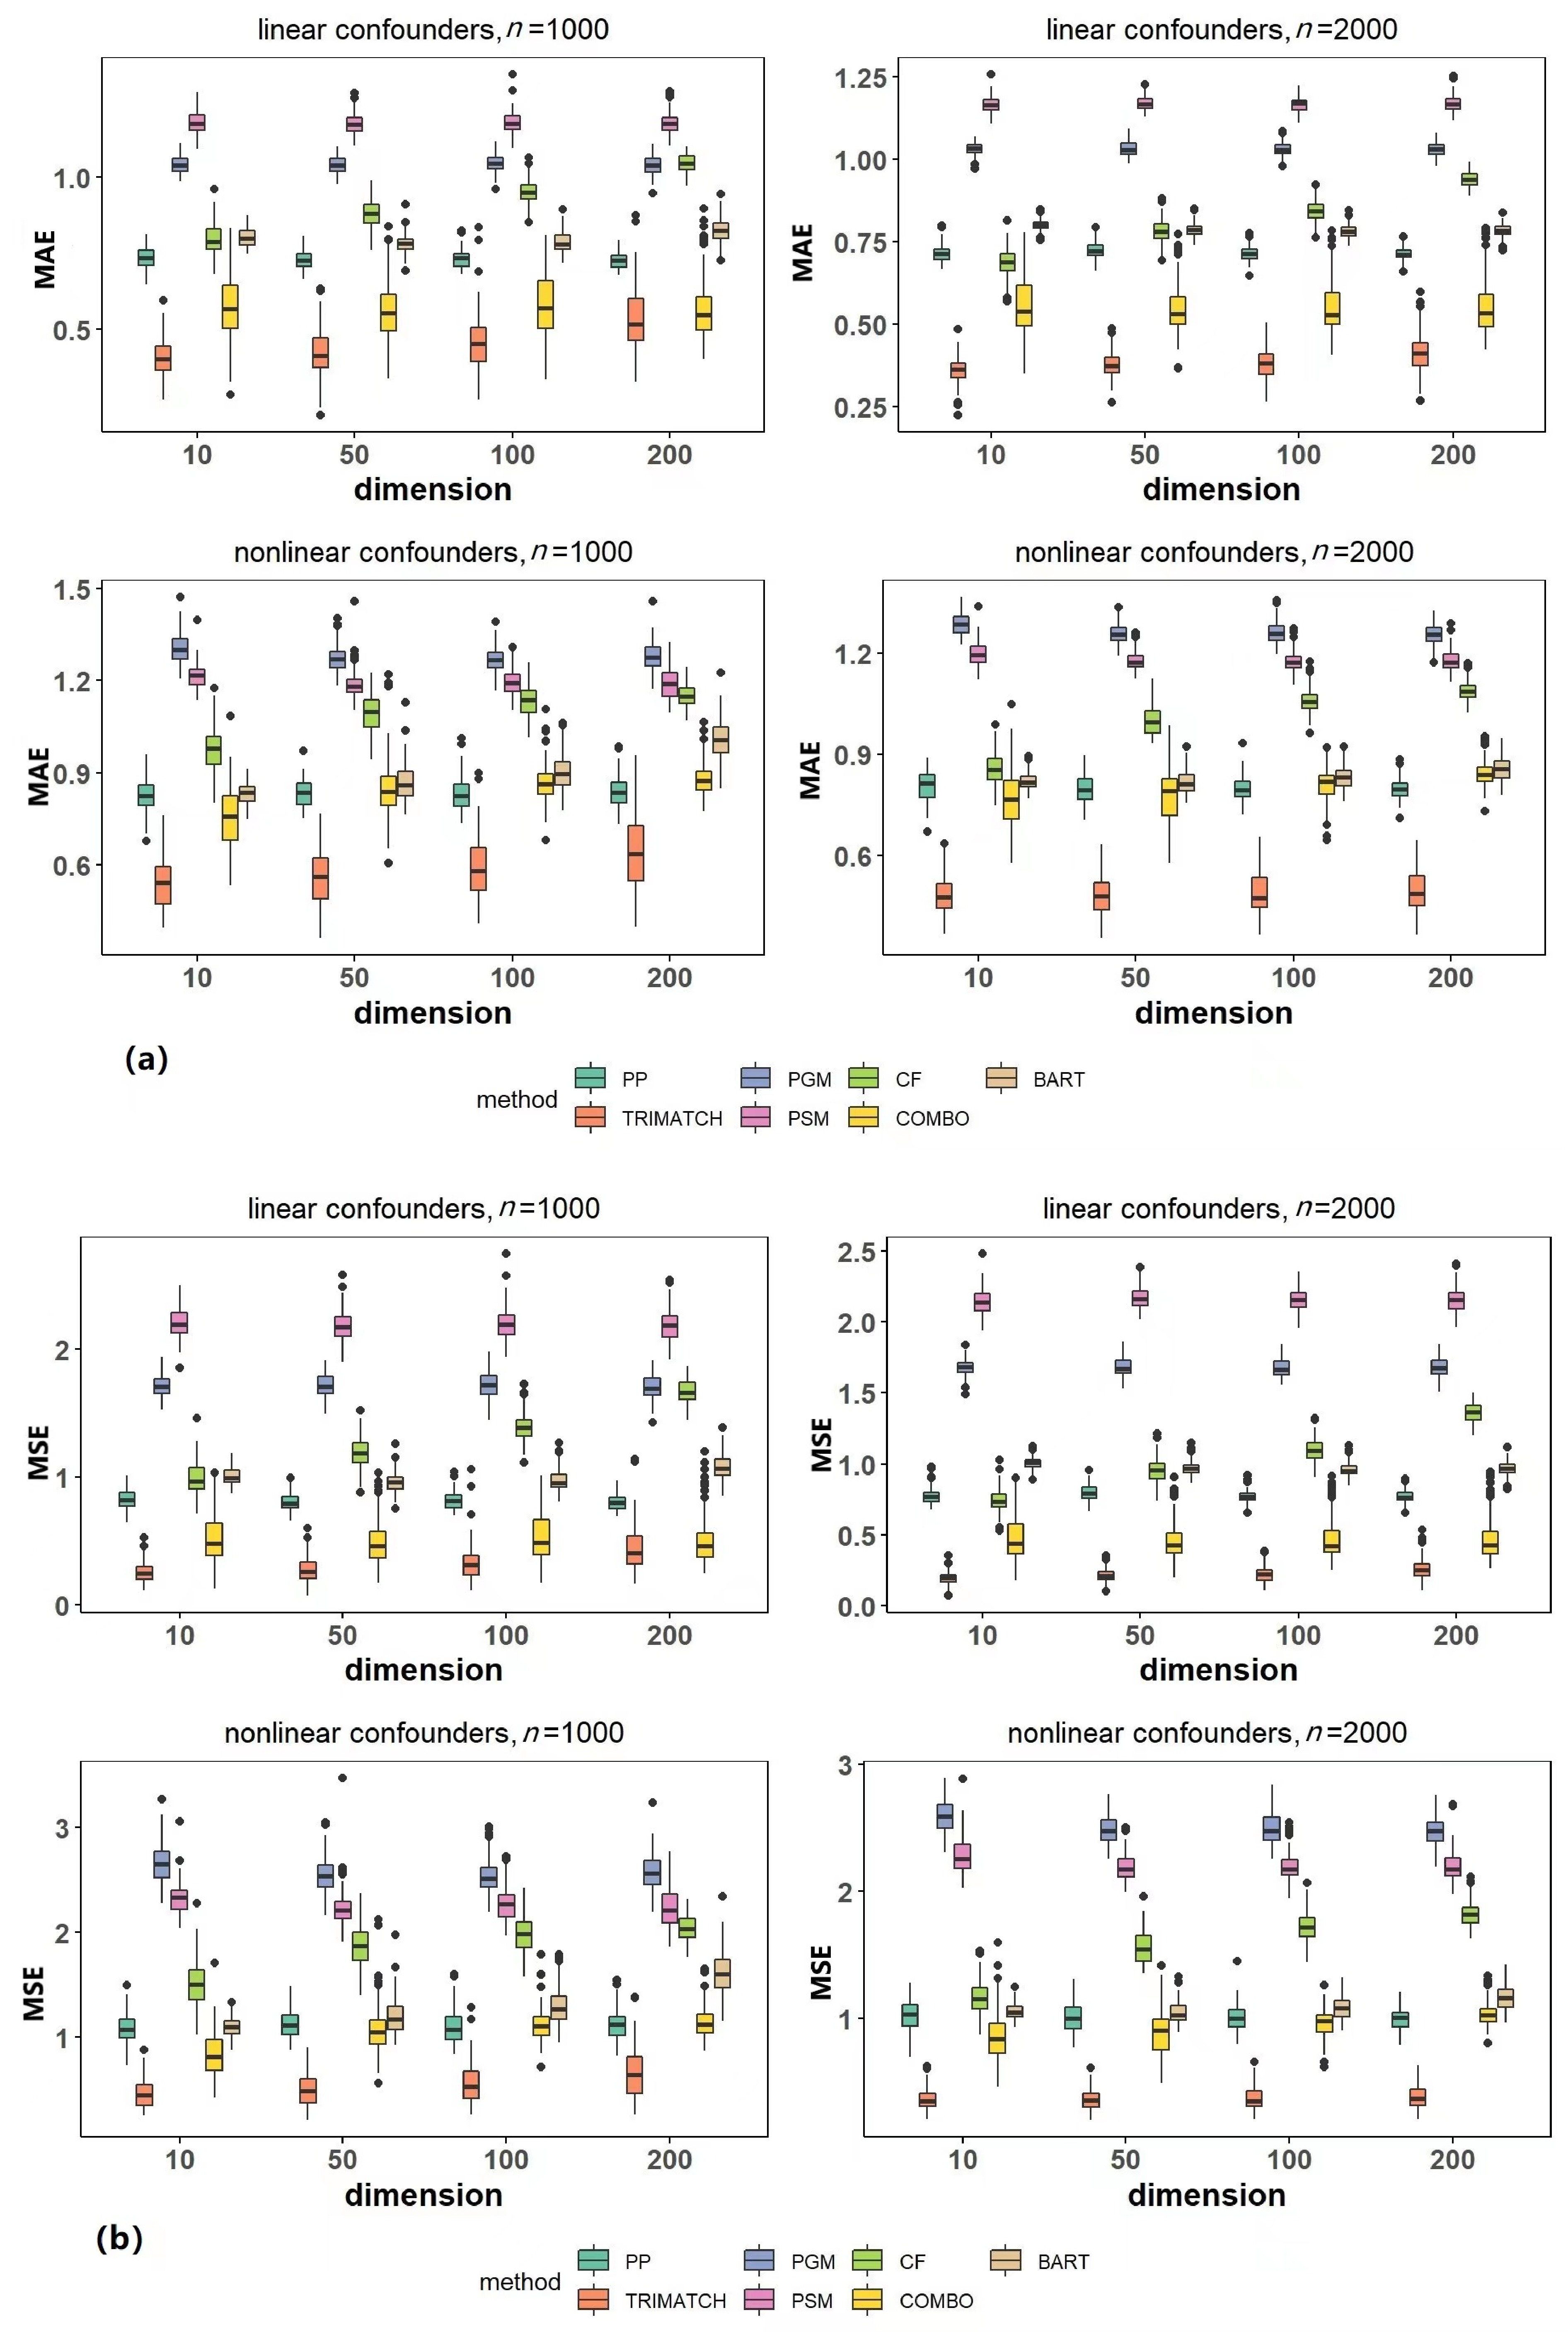
![]() Comparison between different methods. (a) Mean absolute errors of 100 simulations forvarious methods. (b) Mean squared errors of 100 simulations for various methods
Comparison between different methods. (a) Mean absolute errors of 100 simulations forvarious methods. (b) Mean squared errors of 100 simulations for various methods
-
![]() (a) The graph displays the distribution of estimated heterogeneous treatment effects corresponding to the approximated propensity score percentiles. (b) Scatter plots of estimated treatment effect (averaged over the 100 iterations) against ASVAB cognitive ability.
(a) The graph displays the distribution of estimated heterogeneous treatment effects corresponding to the approximated propensity score percentiles. (b) Scatter plots of estimated treatment effect (averaged over the 100 iterations) against ASVAB cognitive ability.
-
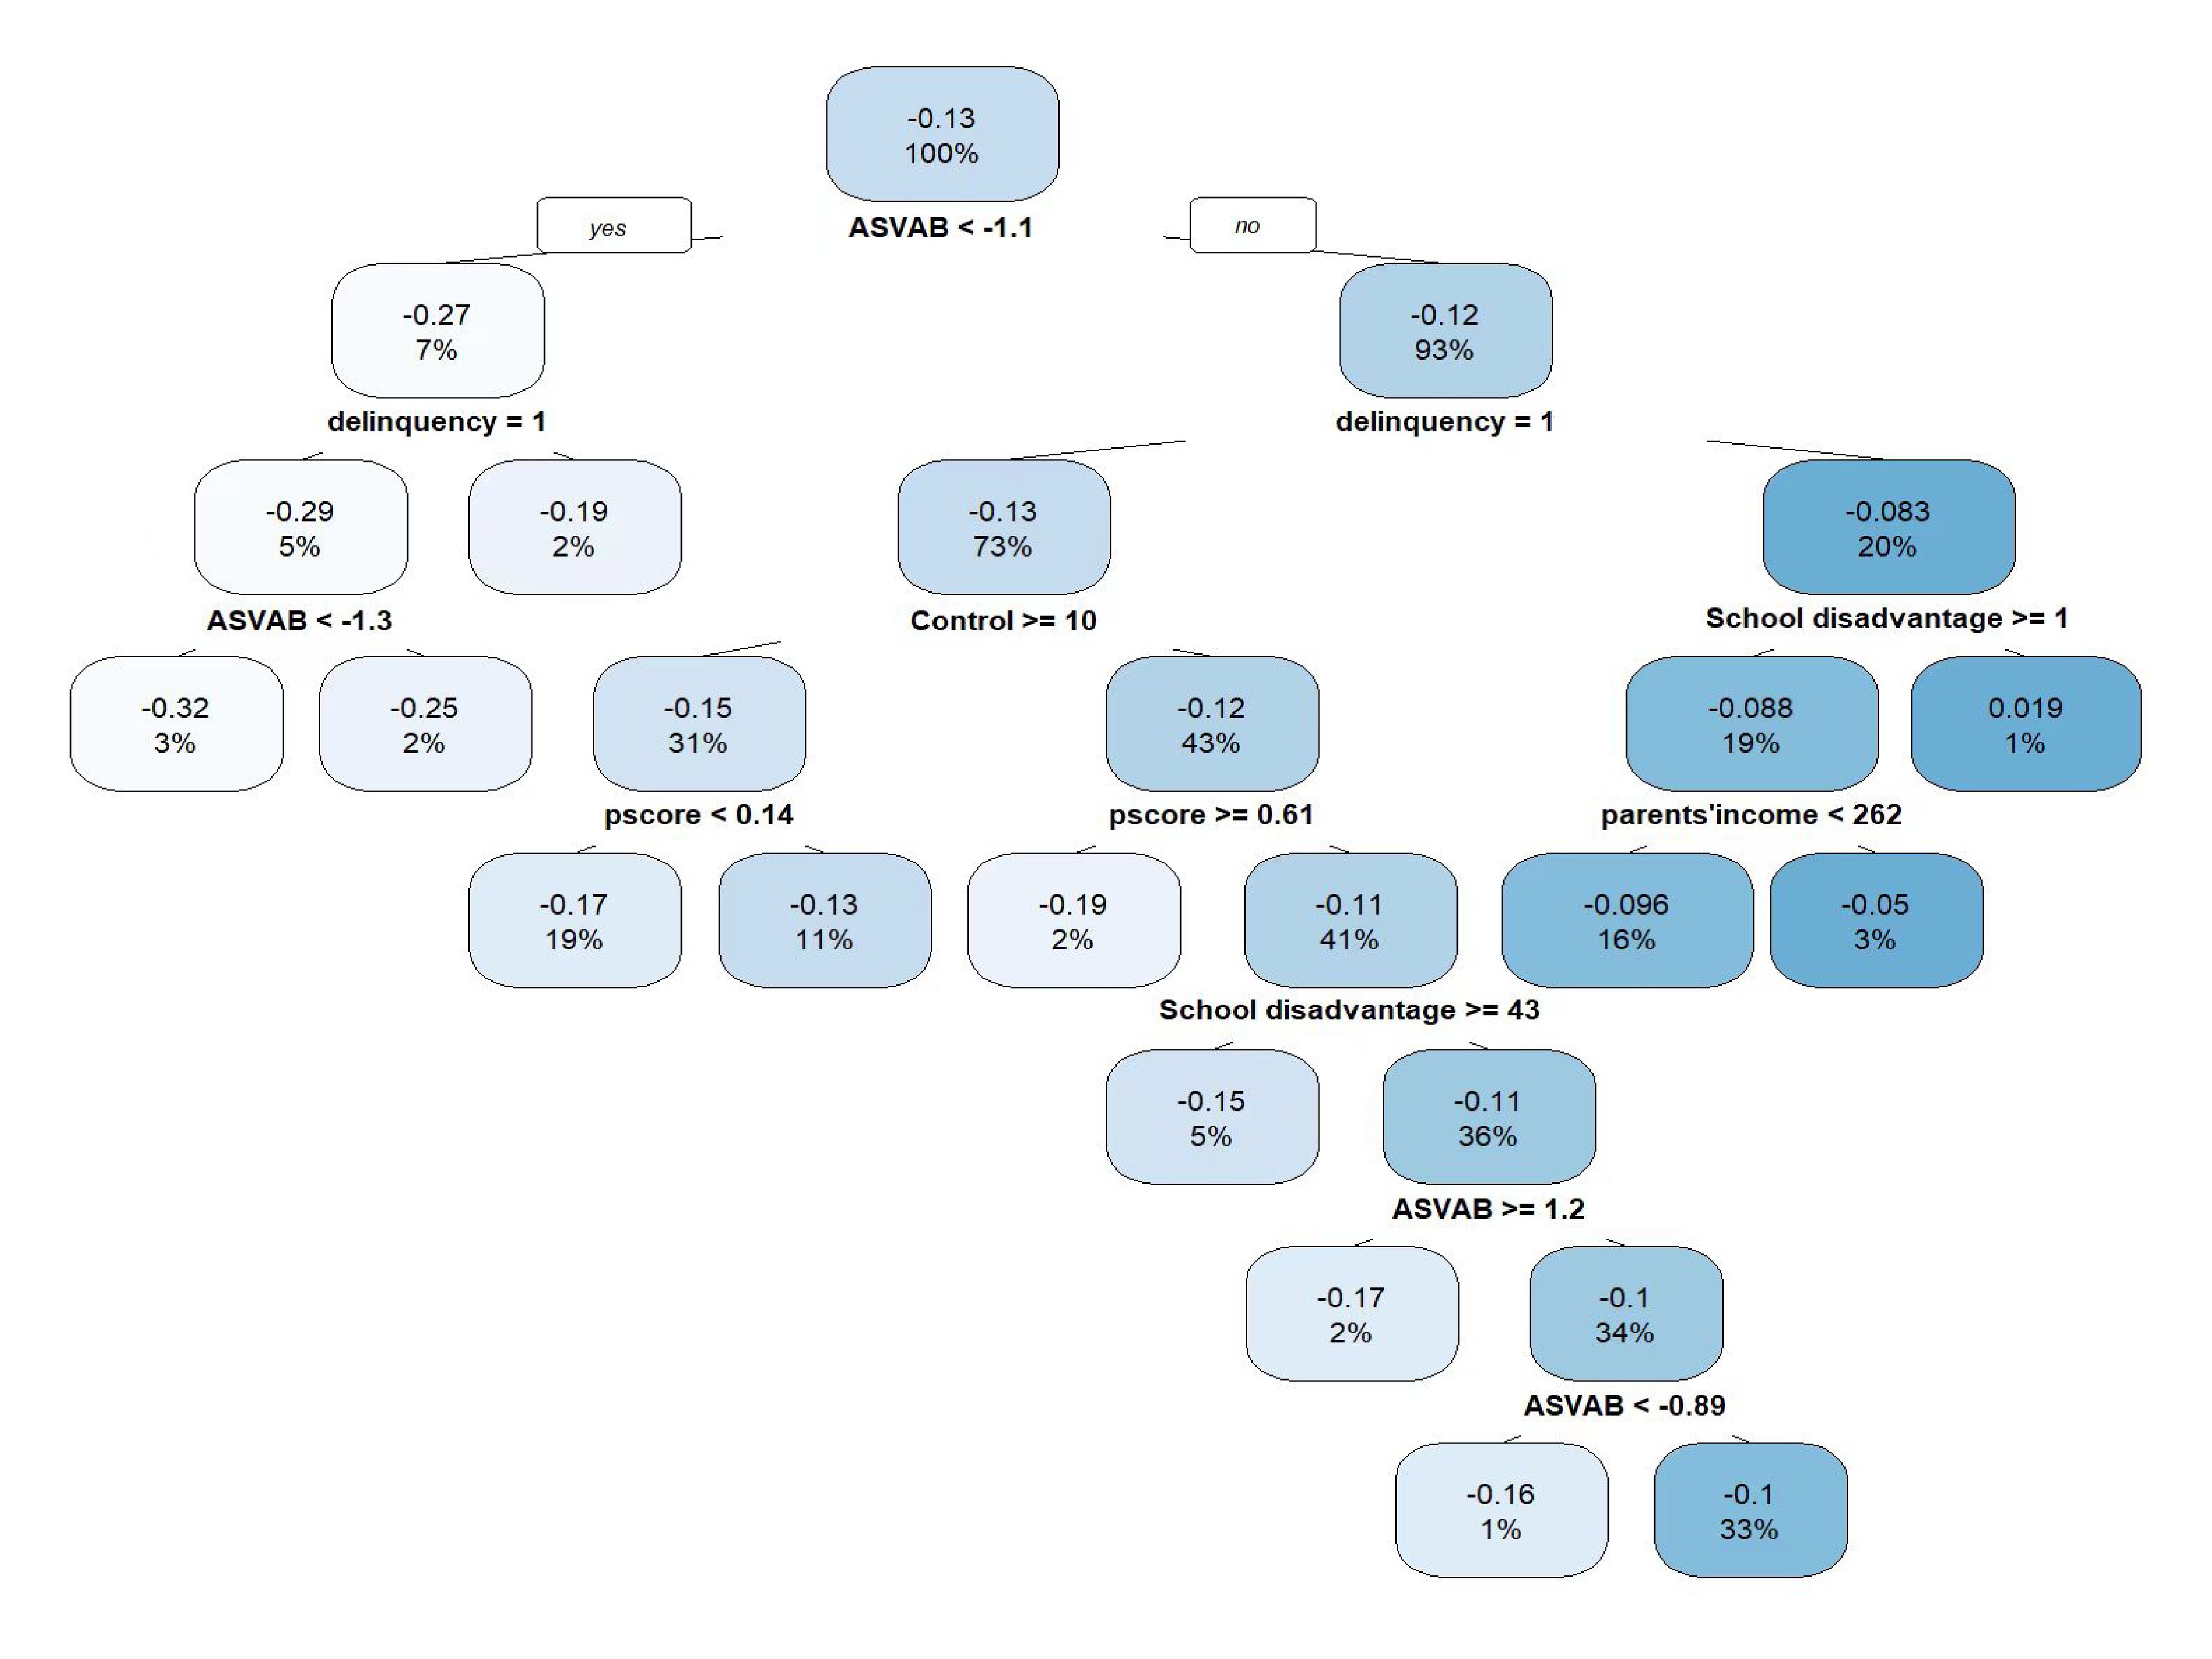
![]() Prediction model of heterogeneous treatment effects
Prediction model of heterogeneous treatment effects