
 Download:
Figures of the Article
-
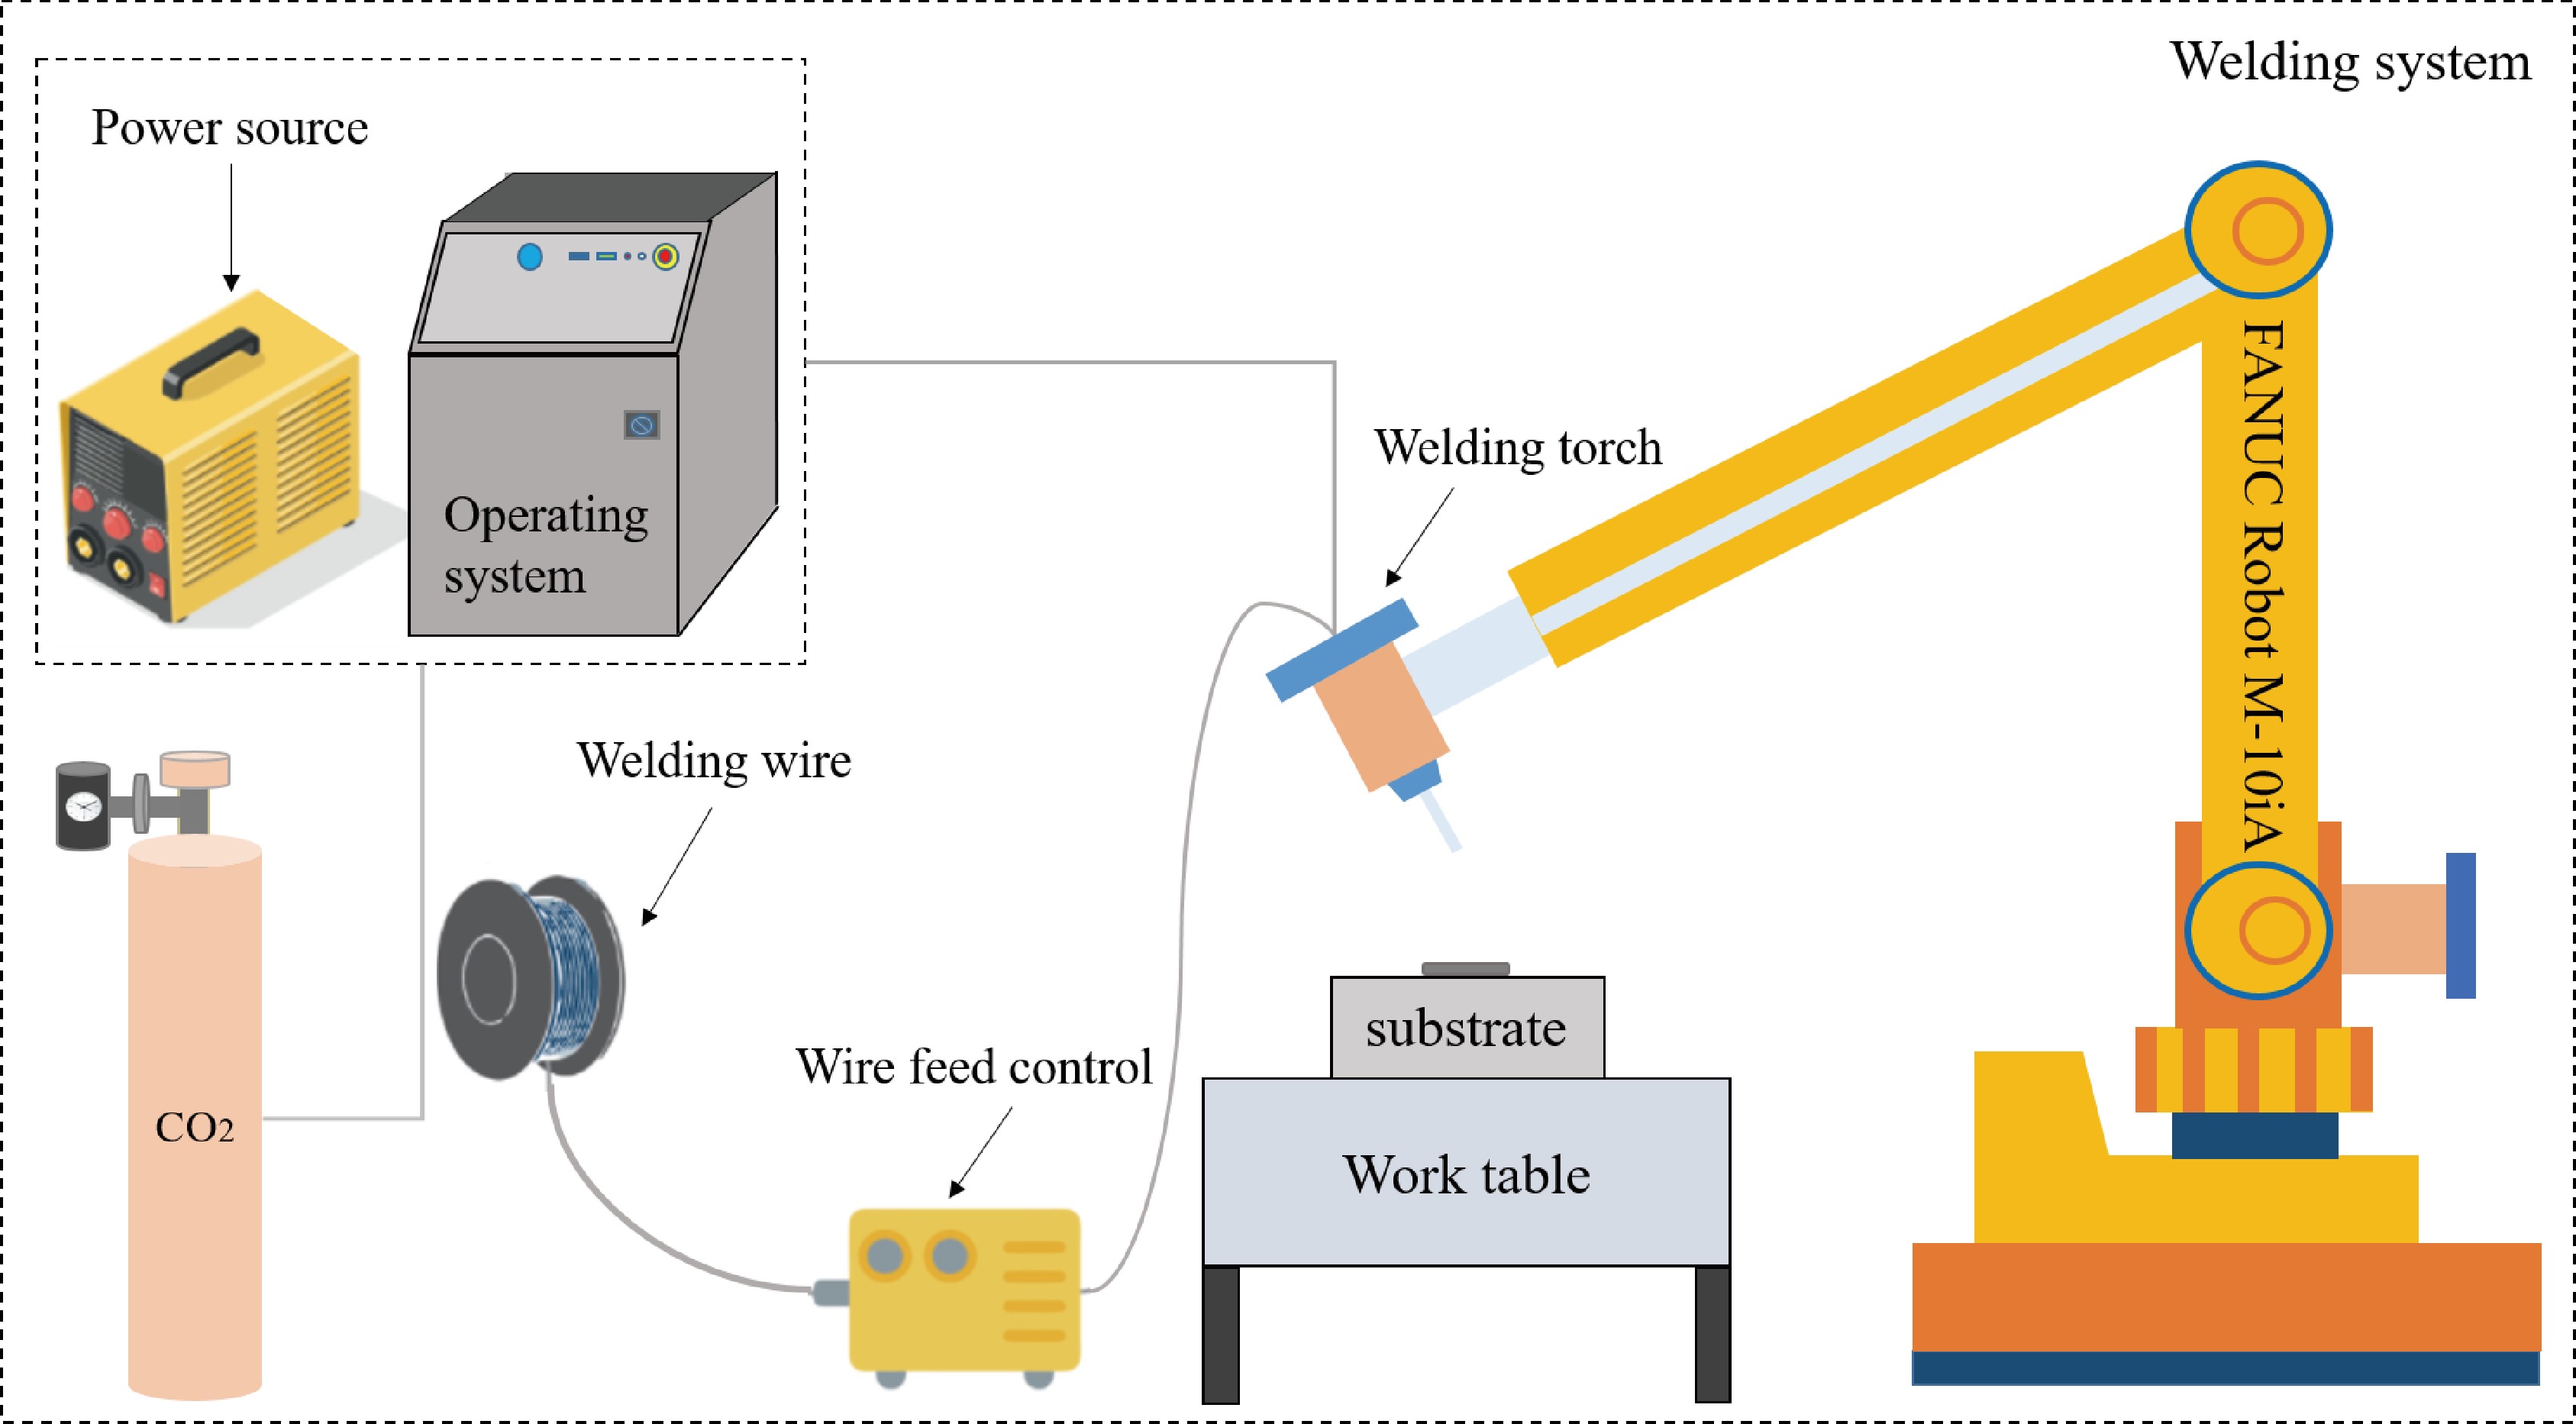
![]() GMAW welding system.
GMAW welding system.
-
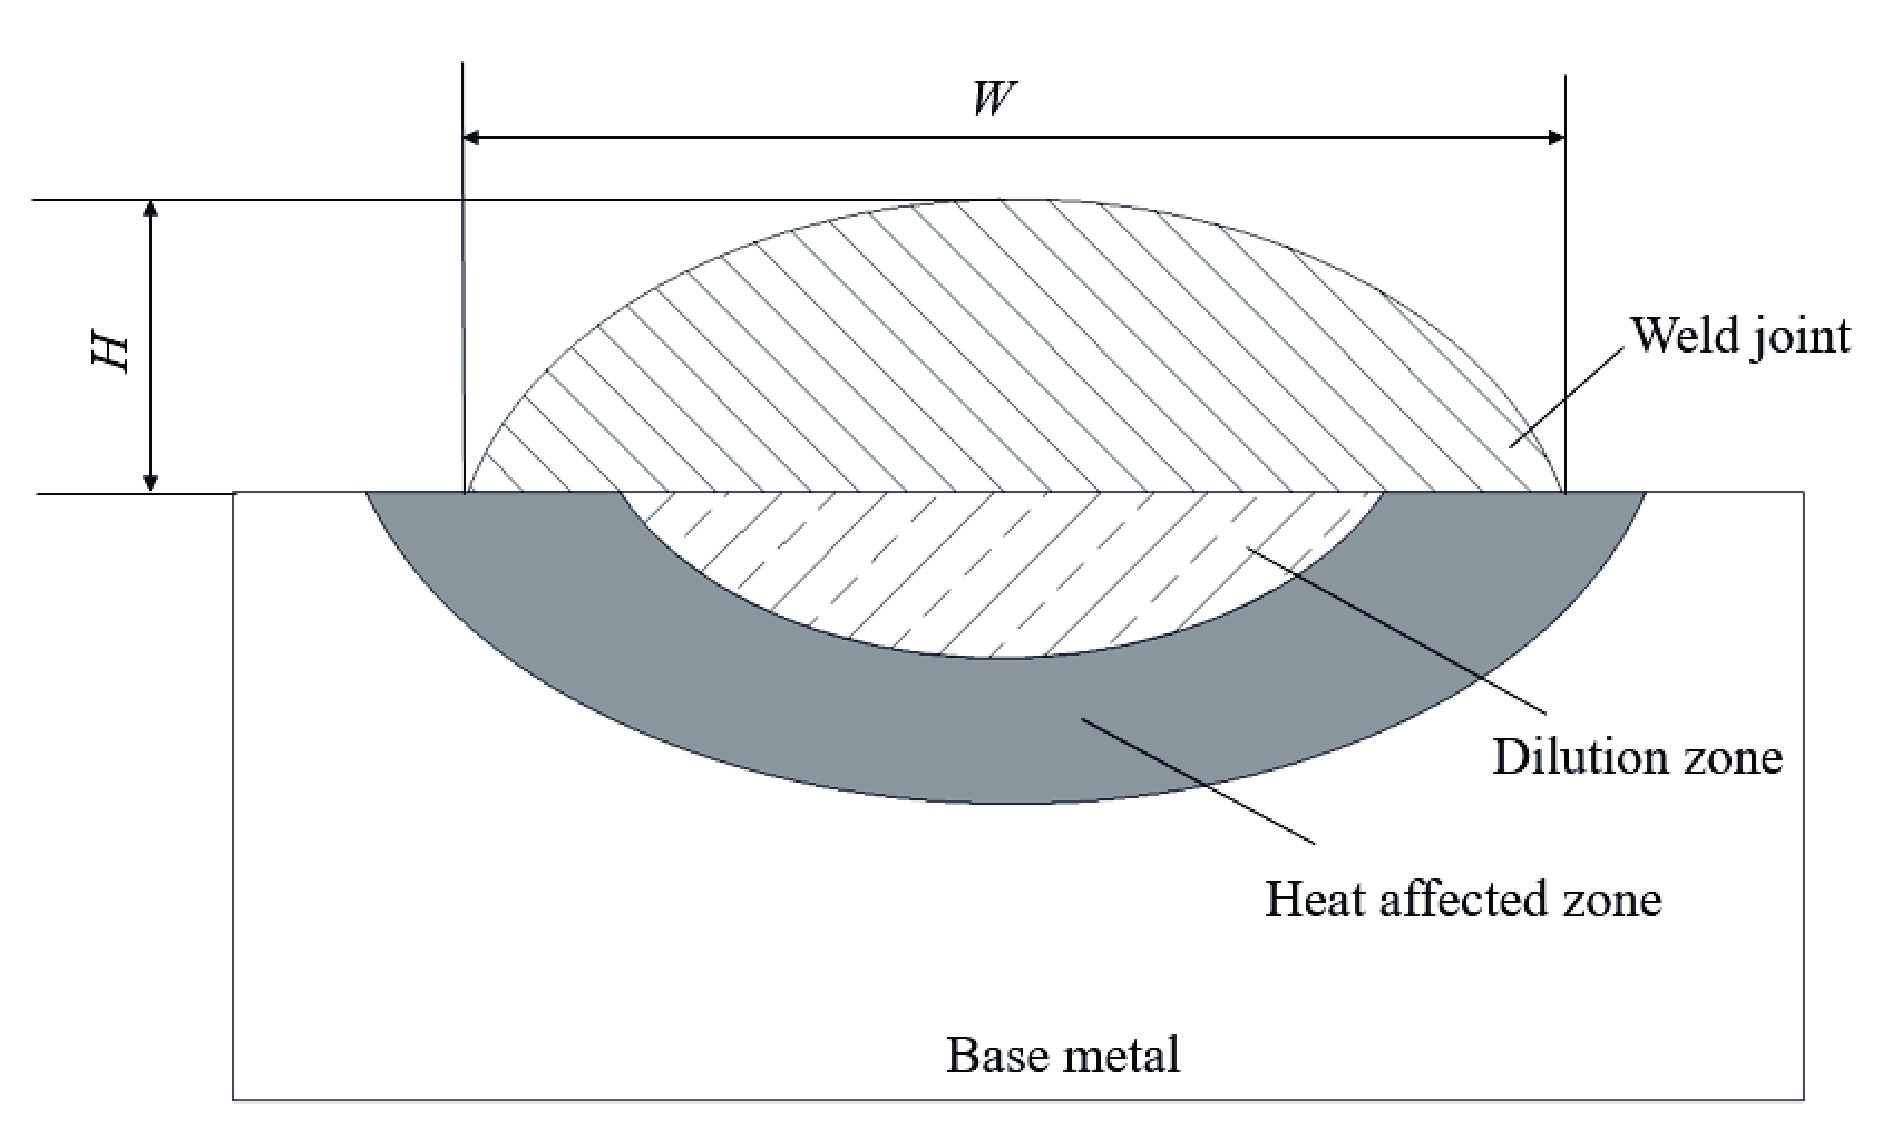
![]() Schematic cross-section diagram of the weld joint.
Schematic cross-section diagram of the weld joint.
-
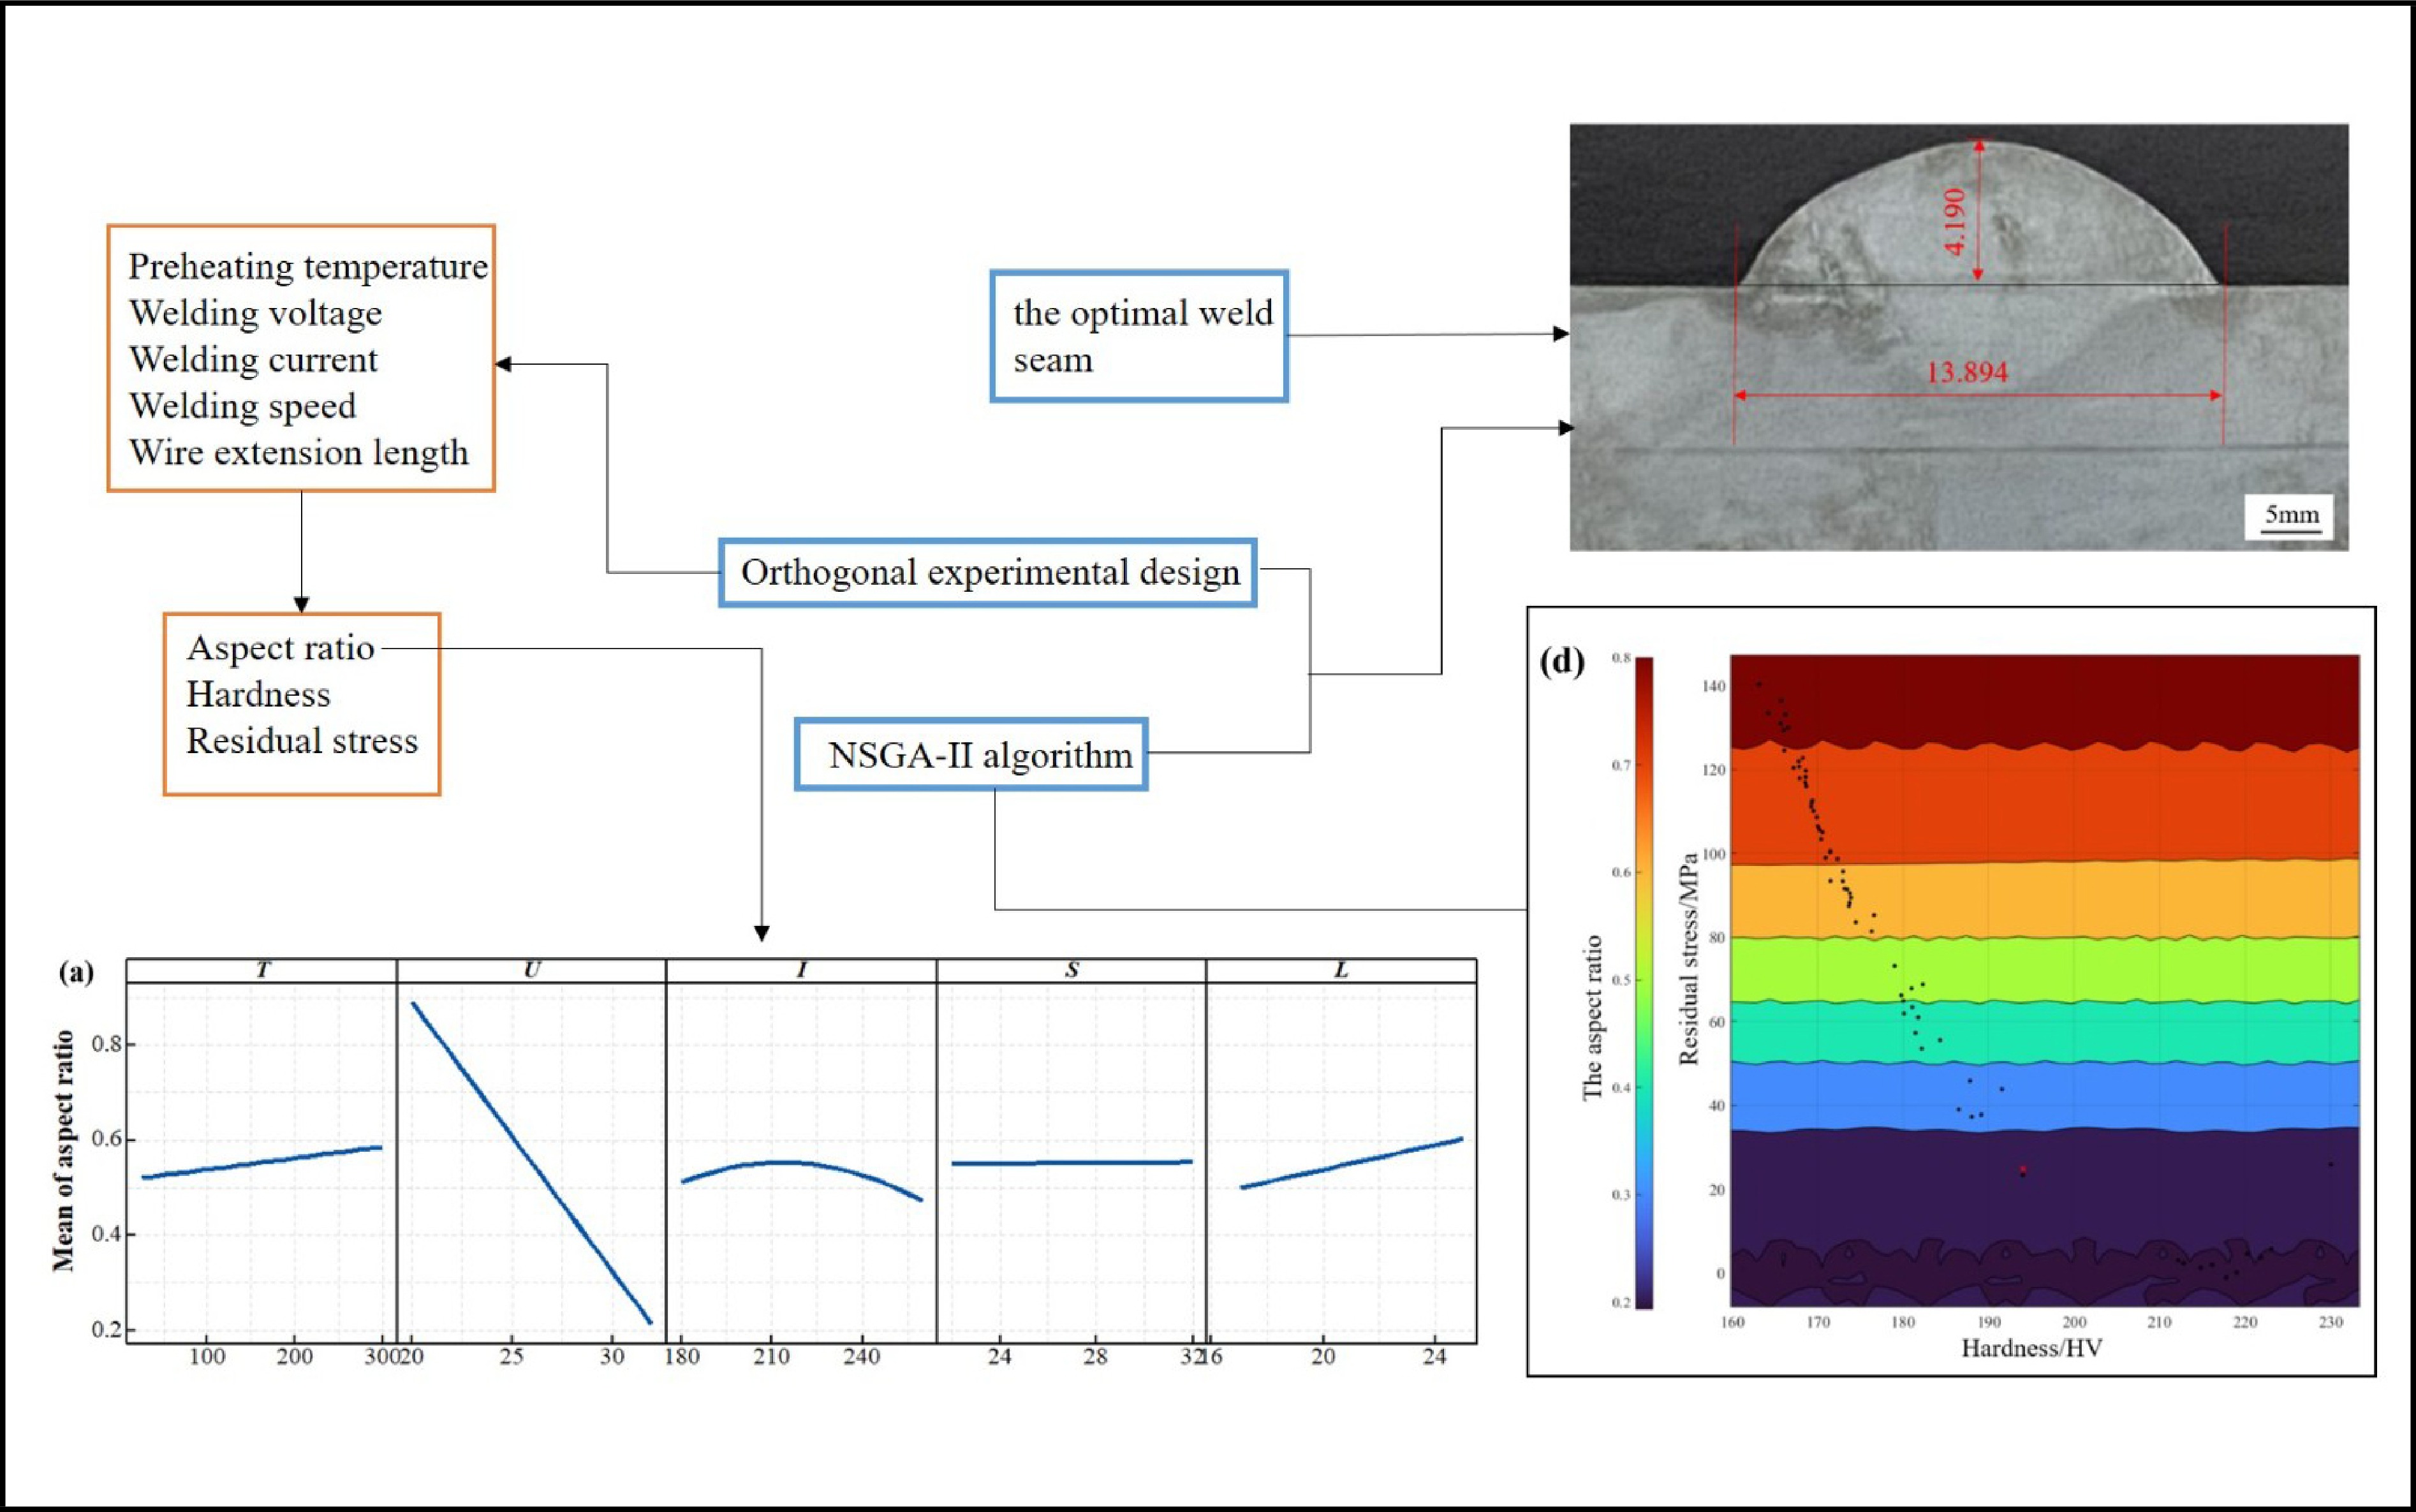
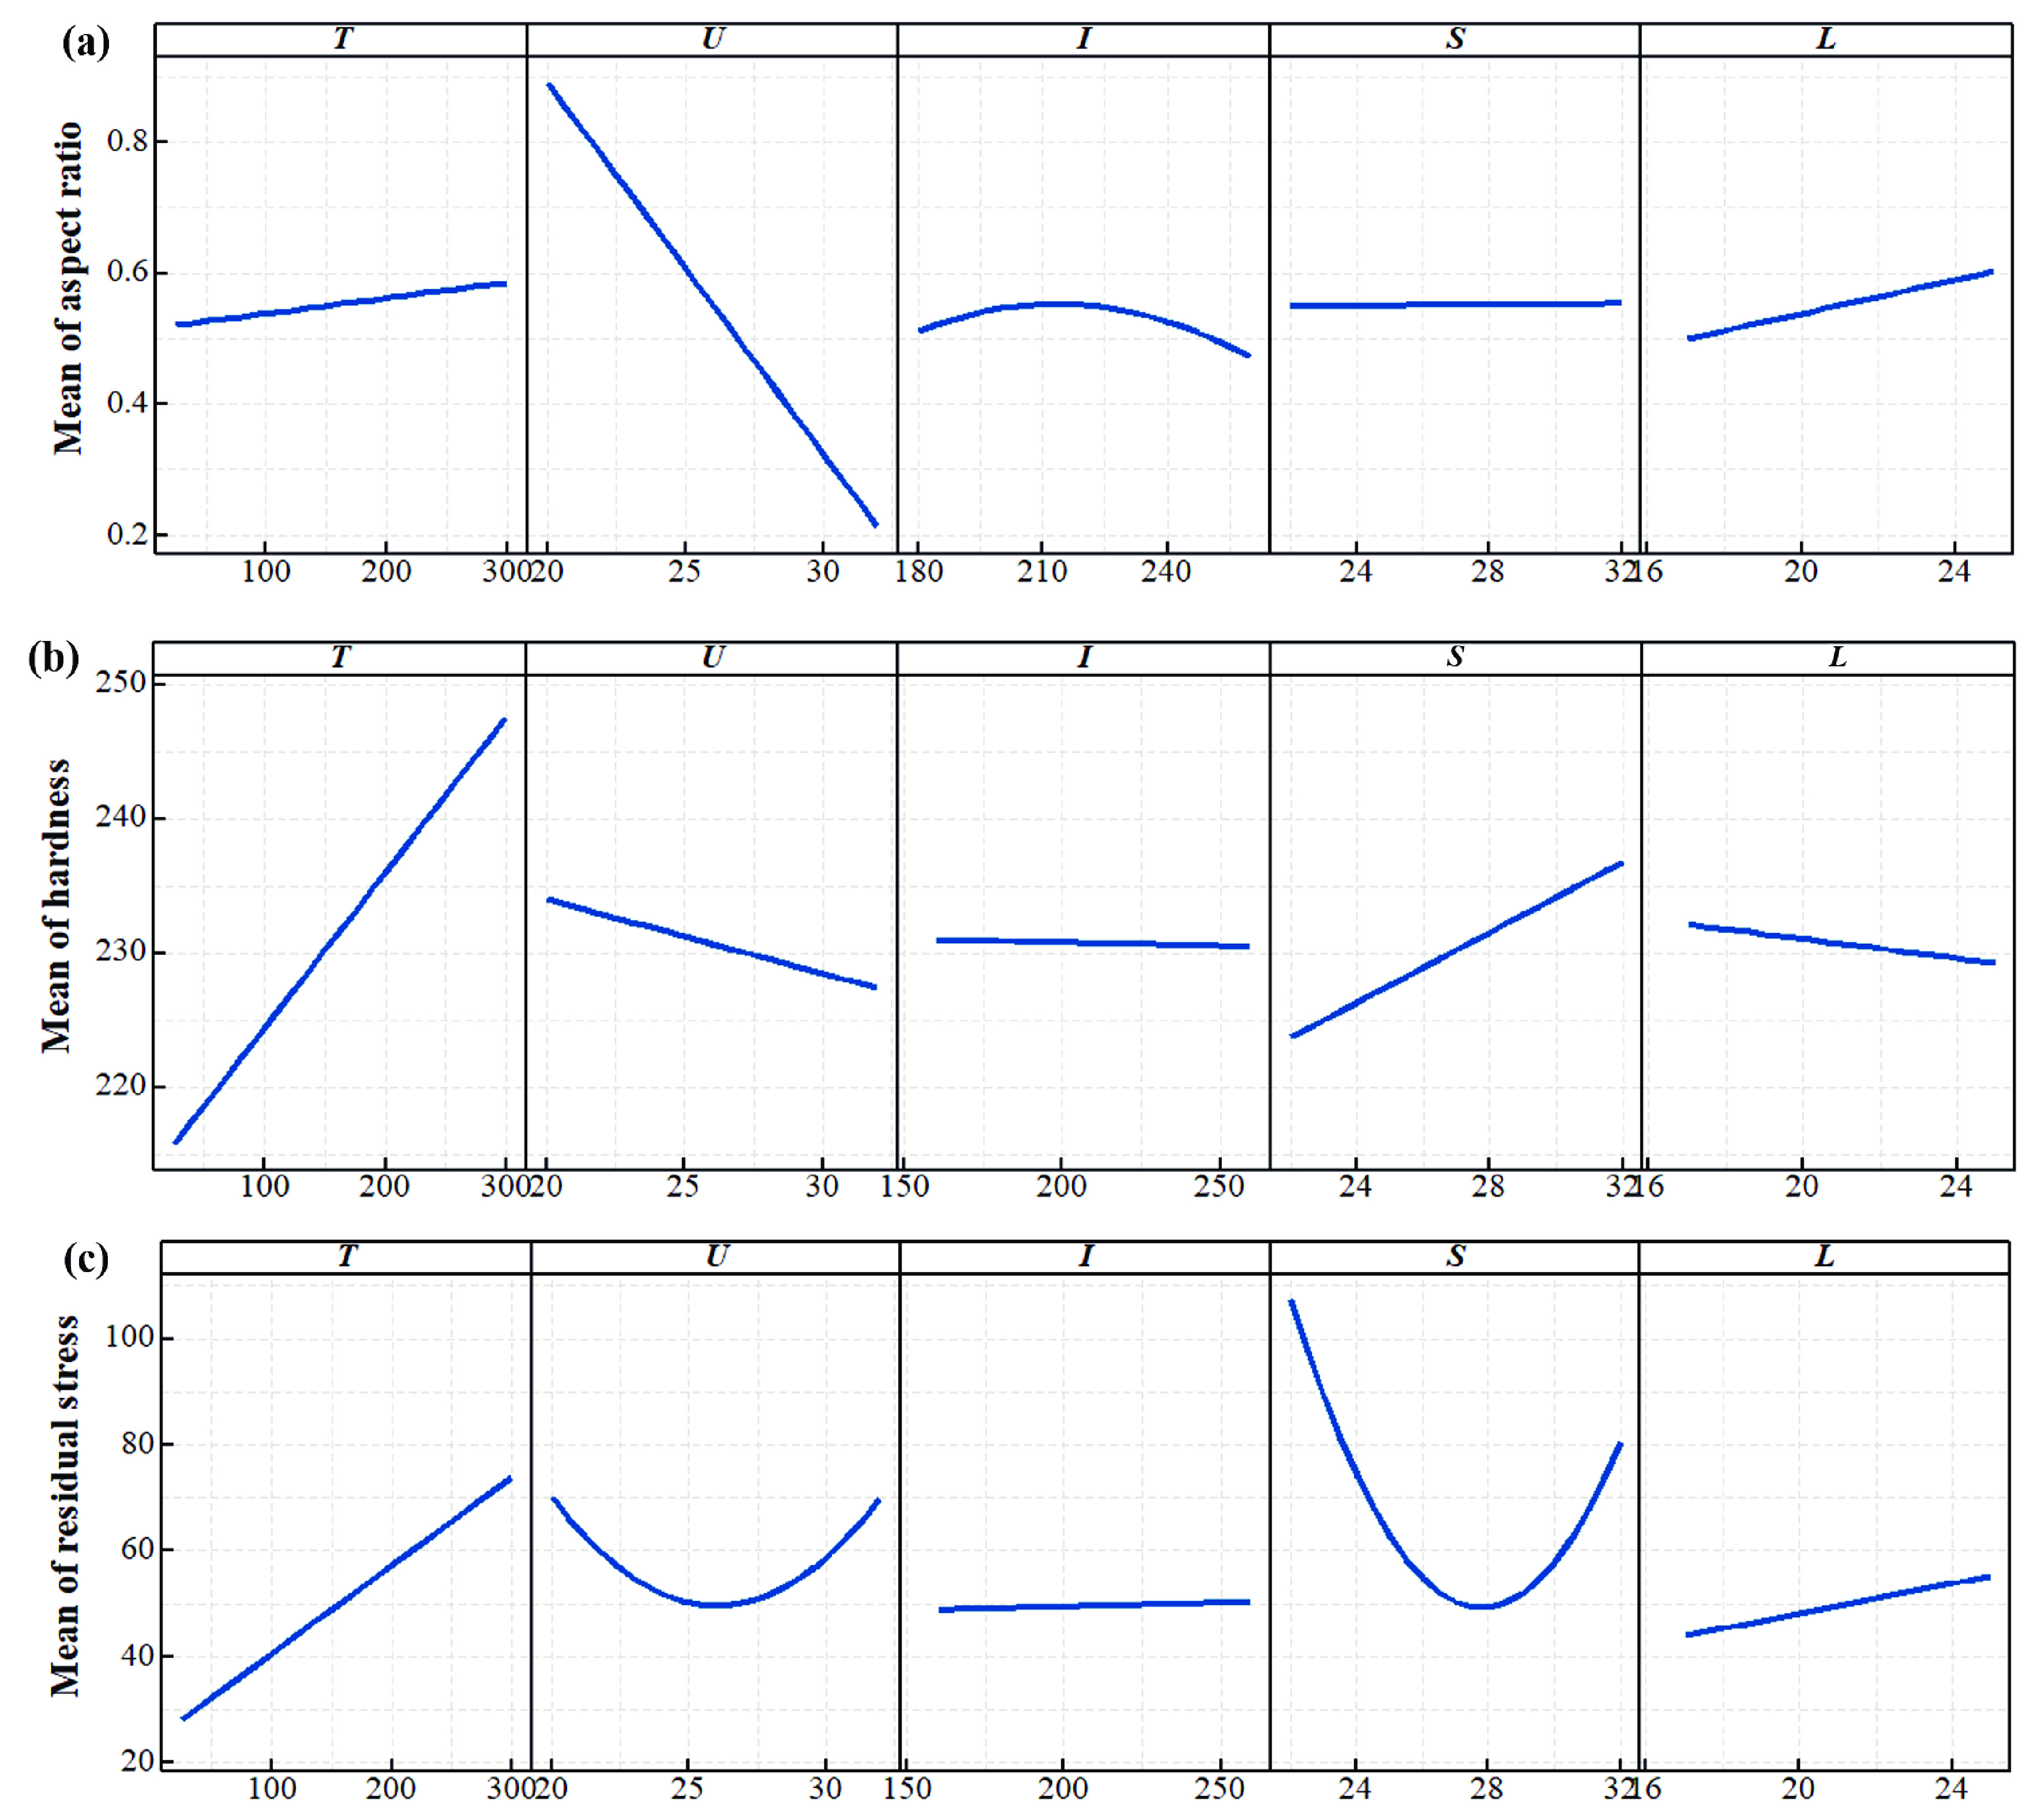
![]() Main effects of (a) the aspect ratio model, (b) the hardness model, and (c) the residual stress model.
Main effects of (a) the aspect ratio model, (b) the hardness model, and (c) the residual stress model.
-
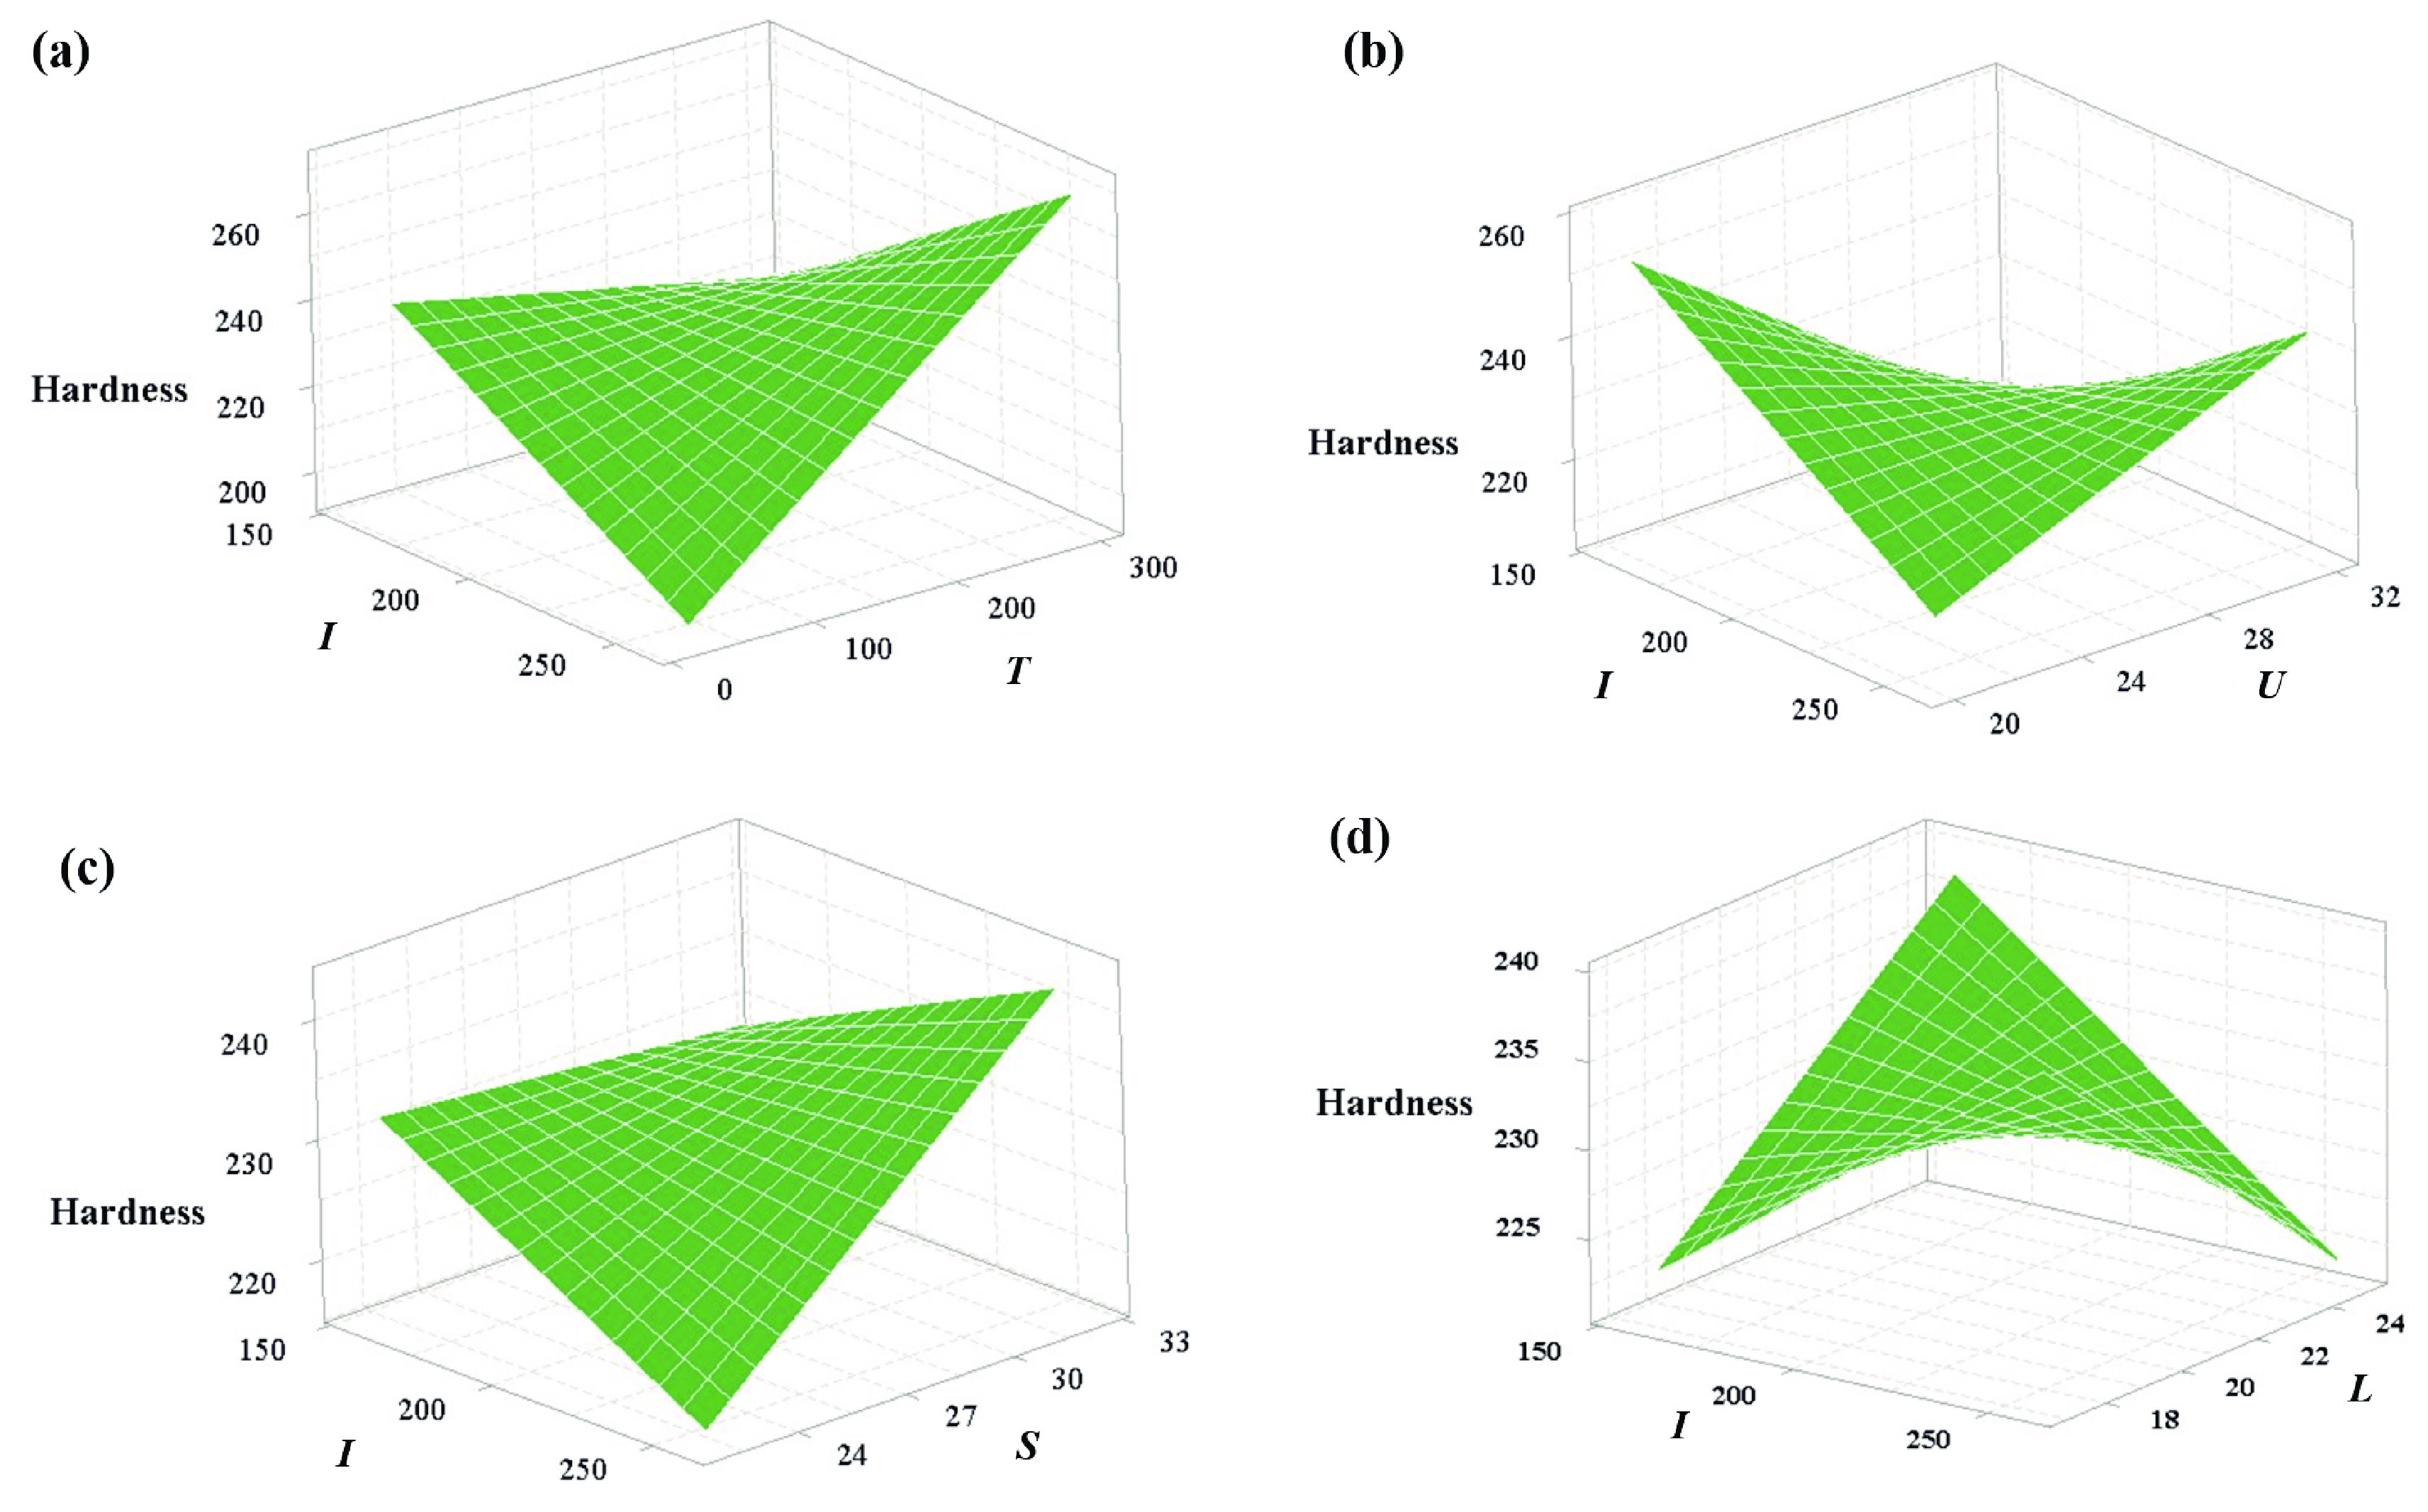
![]() Surface plots of (a) the hardness, I, and T ; (b) the hardness, U, and I; (c) the hardness, I, and S; (d) the hardness, I, and L.
Surface plots of (a) the hardness, I, and T ; (b) the hardness, U, and I; (c) the hardness, I, and S; (d) the hardness, I, and L.
-
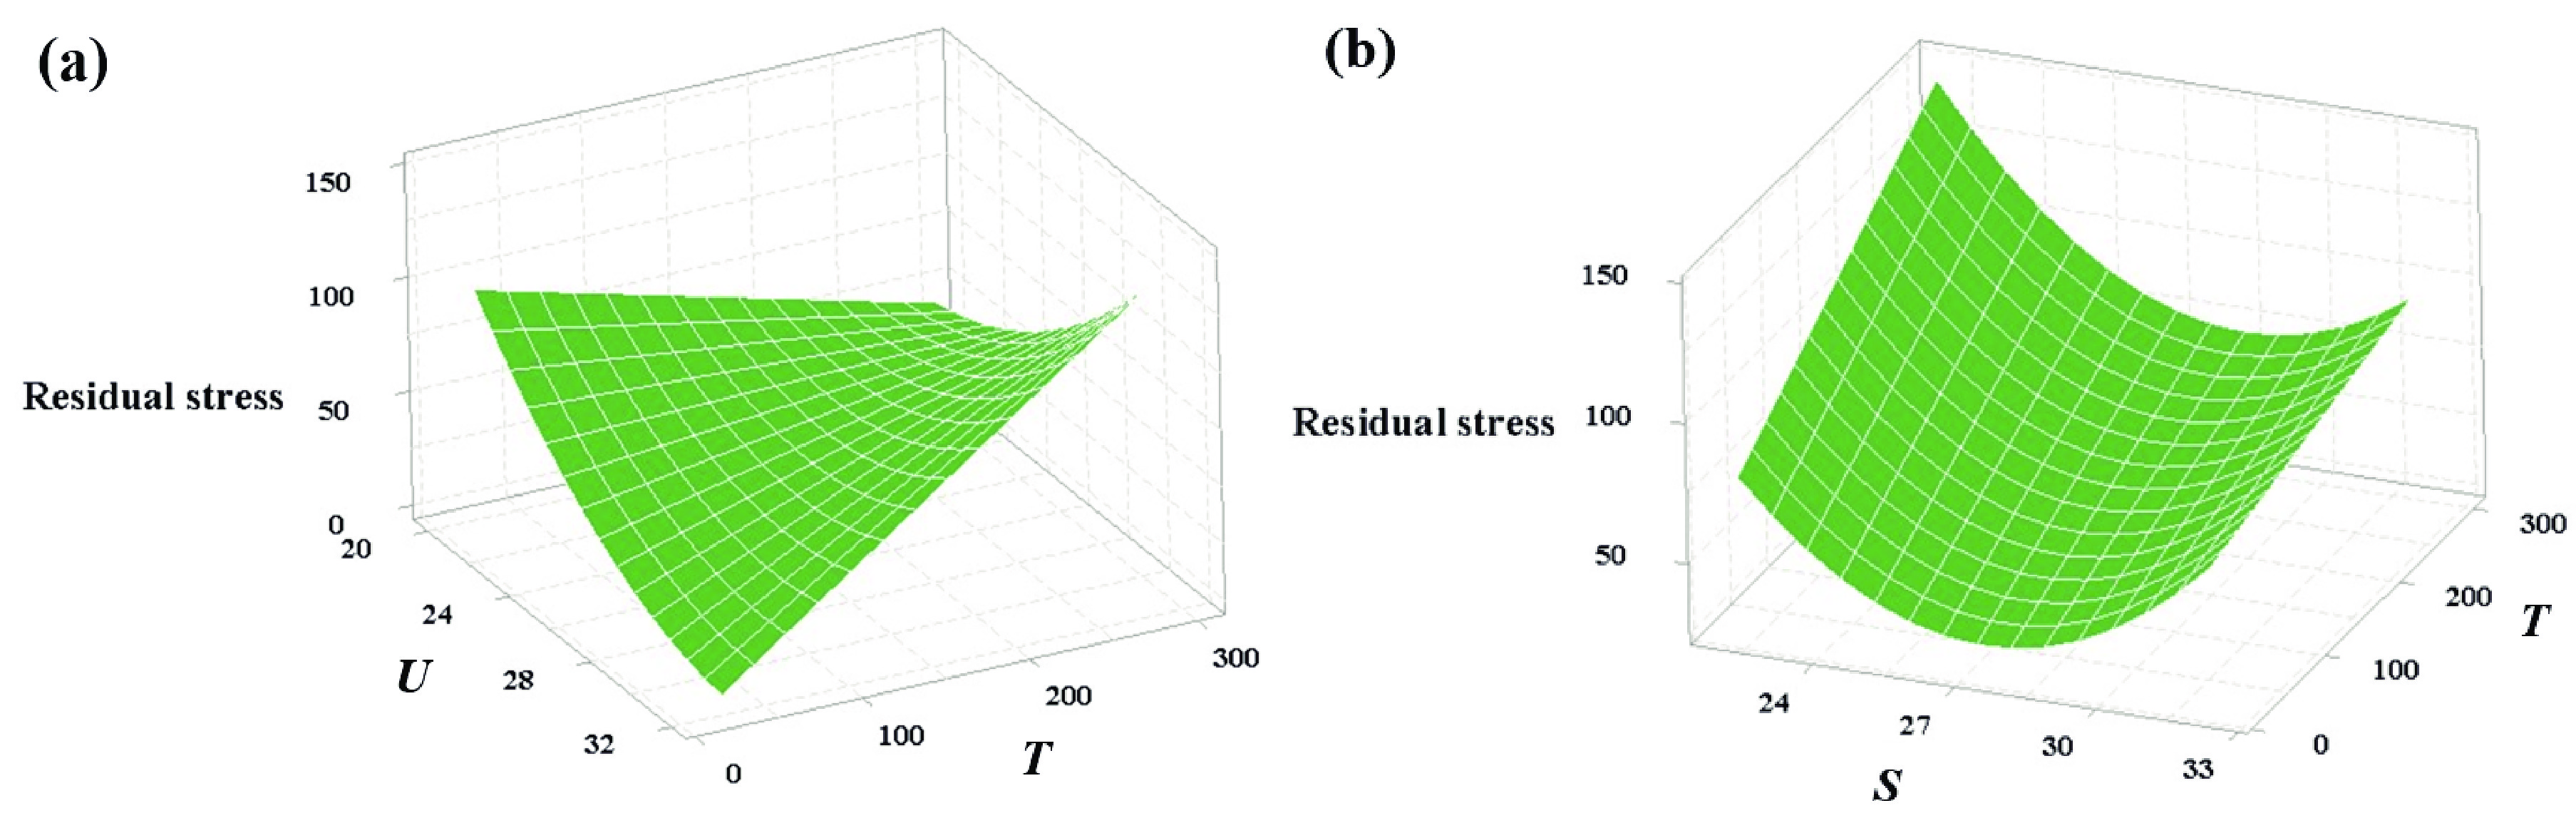
![]() Surface plots of (a) the residual stress, T, and U; (b) the residual stress, T, and S.
Surface plots of (a) the residual stress, T, and U; (b) the residual stress, T, and S.
-
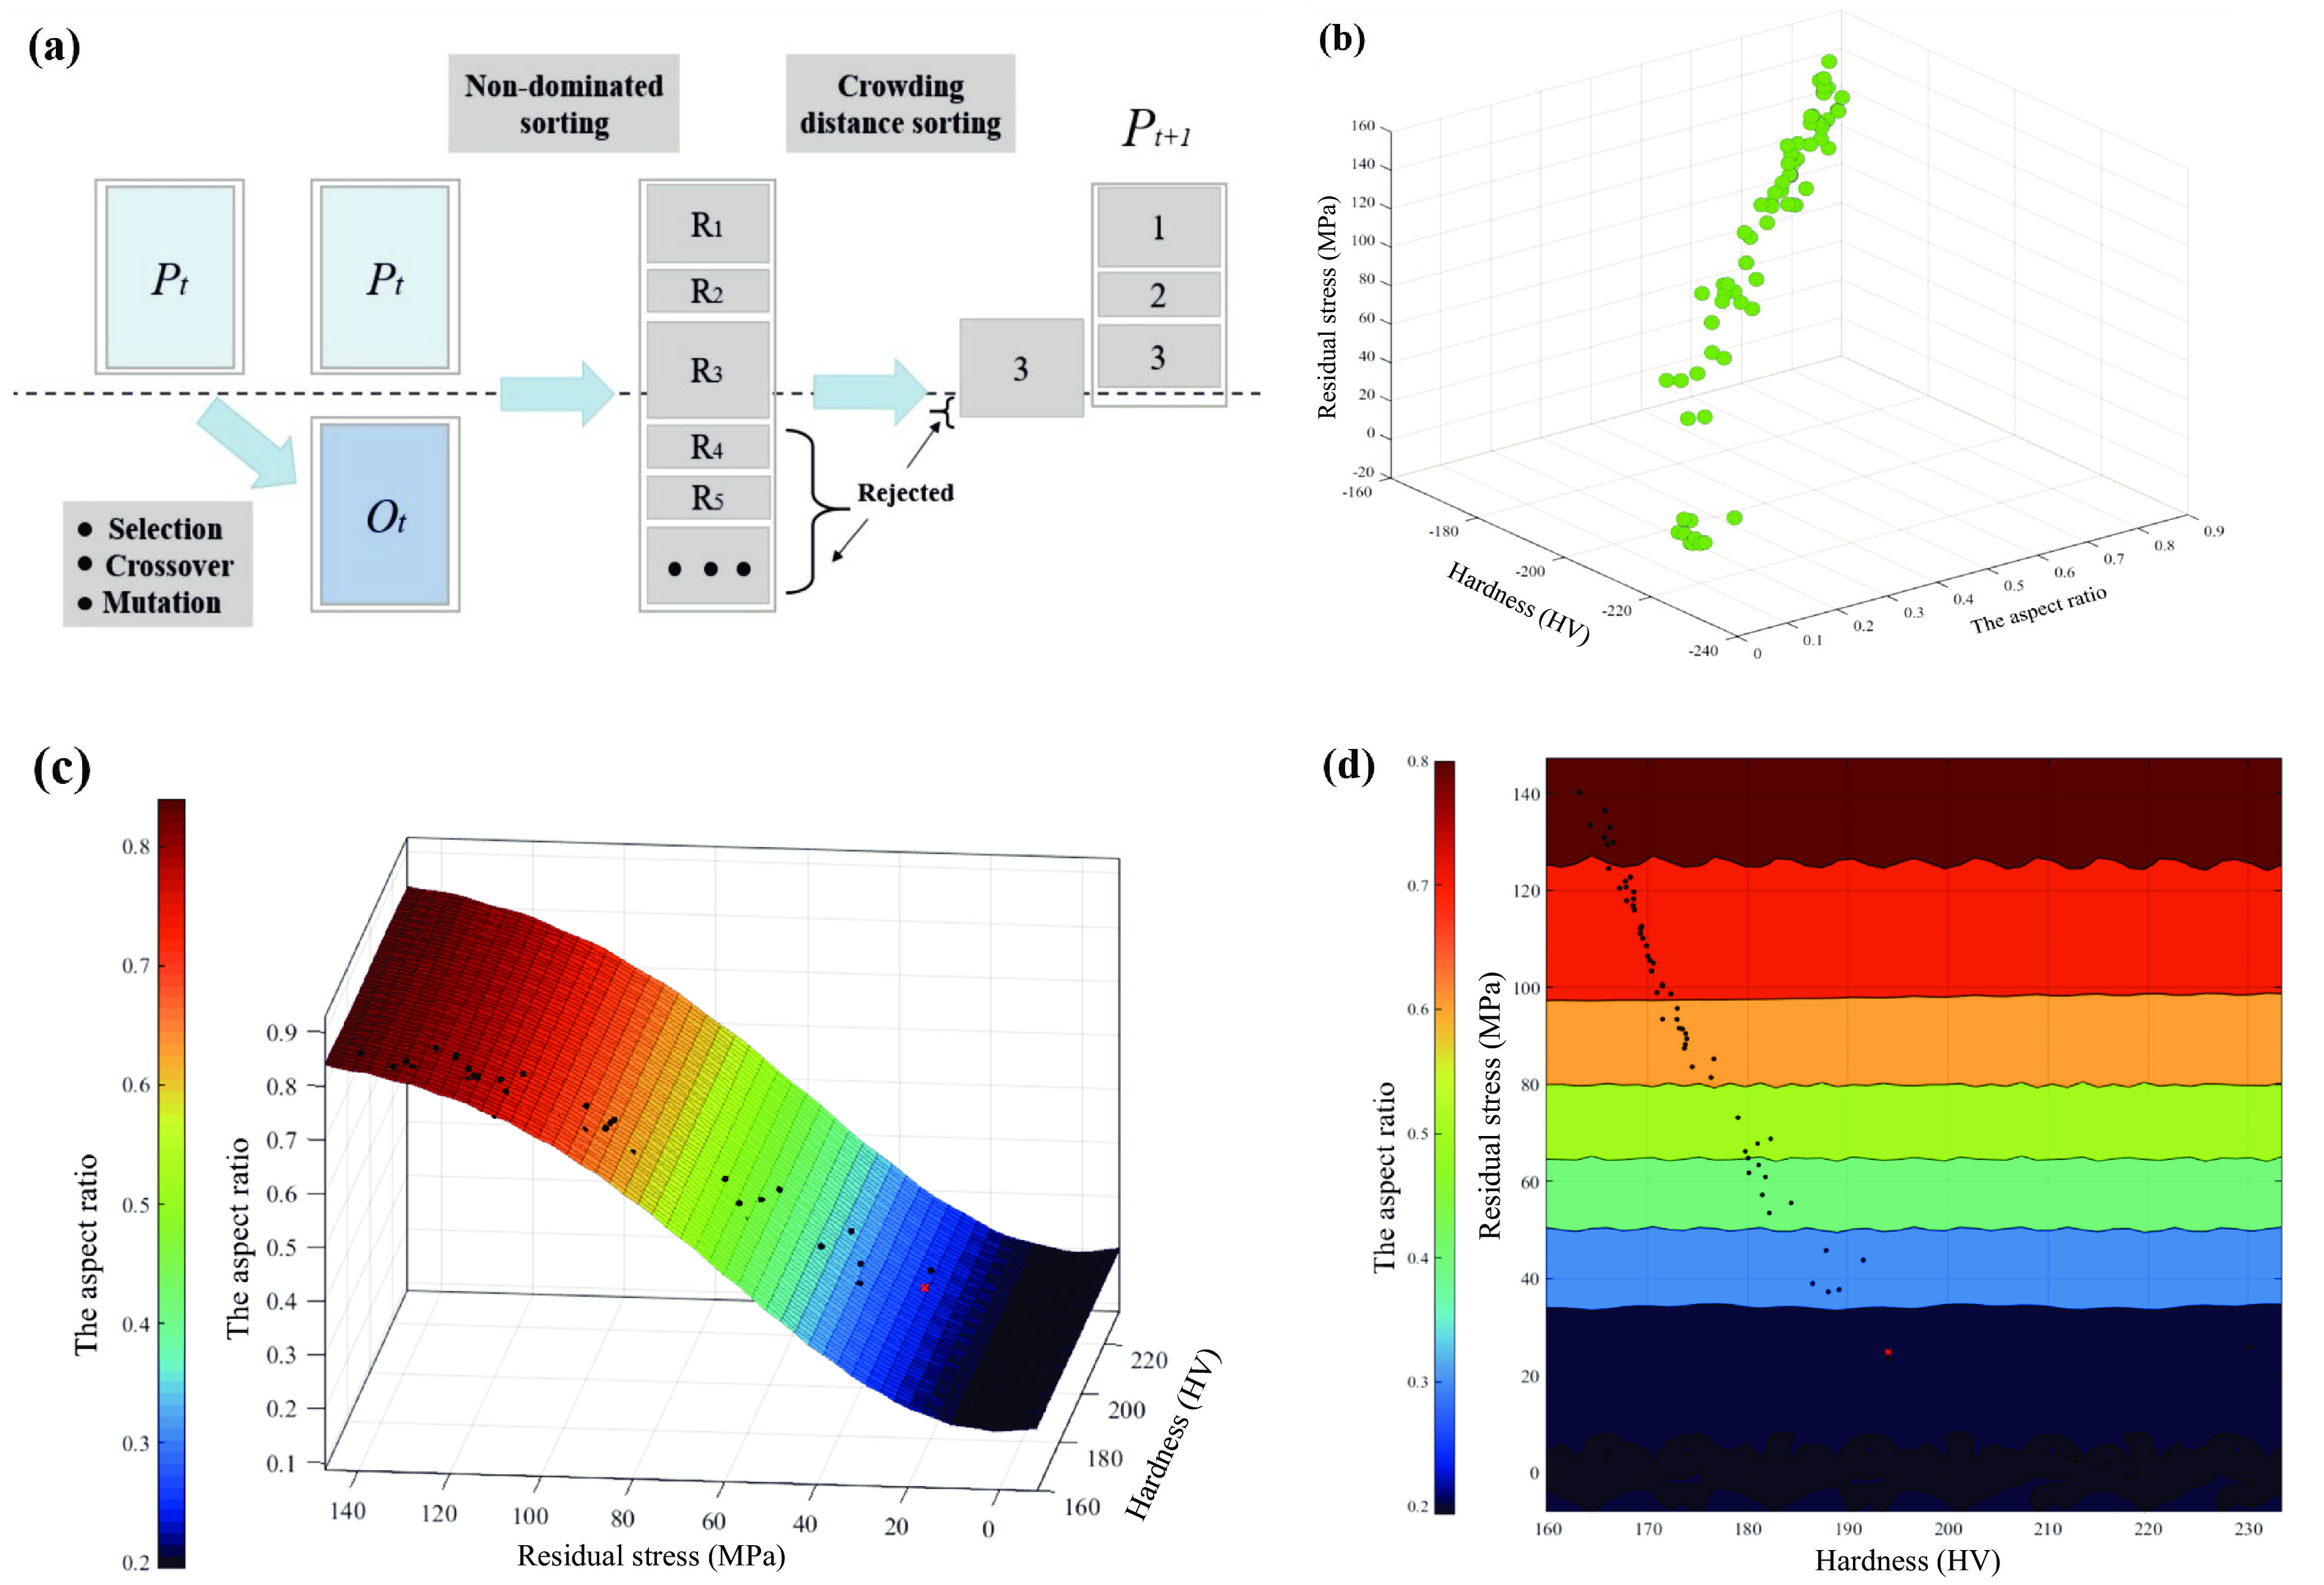
![]() (a) NGSA-Ⅱ flow chart, (b) Pareto frontier diagram, (c) Pareto optimal surface, and (d) contour plots.
(a) NGSA-Ⅱ flow chart, (b) Pareto frontier diagram, (c) Pareto optimal surface, and (d) contour plots.
-
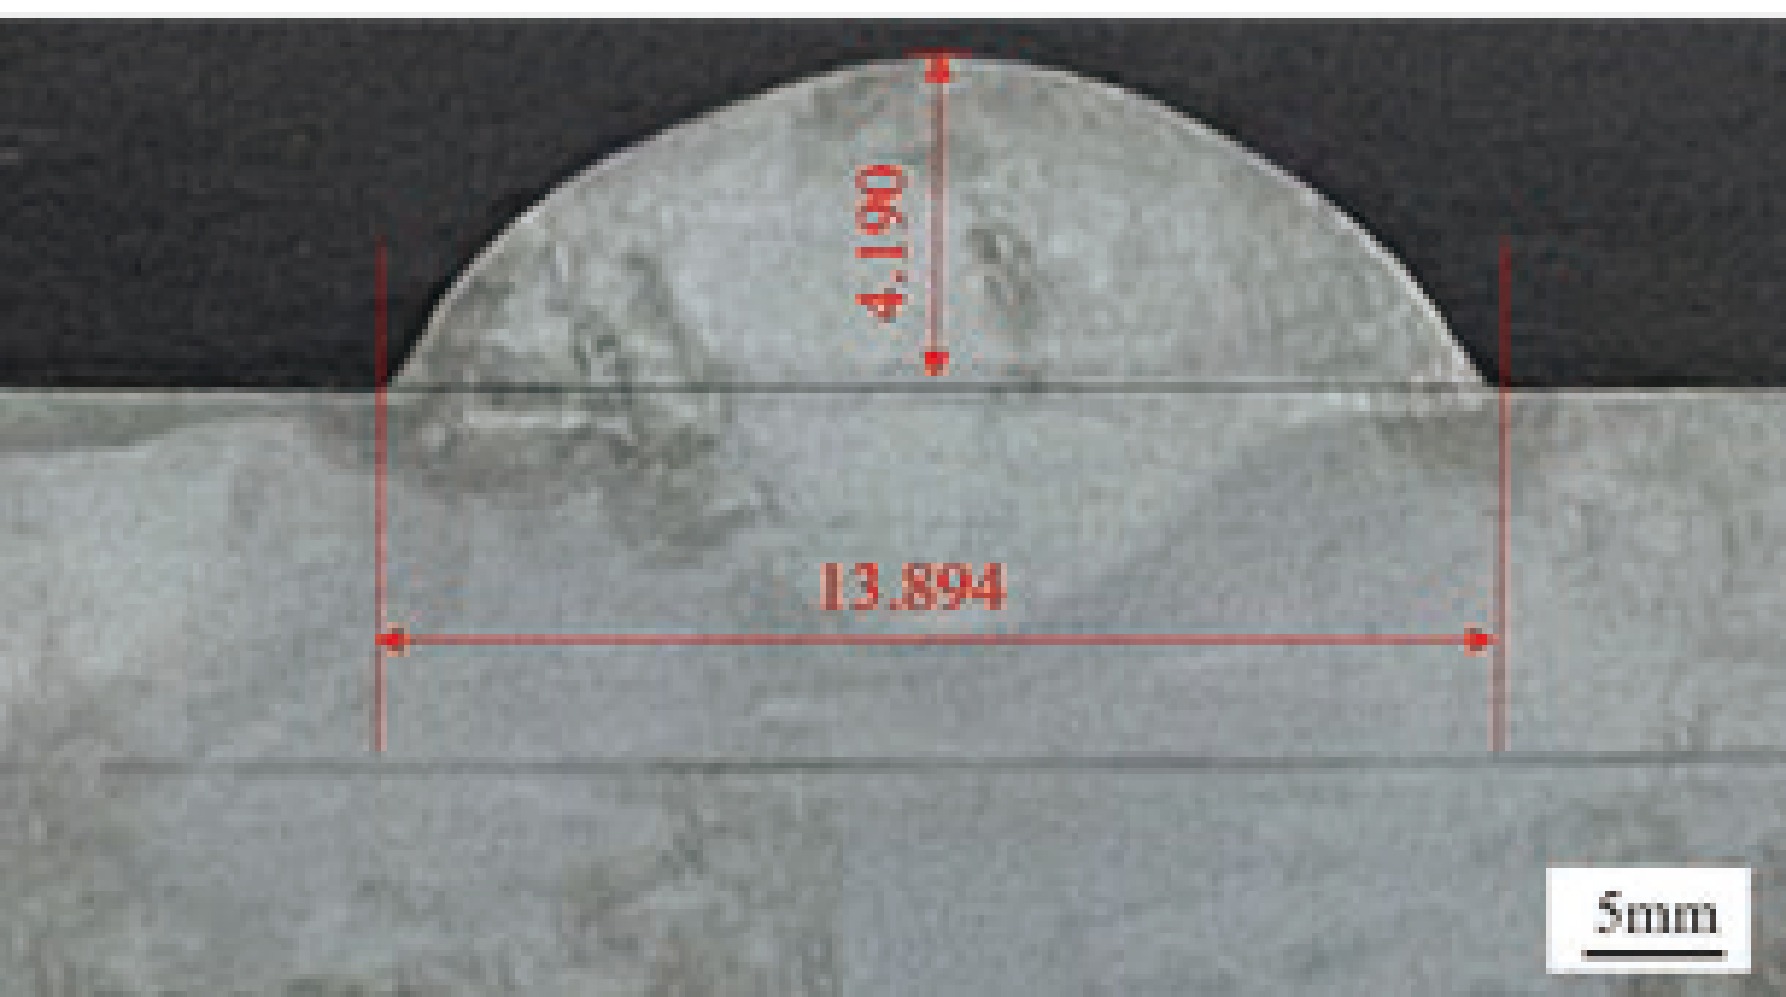
![]() Cross-sectional morphology of verification experiment.
Cross-sectional morphology of verification experiment.
-
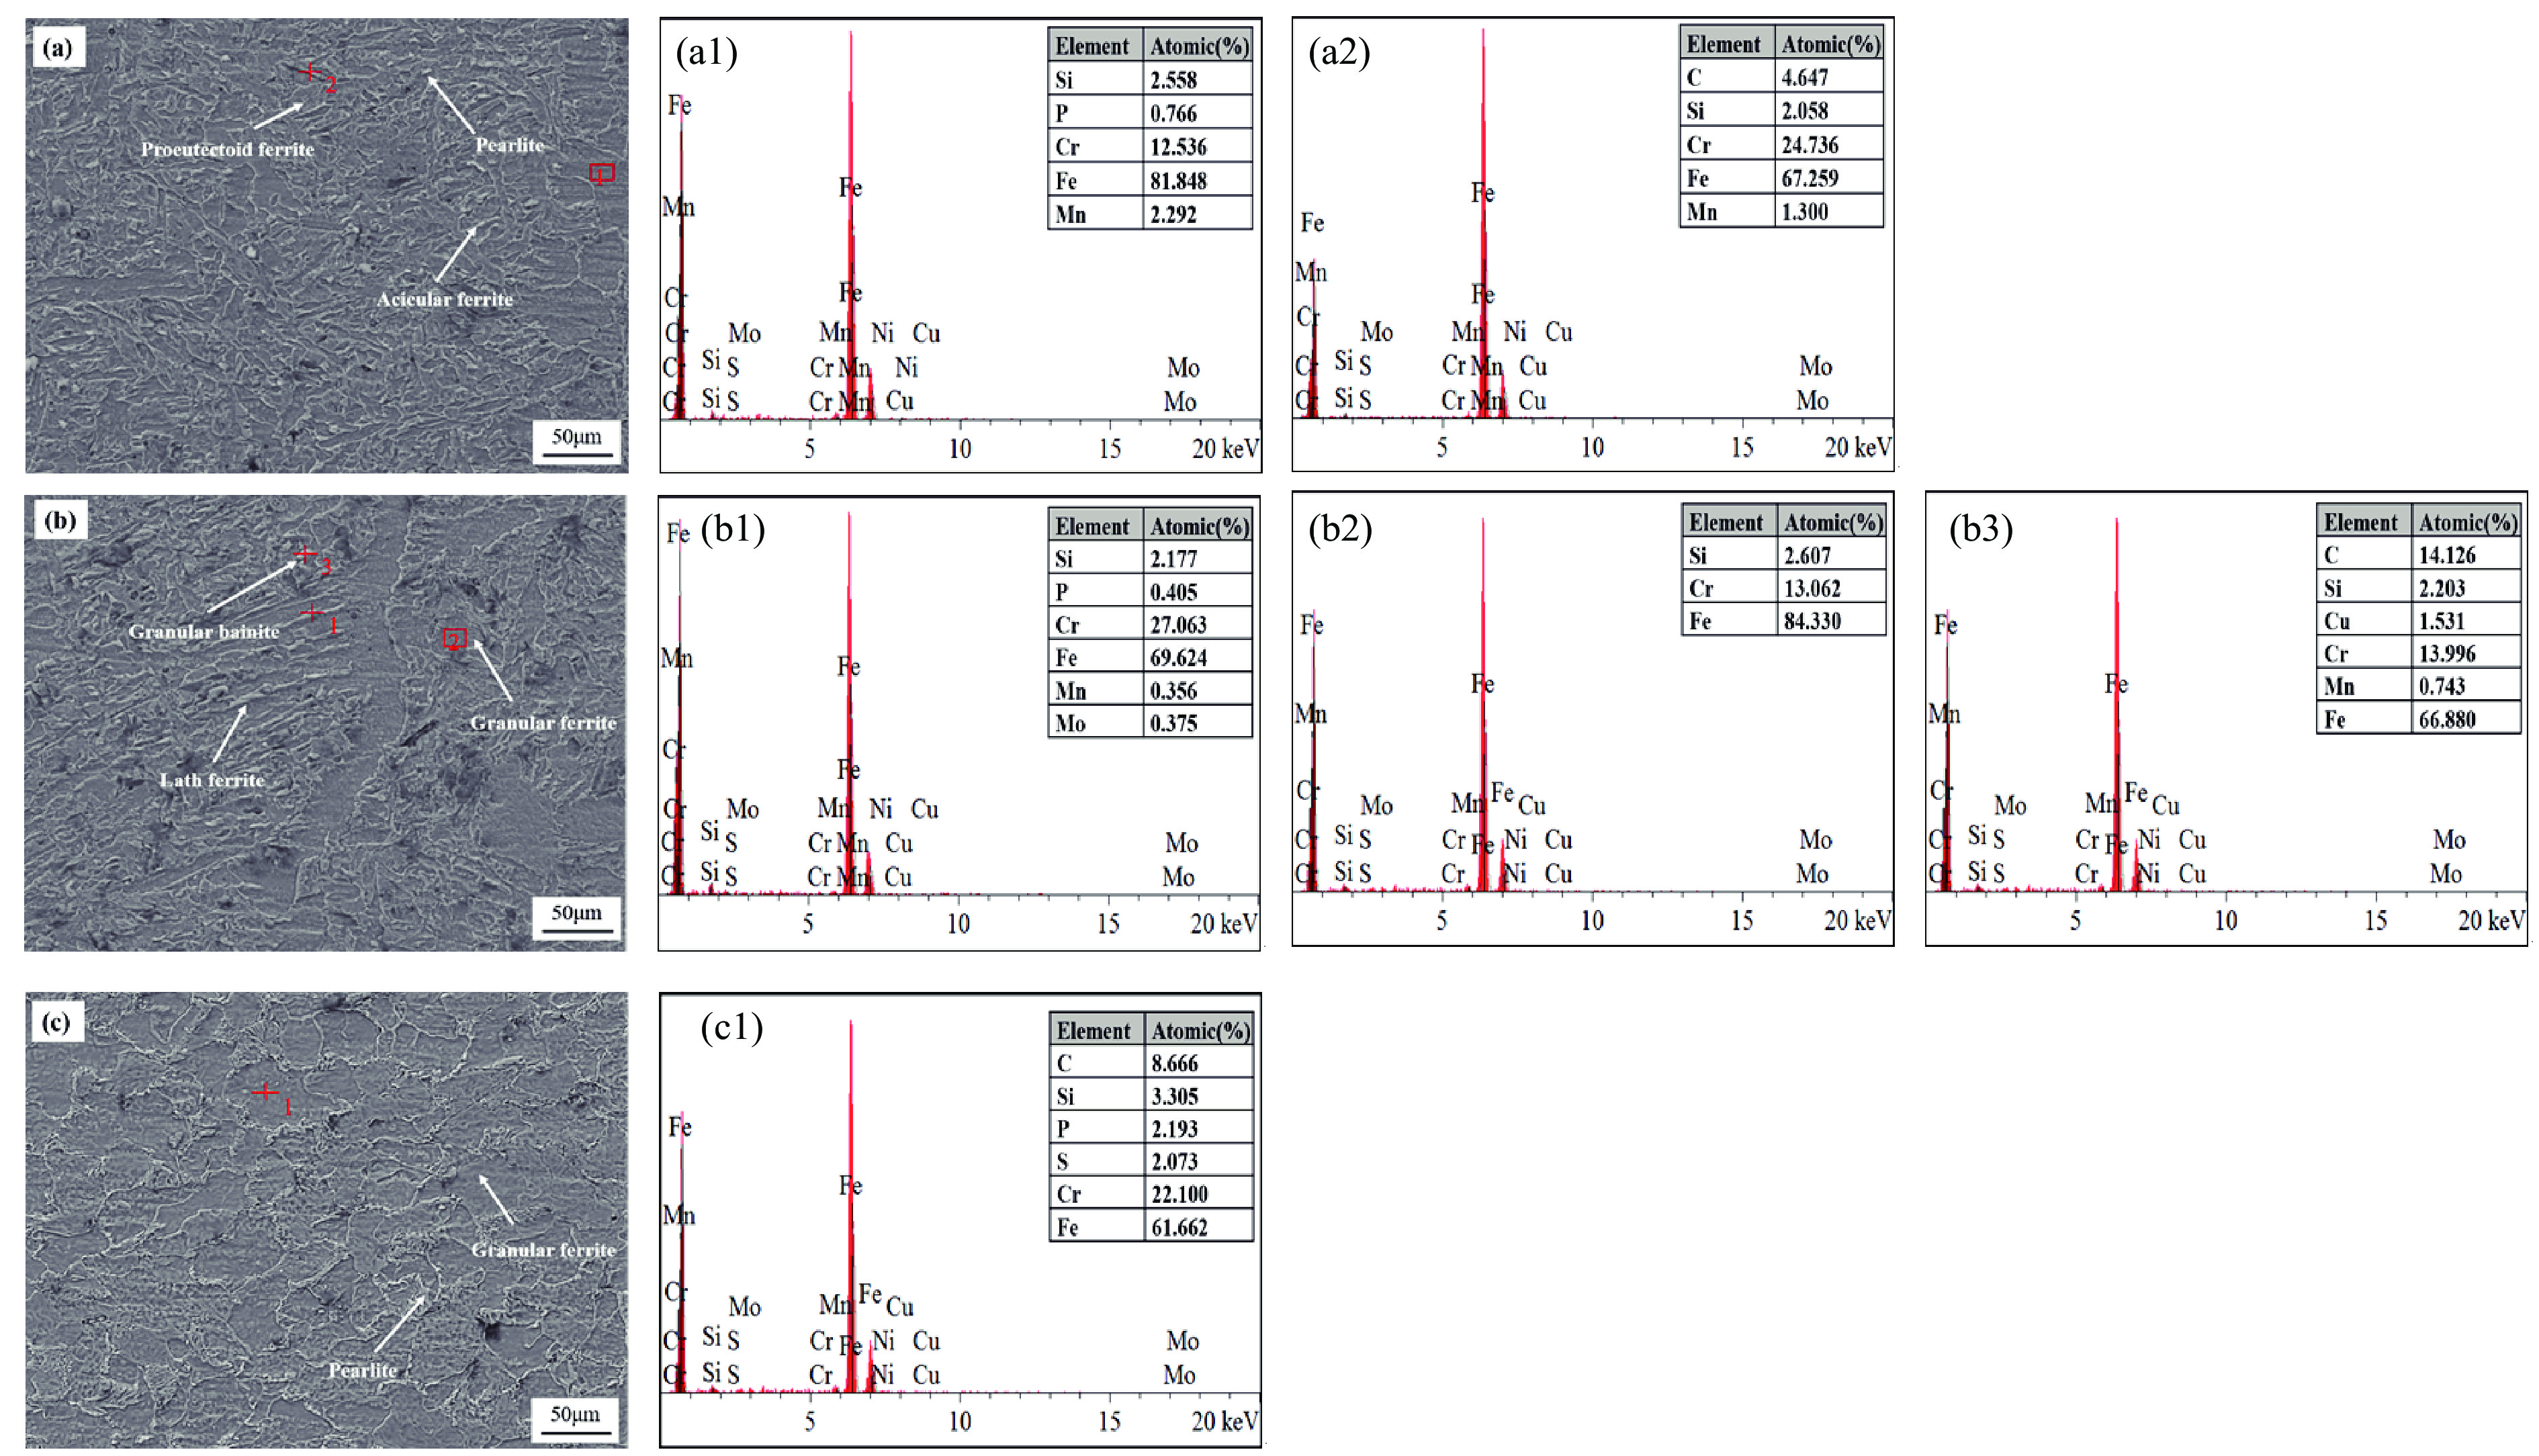
![]() Microstructure morphology and energy spectrum of welded joints (a) weld, (b) heat affected zone, and (c) base metal.
Microstructure morphology and energy spectrum of welded joints (a) weld, (b) heat affected zone, and (c) base metal.
Related articles
-
2024, 54(9): 0902. DOI: 10.52396/JUSTC-2024-0078
-
2021, 51(4): 327-334. DOI: 10.52396/JUST-2020-1156
-
2019, 49(10): 775-780. DOI: 10.3969/j.issn.0253-2778.2019.10.001
-
2019, 49(2): 125-131. DOI: 10.3969/j.issn.0253-2778.2019.02.007
-
2018, 48(1): 42-46. DOI: 10.3969/j.issn.0253-2778.2018.01.006
-
2016, 46(12): 1007. DOI: 10.3969/j.issn.0253-2778.2016.12.007
-
2016, 46(10): 845-852. DOI: 10.3969/j.issn.0253-2778.2016.10.008
-
2014, 44(10): 804-810. DOI: 10.3969/j.issn.0253-2778.2014.10.002
-
2014, 44(7): 612-617. DOI: 10.3969/j.issn.0253-2778.2014.07.011
-
2010, 40(4): 395-399. DOI: 10.3969/j.issn.0253-2778.2010.04.011
