
 Download:
Figures of the Article
-
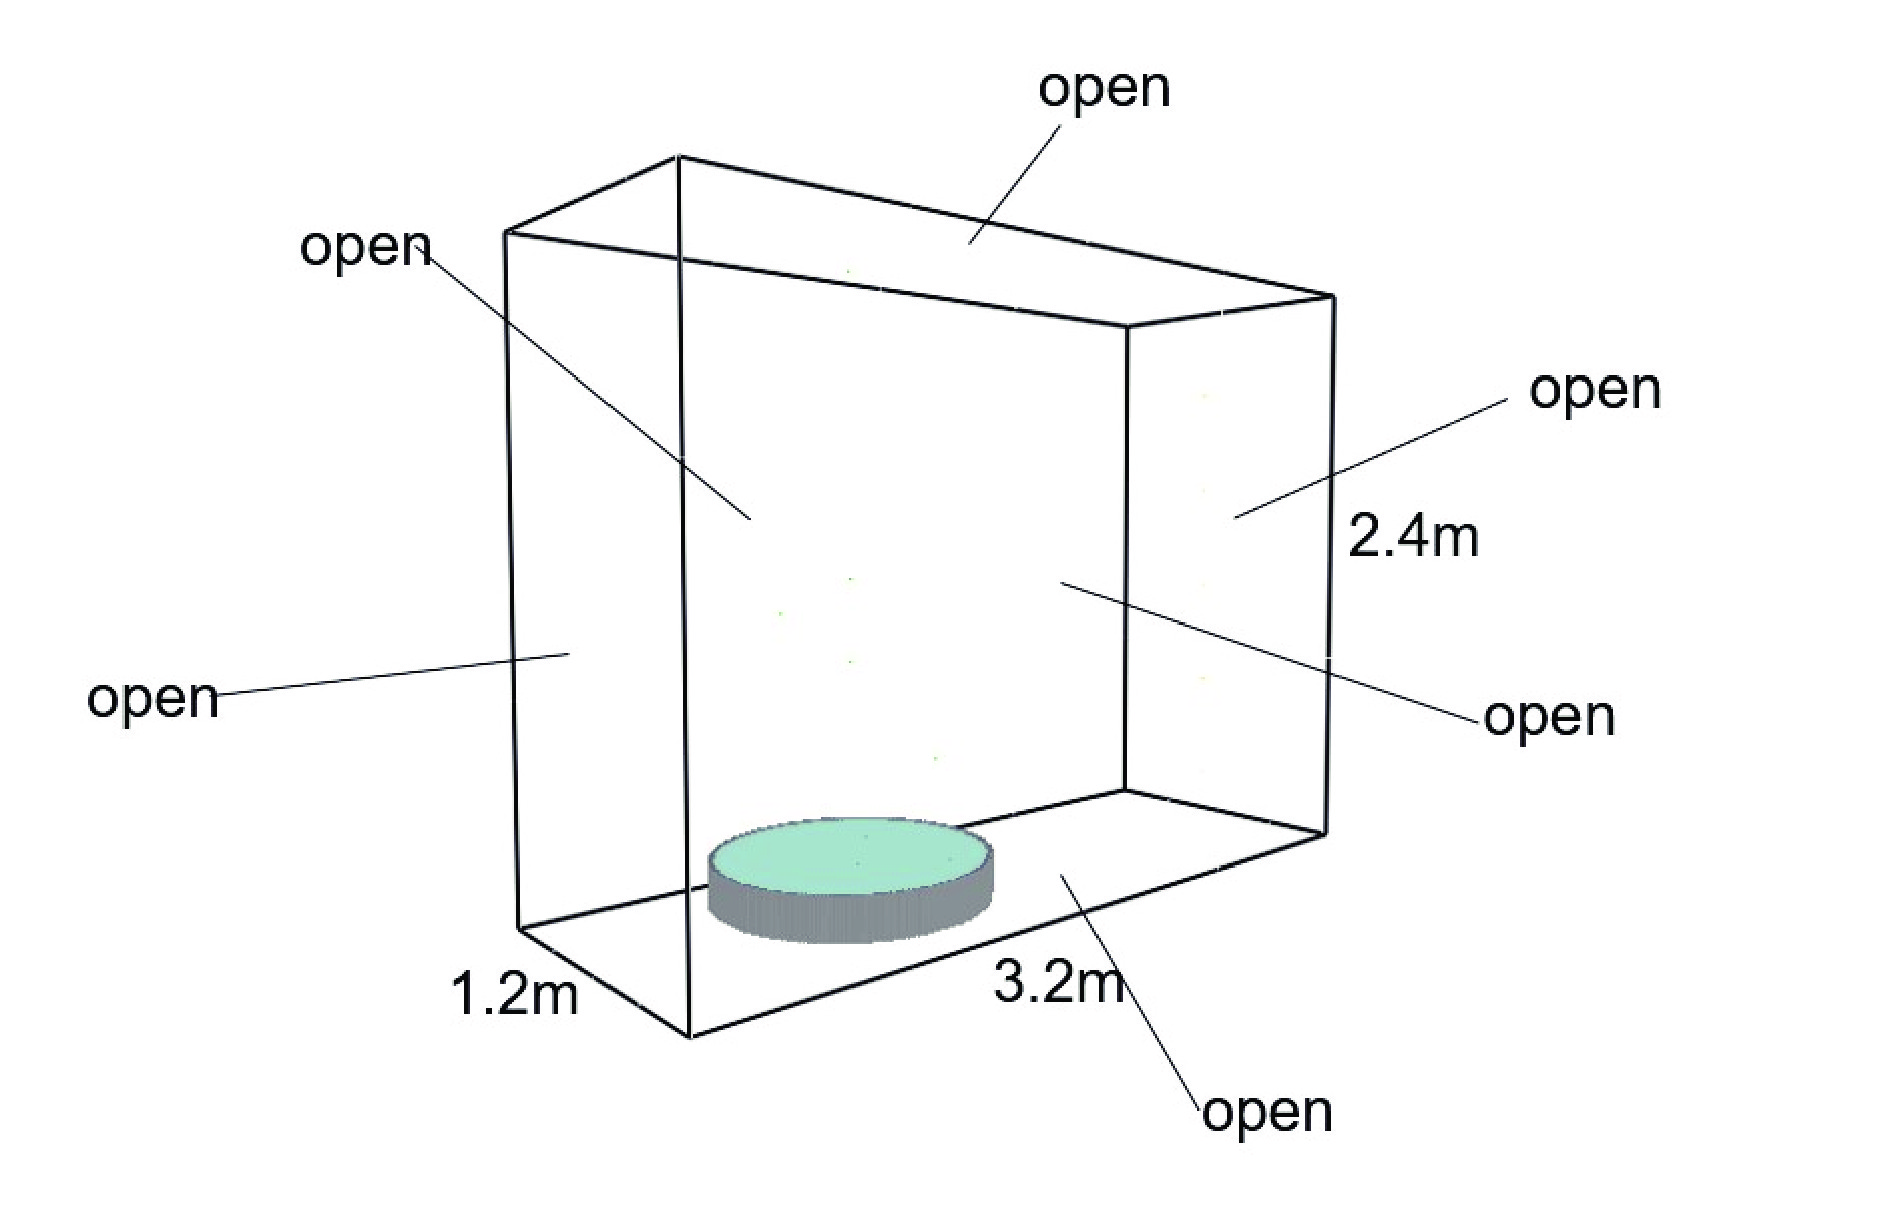
![]() Schematic diagram of the computational domain.
Schematic diagram of the computational domain.
-
![]() Validation of the results of 1D RTE calculations for the newly coupled radiation models.
Validation of the results of 1D RTE calculations for the newly coupled radiation models.
-
![]() Temperature distribution along the central axis of the pool fire.
Temperature distribution along the central axis of the pool fire.
-
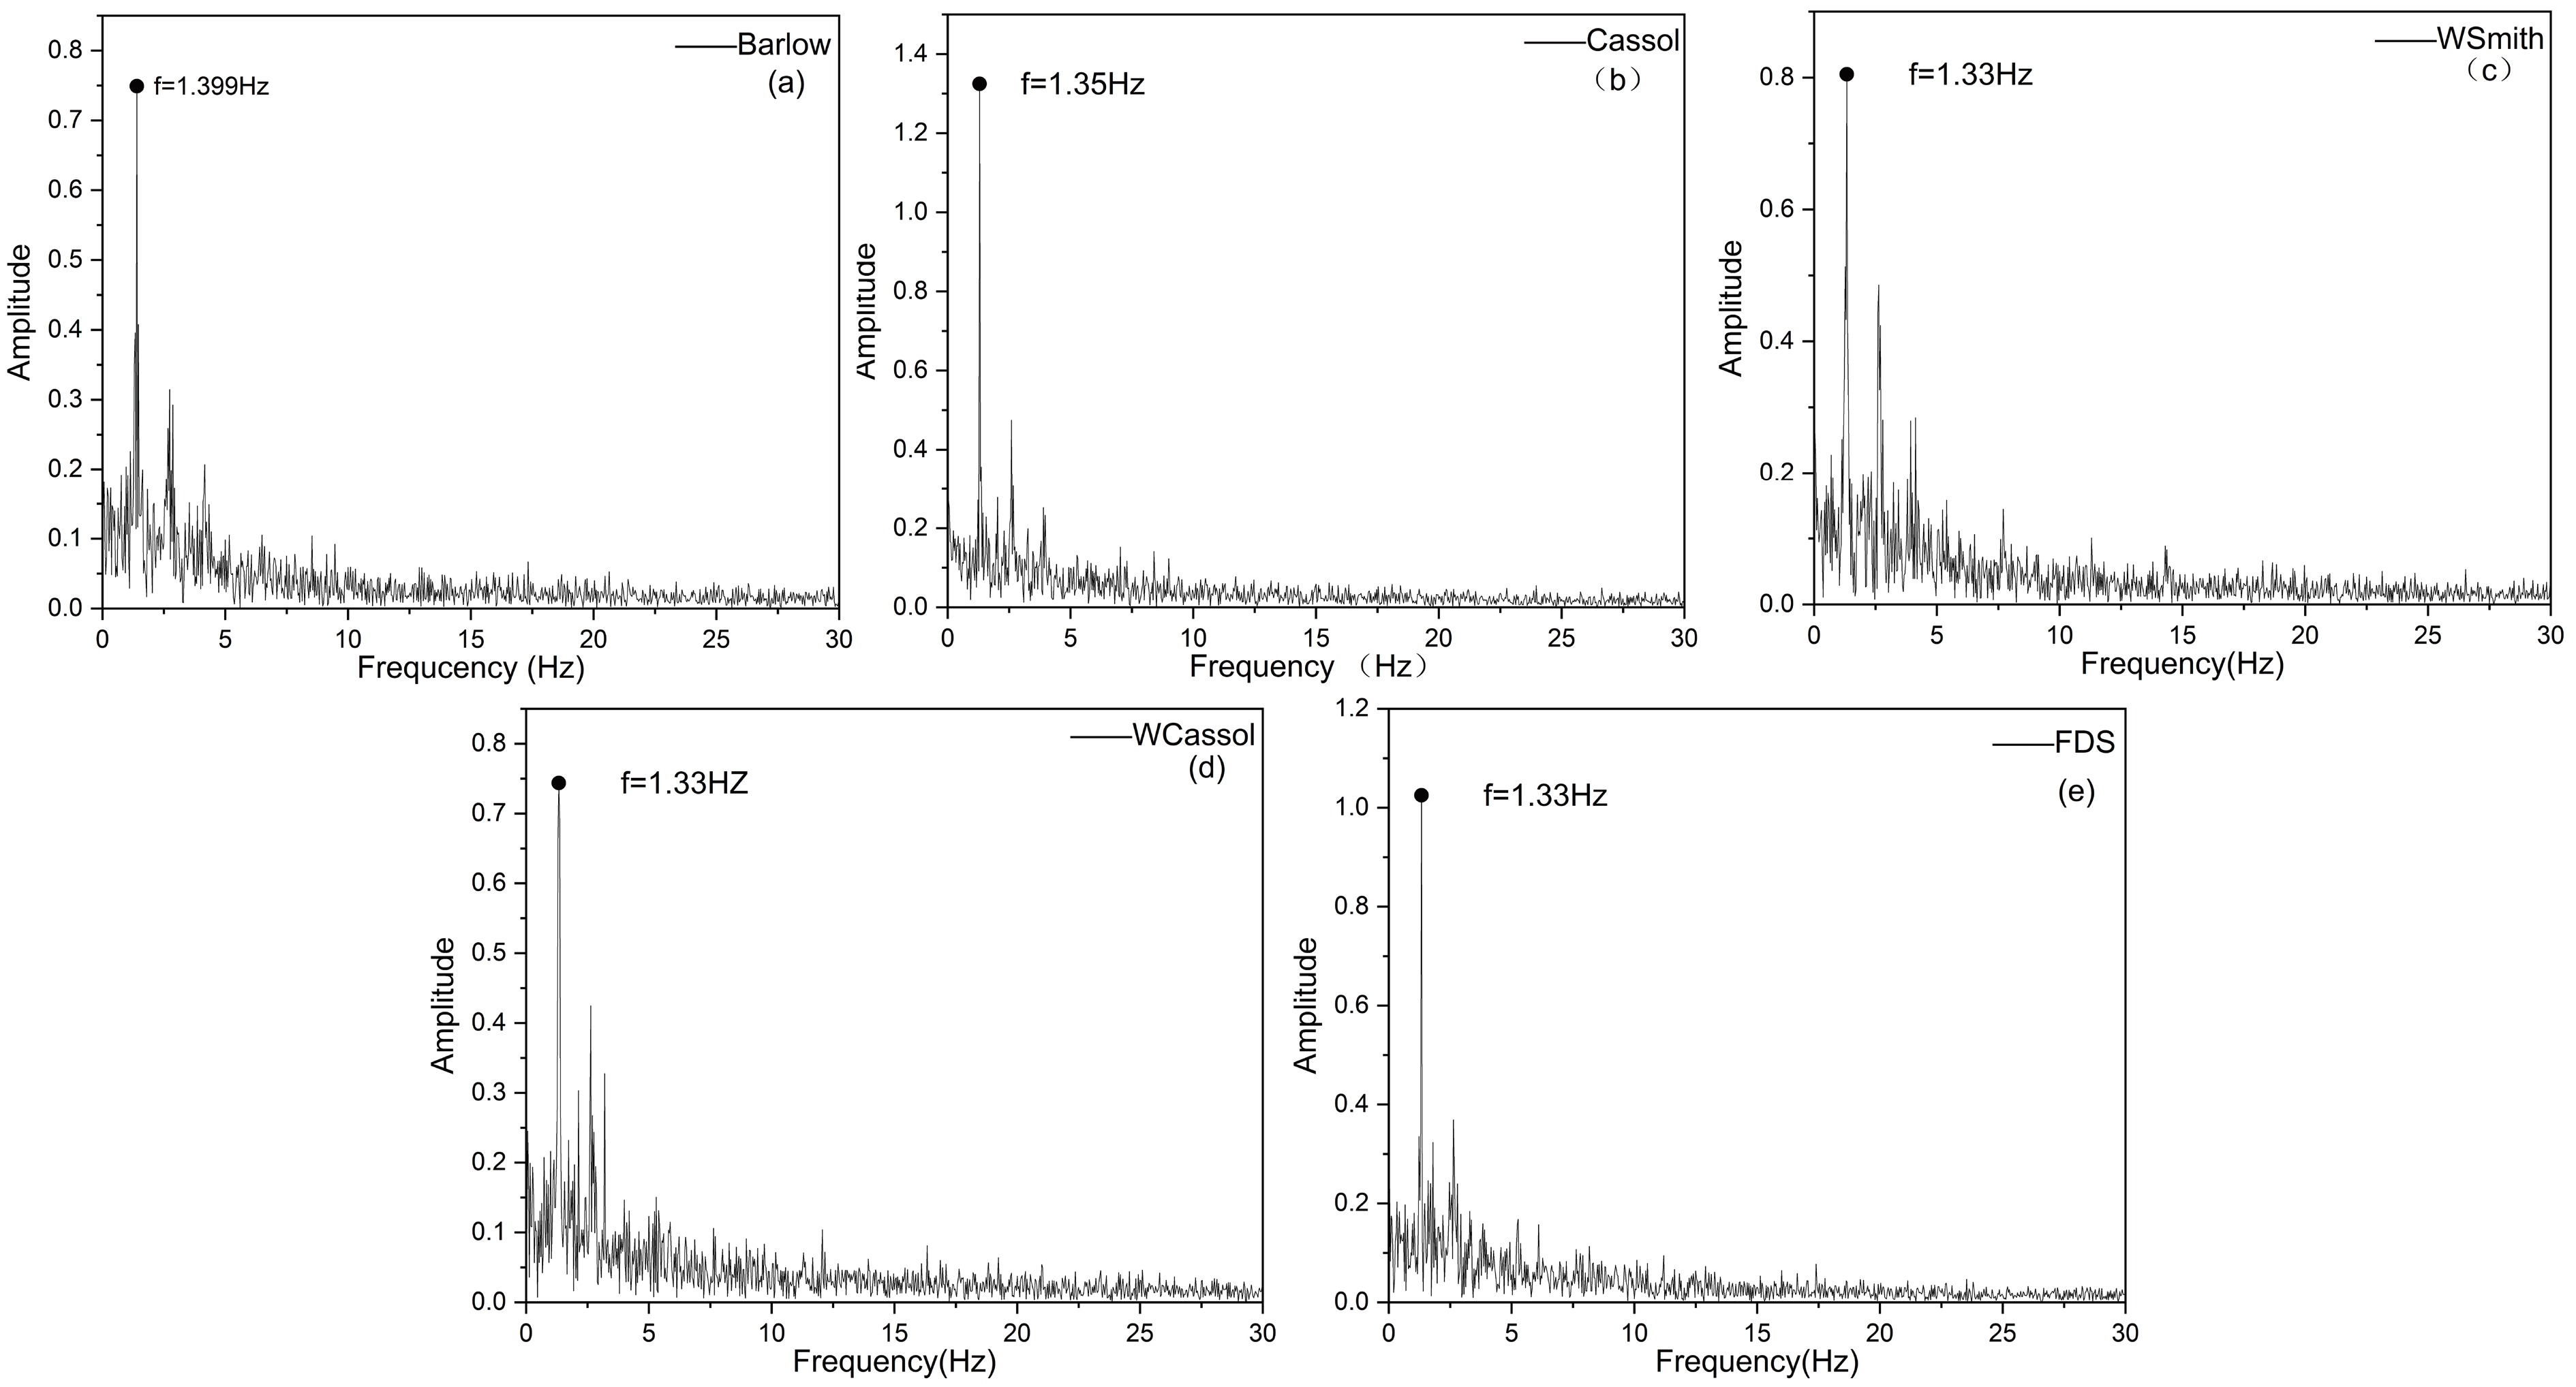
![]() Frequency amplitude plots of velocities under different radiation models: (a) Barlow model, (b) Cassol model, (c) WSmith model, (d) WCassol model, and (e) FDS model, respectively.
Frequency amplitude plots of velocities under different radiation models: (a) Barlow model, (b) Cassol model, (c) WSmith model, (d) WCassol model, and (e) FDS model, respectively.
-
![]() Transient velocity vector, temperature, radiation heat flux (Qr), absorption coefficient (κp), and concentrations of H2O and CO2 predicted by different radiation models.
Transient velocity vector, temperature, radiation heat flux (Qr), absorption coefficient (κp), and concentrations of H2O and CO2 predicted by different radiation models.
-
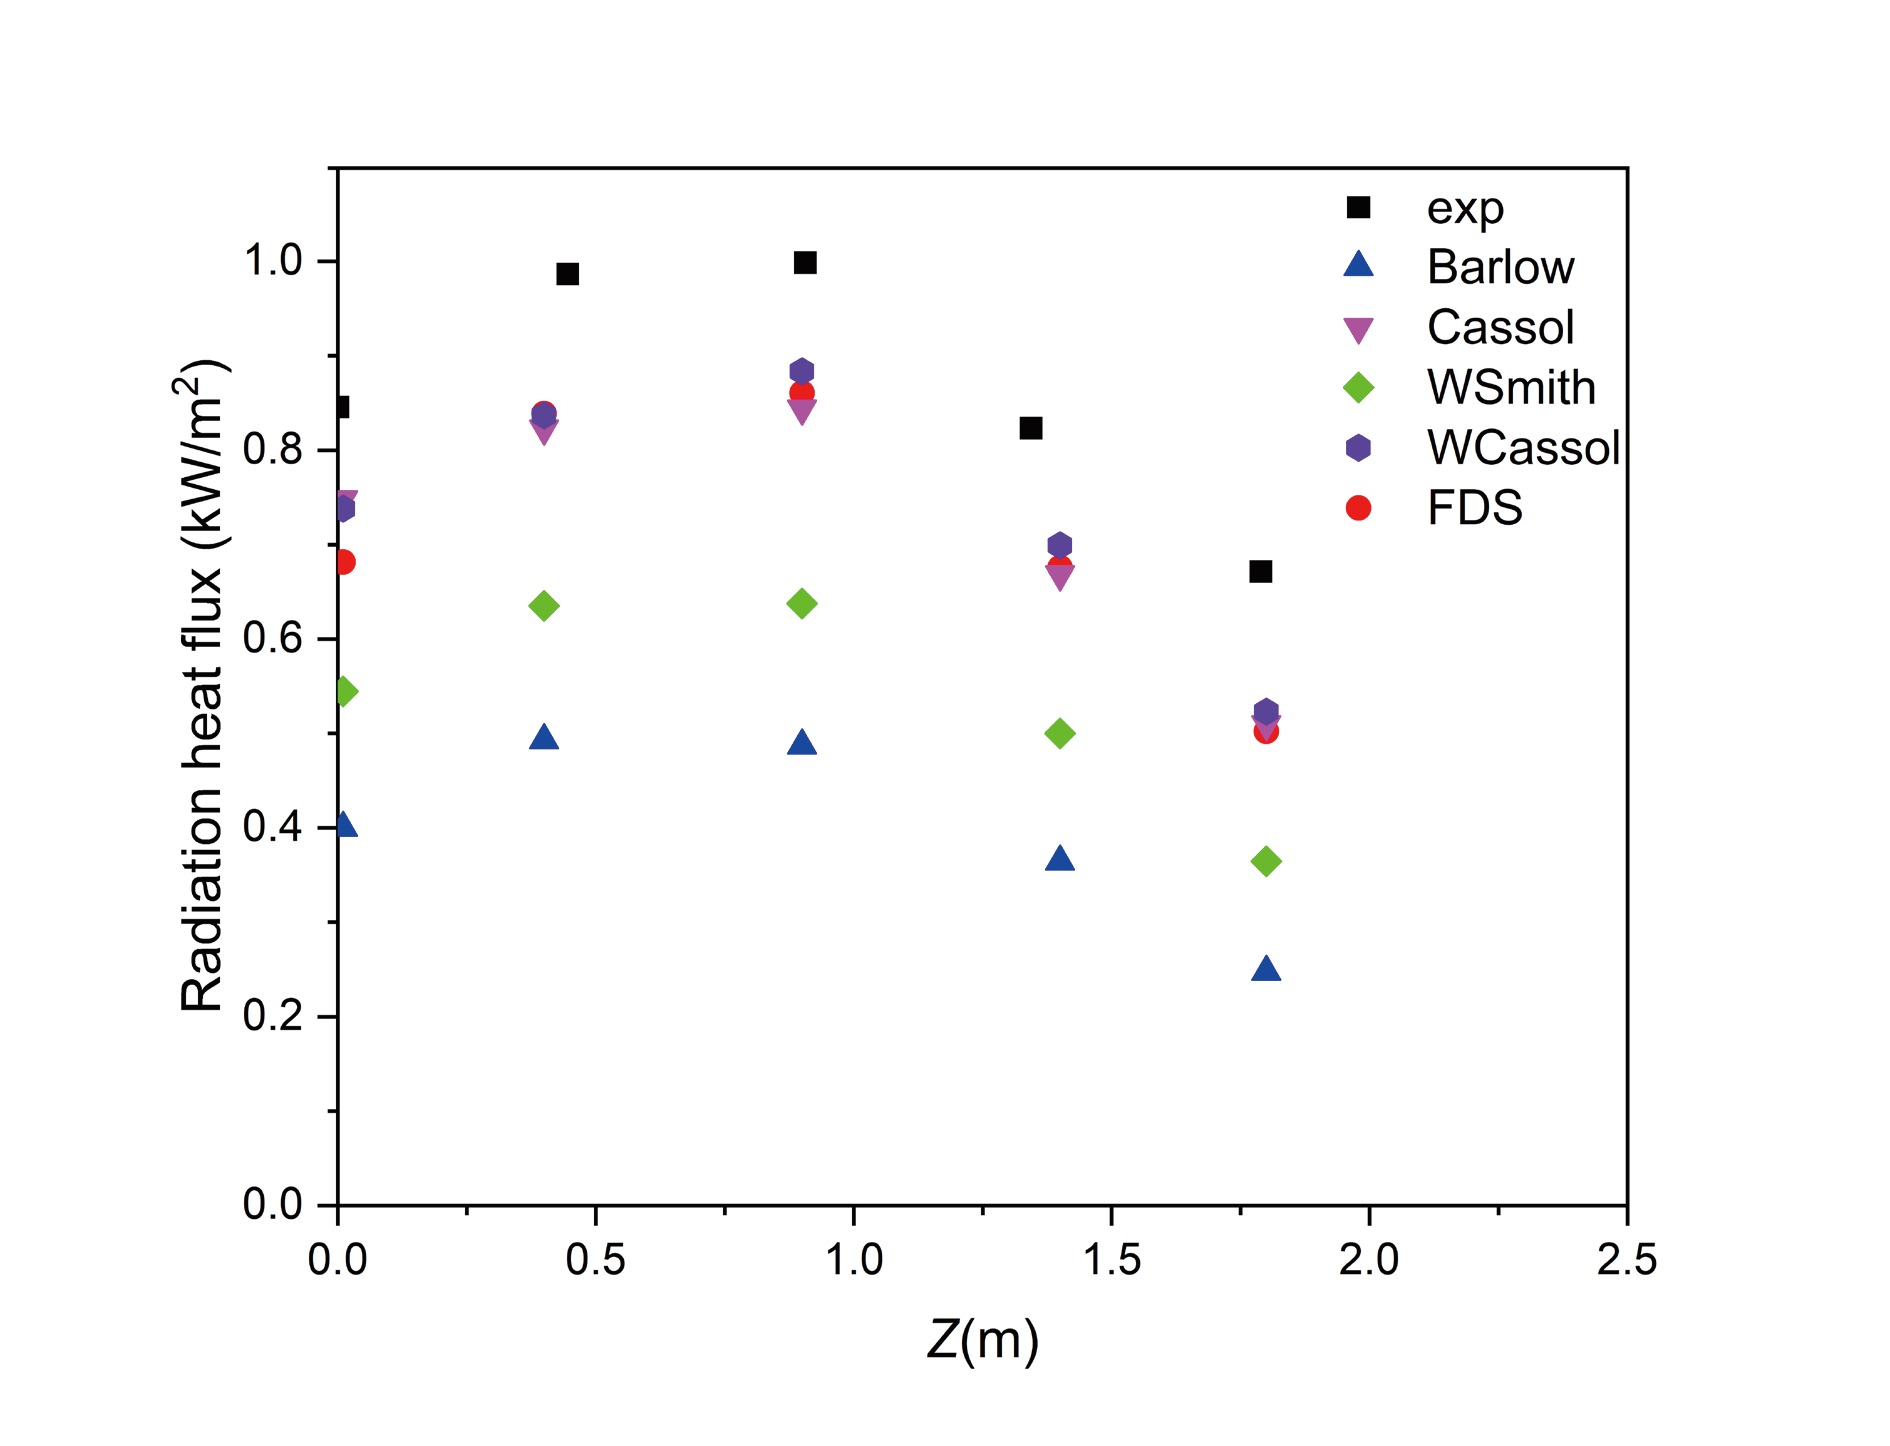
![]() Vertical distribution of radiation flux at 2.8 m from the center of the pool.
Vertical distribution of radiation flux at 2.8 m from the center of the pool.


Related articles
-
2023, 53(11): 1104. DOI: 10.52396/JUSTC-2023-0082
-
2021, 51(1): 75-86. DOI: 10.52396/JUST-2020-1140
-
2021, 51(1): 65-74. DOI: 10.52396/JUST-2021-0012
-
2020, 50(5): 654-668. DOI: 10.3969/j.issn.0253-2778.2020.05.013
-
2018, 48(11): 906-922. DOI: 10.3969/j.issn.0253-2778.2018.11.007
-
2018, 48(3): 236-245. DOI: 10.3969/j.issn.0253-2778.2018.03.008
-
2017, 47(5): 435-442. DOI: 10.3969/j.issn.0253-2778.2017.05.009
-
2015, 45(2): 159-167. DOI: 10.3969/j.issn.0253-2778.2015.02.010
-
2014, 44(7): 599-604. DOI: 10.3969/j.issn.0253-2778.2014.07.009
