Figure
1.
Model structure.
Indicator selection has been a compelling problem in data envelopment analysis. With the advent of the big data era, scholars are faced with more complex indicator selection situations. The boom in machine learning presents an opportunity to address this problem. However, poor quality indicators may be selected if inappropriate methods are used in overfitting or underfitting scenarios. To date, some scholars have pioneered the use of the least absolute shrinkage and selection operator to select indicators in overfitting scenarios, but researchers have not proposed classifying the big data scenarios encountered by DEA into overfitting and underfitting scenarios, nor have they attempted to develop a complete indicator selection system for both scenarios. To fill these research gaps, this study employs machine learning methods and proposes a mean score approach based on them. Our Monte Carlo simulations show that the least absolute shrinkage and selection operator dominates in overfitting scenarios but fails to select good indicators in underfitting scenarios, while the ensemble methods are superior in underfitting scenarios, and the proposed mean approach performs well in both scenarios. Based on the strengths and limitations of the different methods, a smart indicator selection mechanism is proposed to facilitate the selection of DEA indicators.
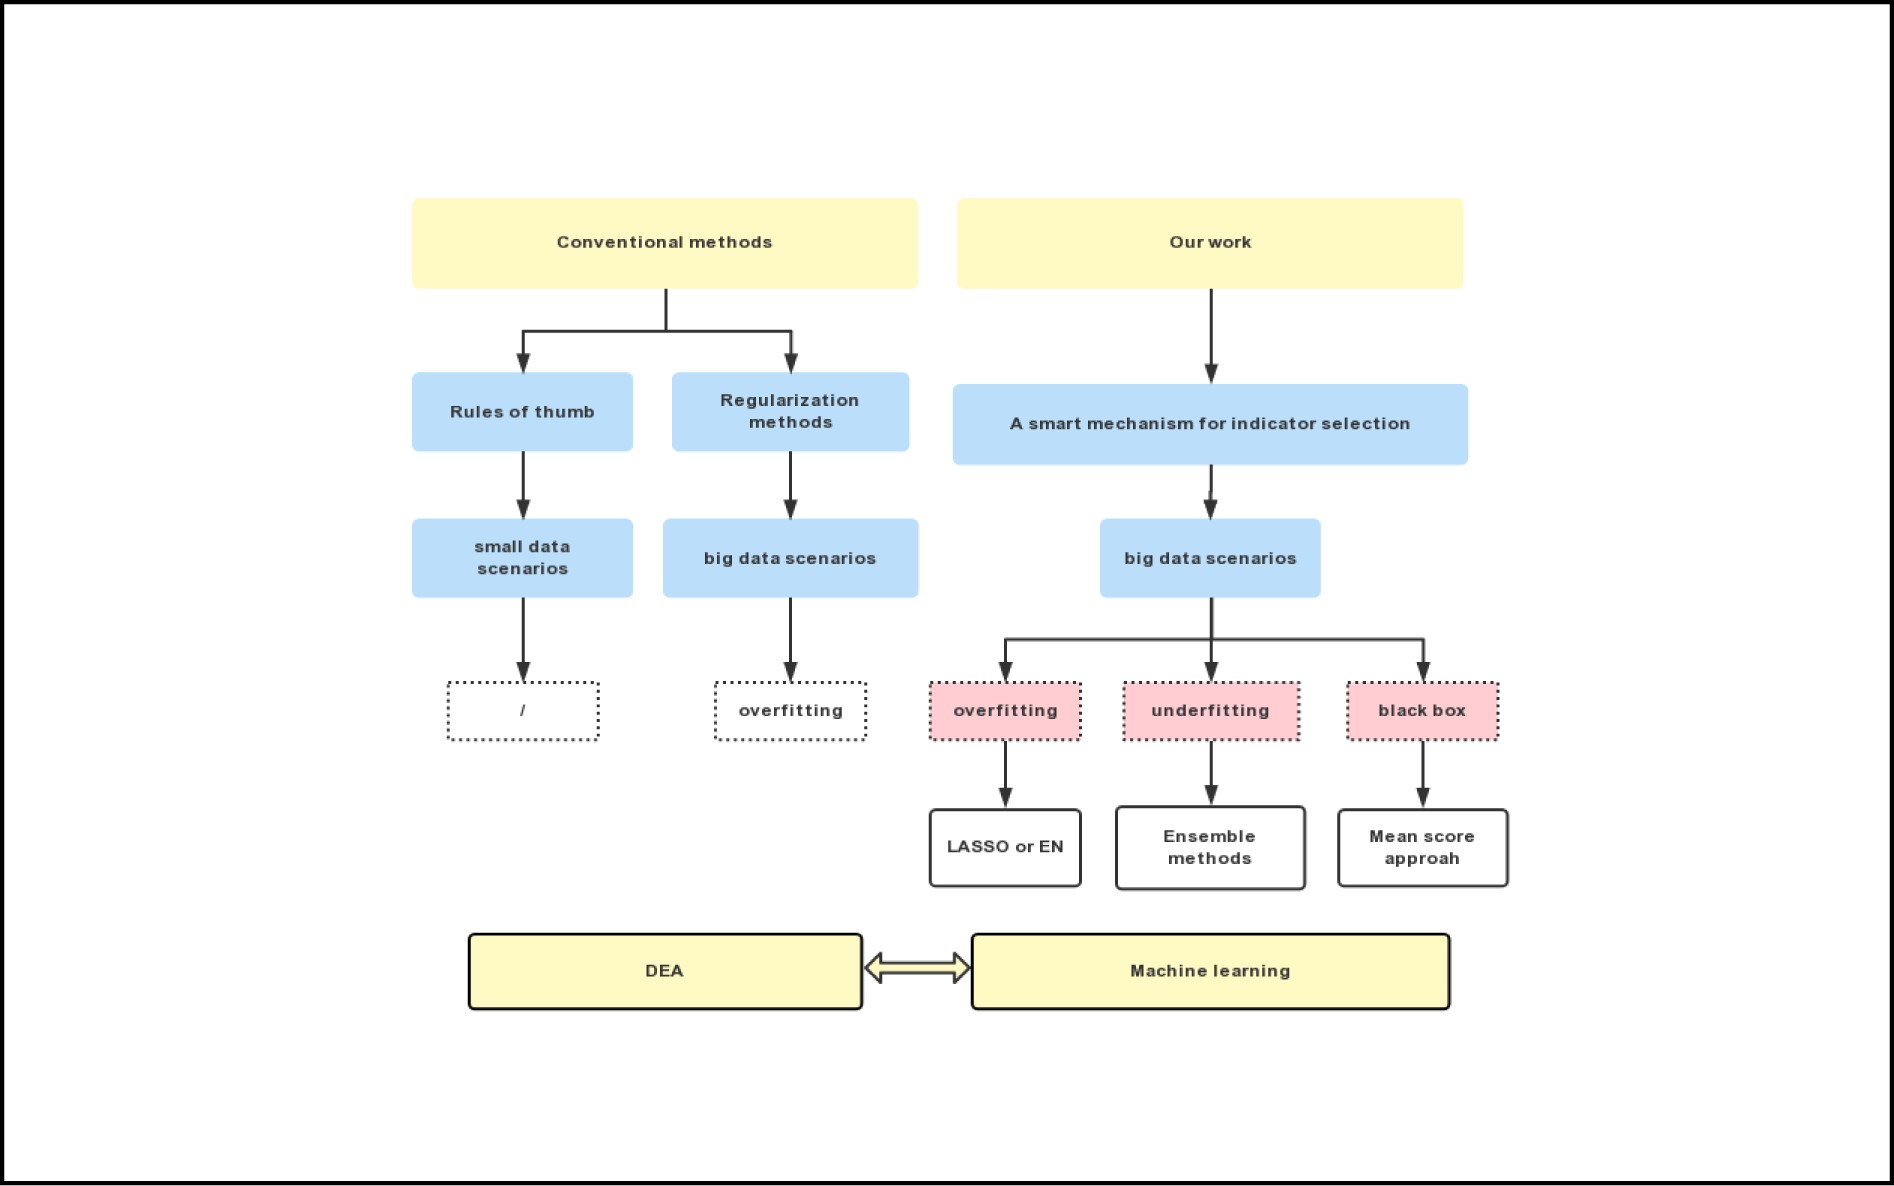
The overall framework of our research.
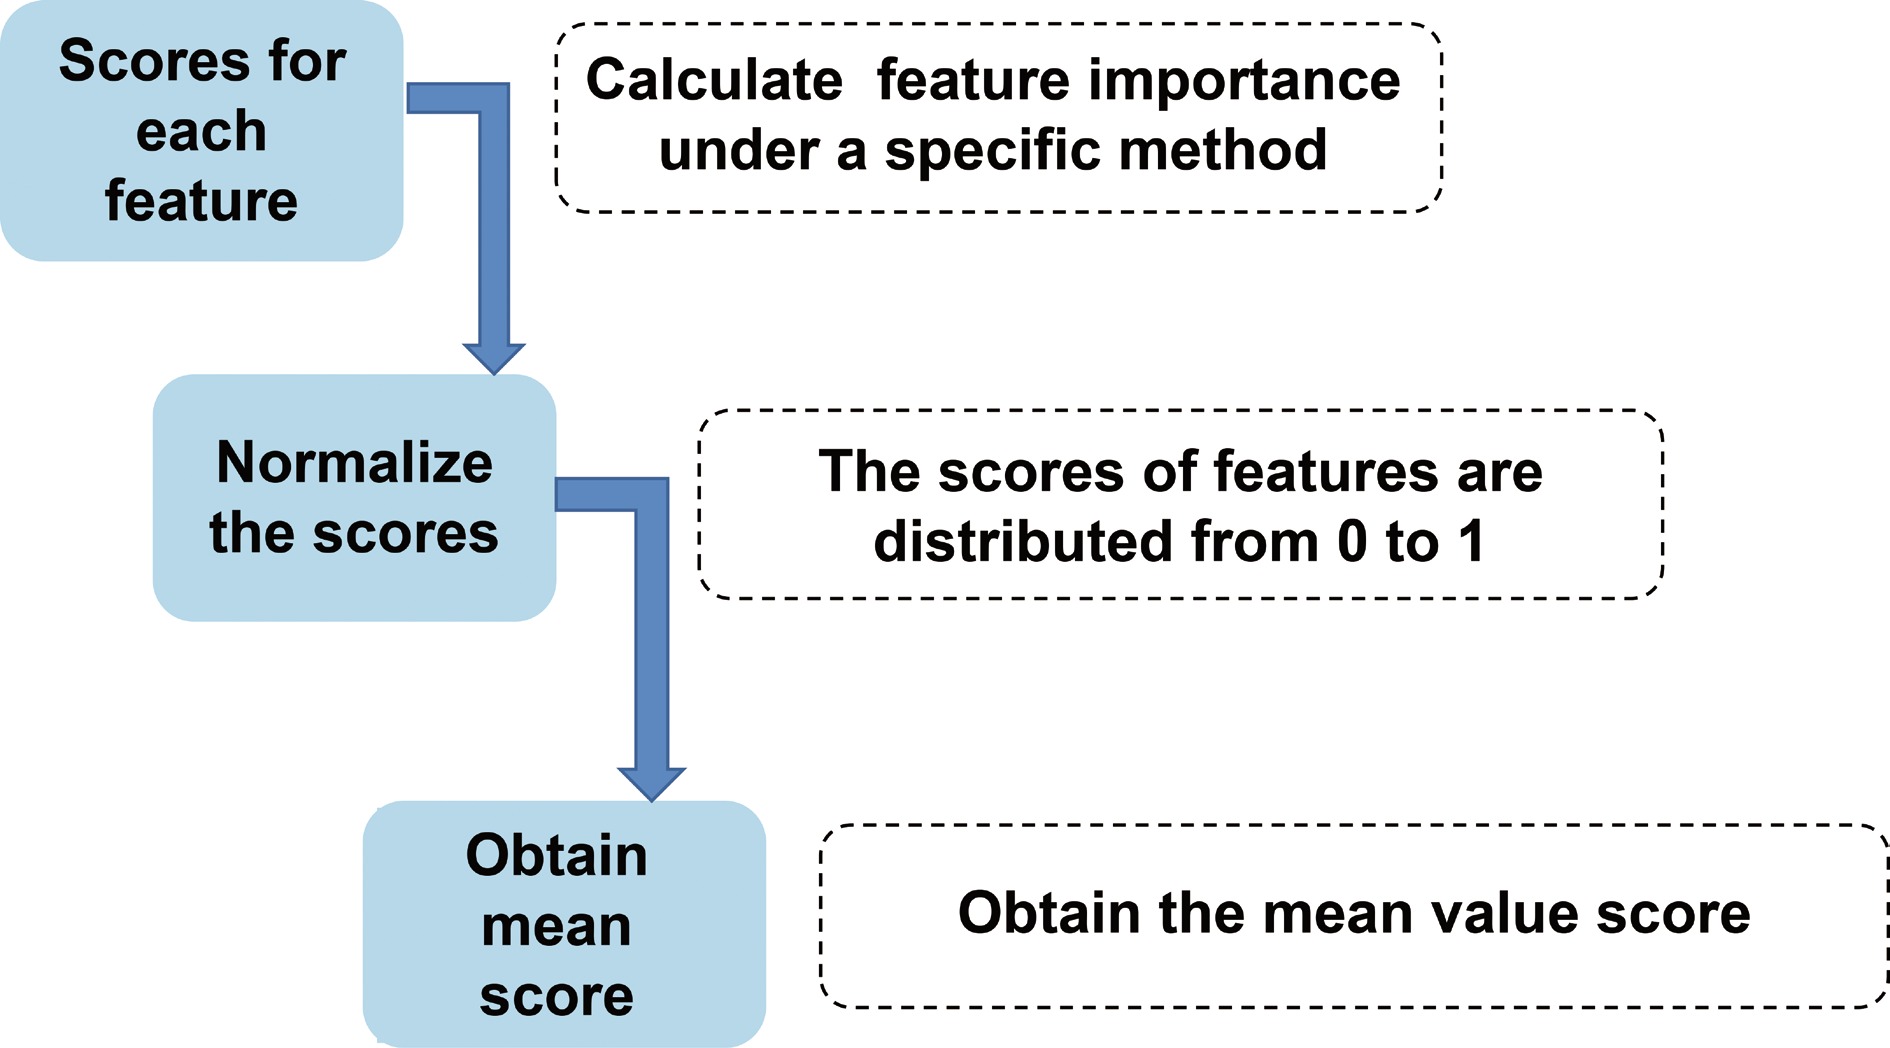
Figure 1. Flow chart for the mean score methodology.
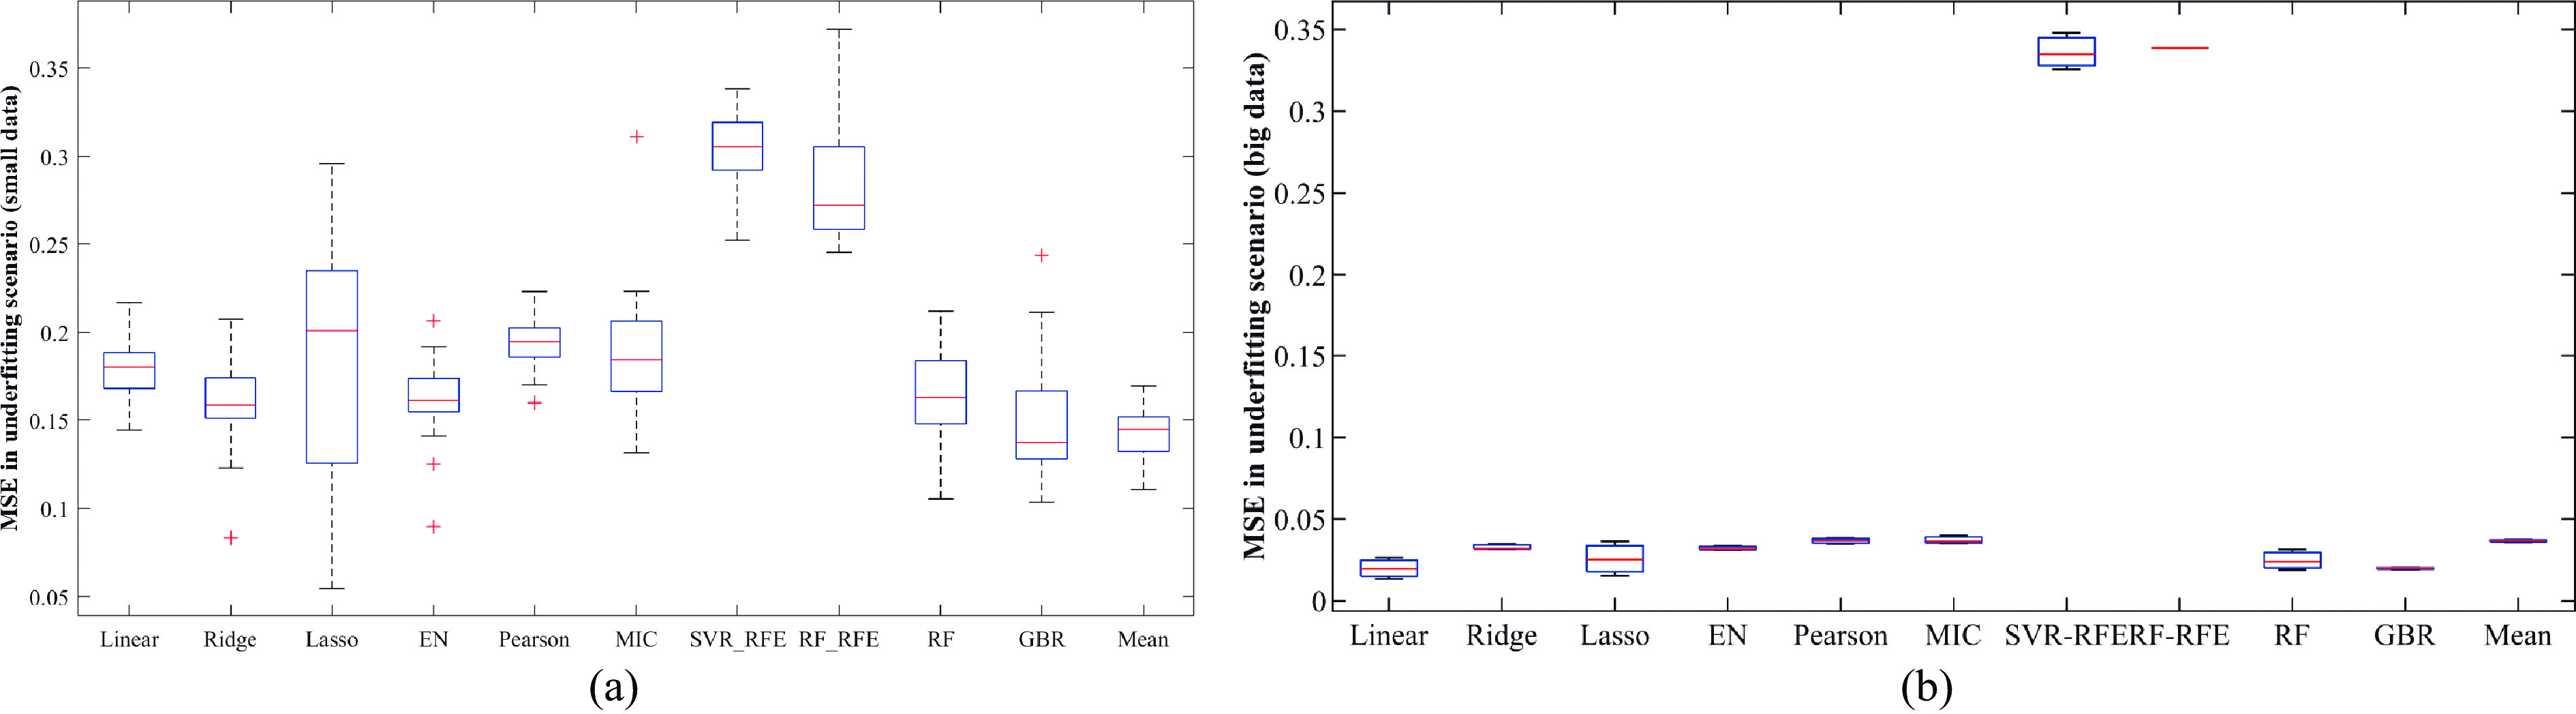
Figure 2. Comparison of indicator identification ability of methods in underfitting scenarios.
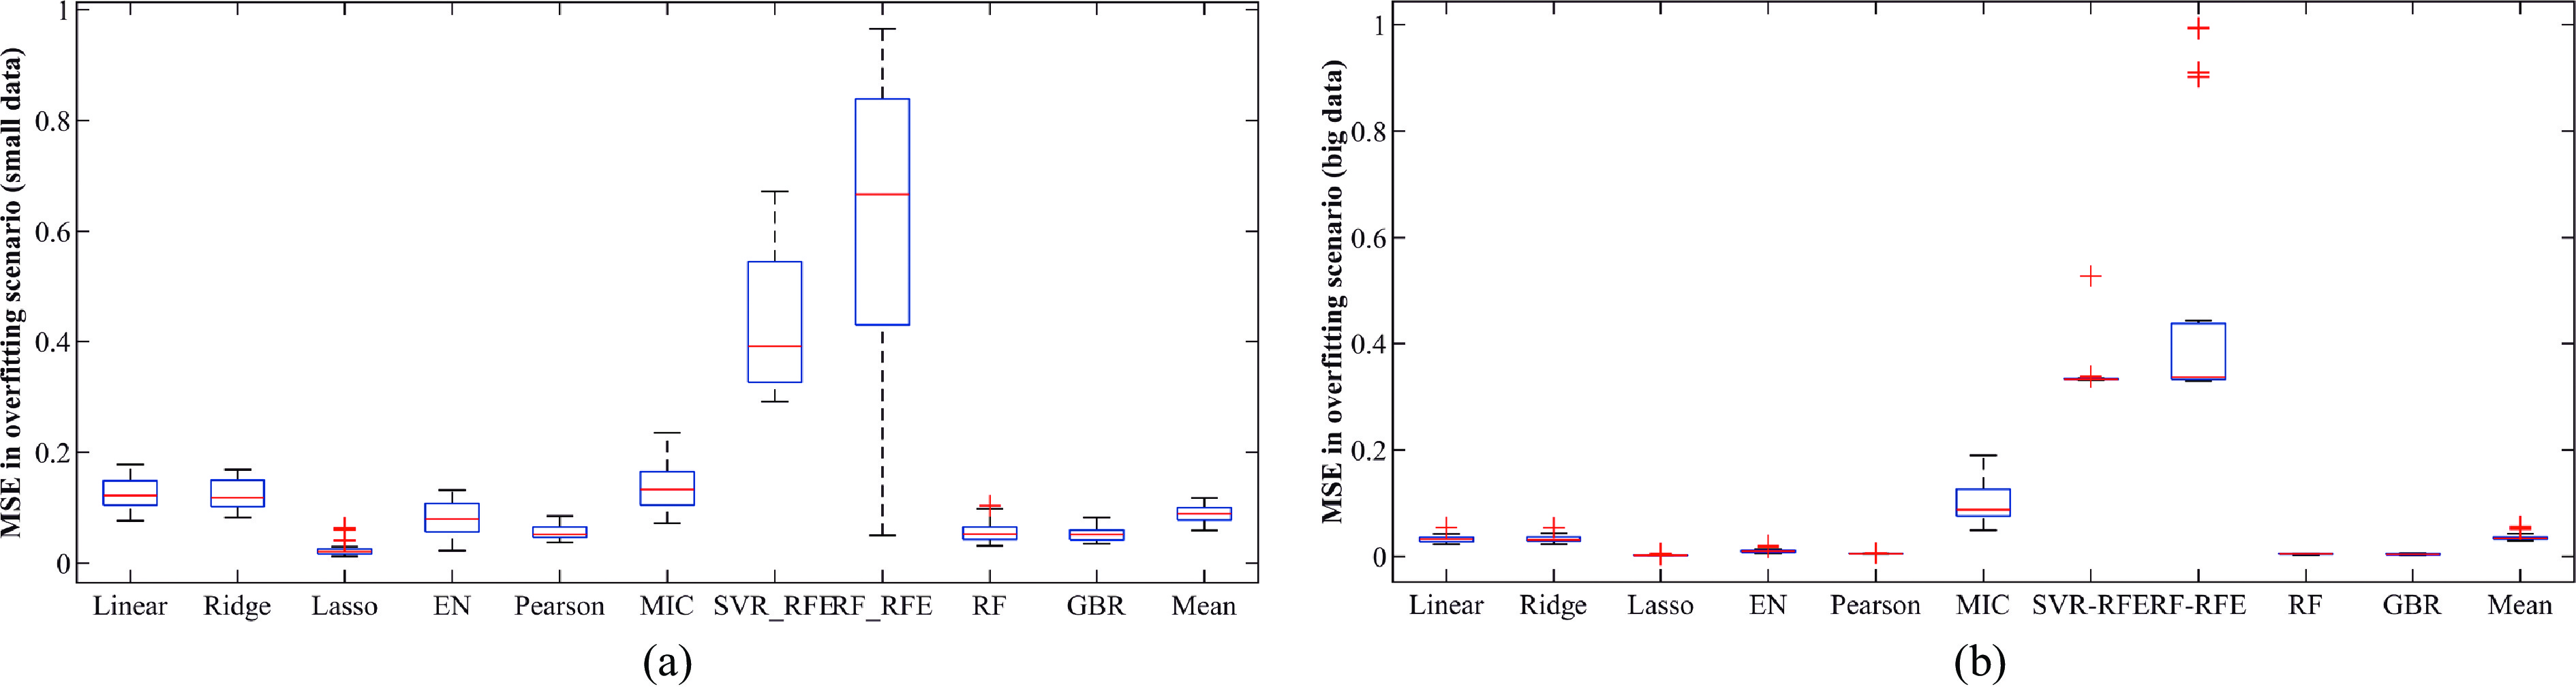
Figure 3. Comparison of indicator identification ability of methods in overfitting scenarios.
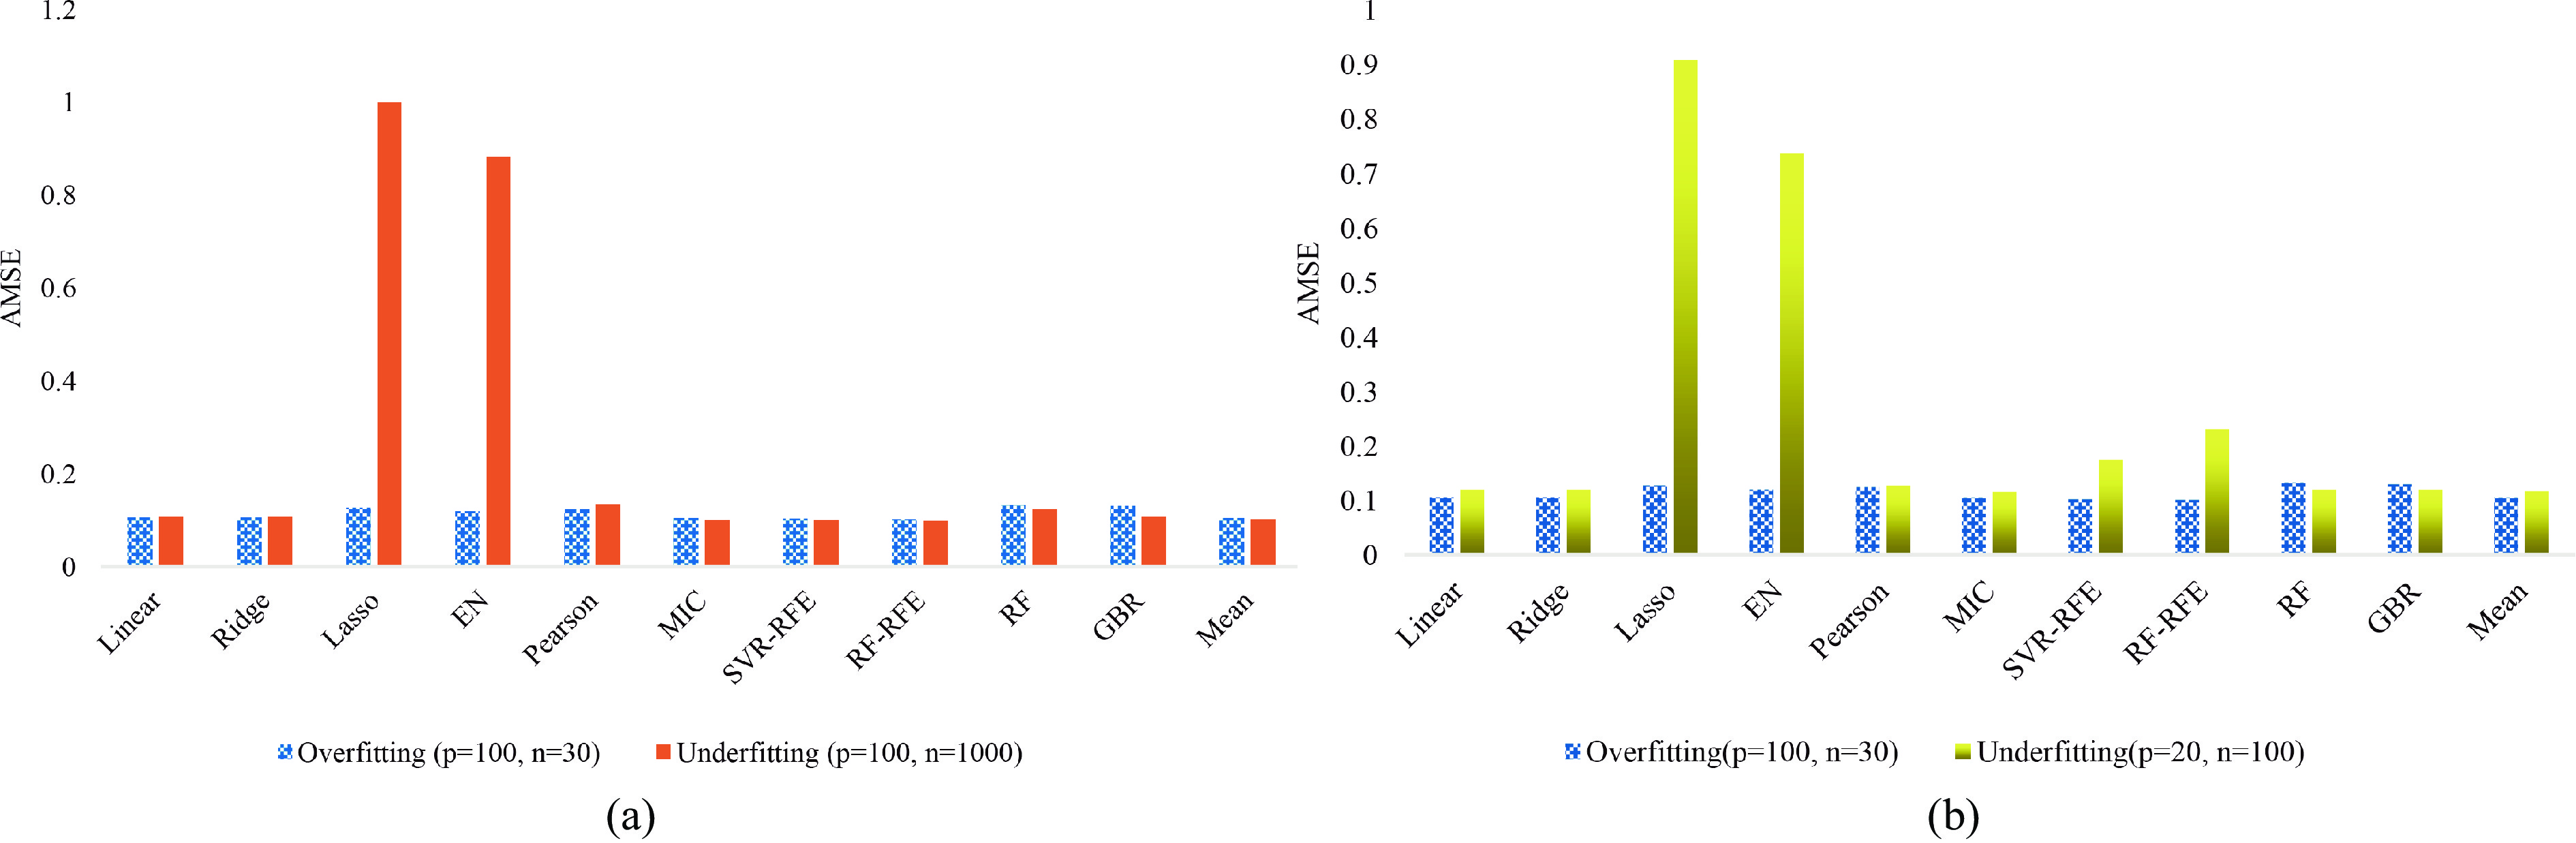
Figure 4. AMSE of methods between the overfitting and underfitting scenarios.
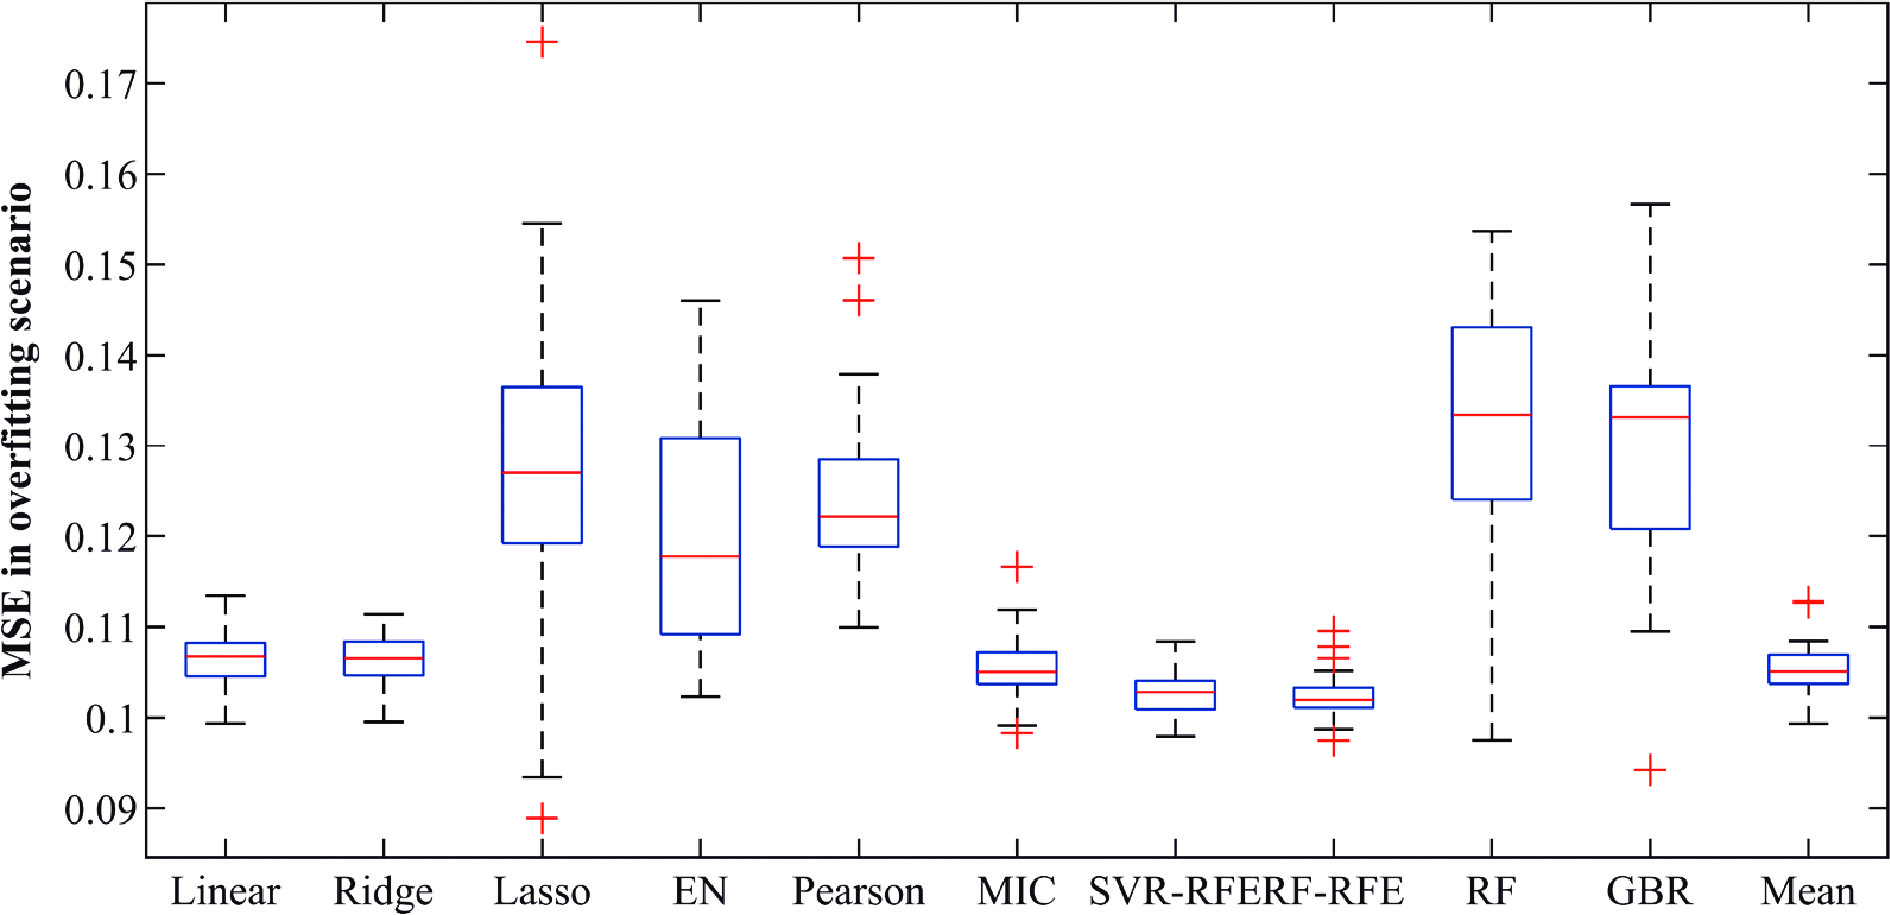
Figure 5. MSE of methods in the overfitting scenario with 30 replications.
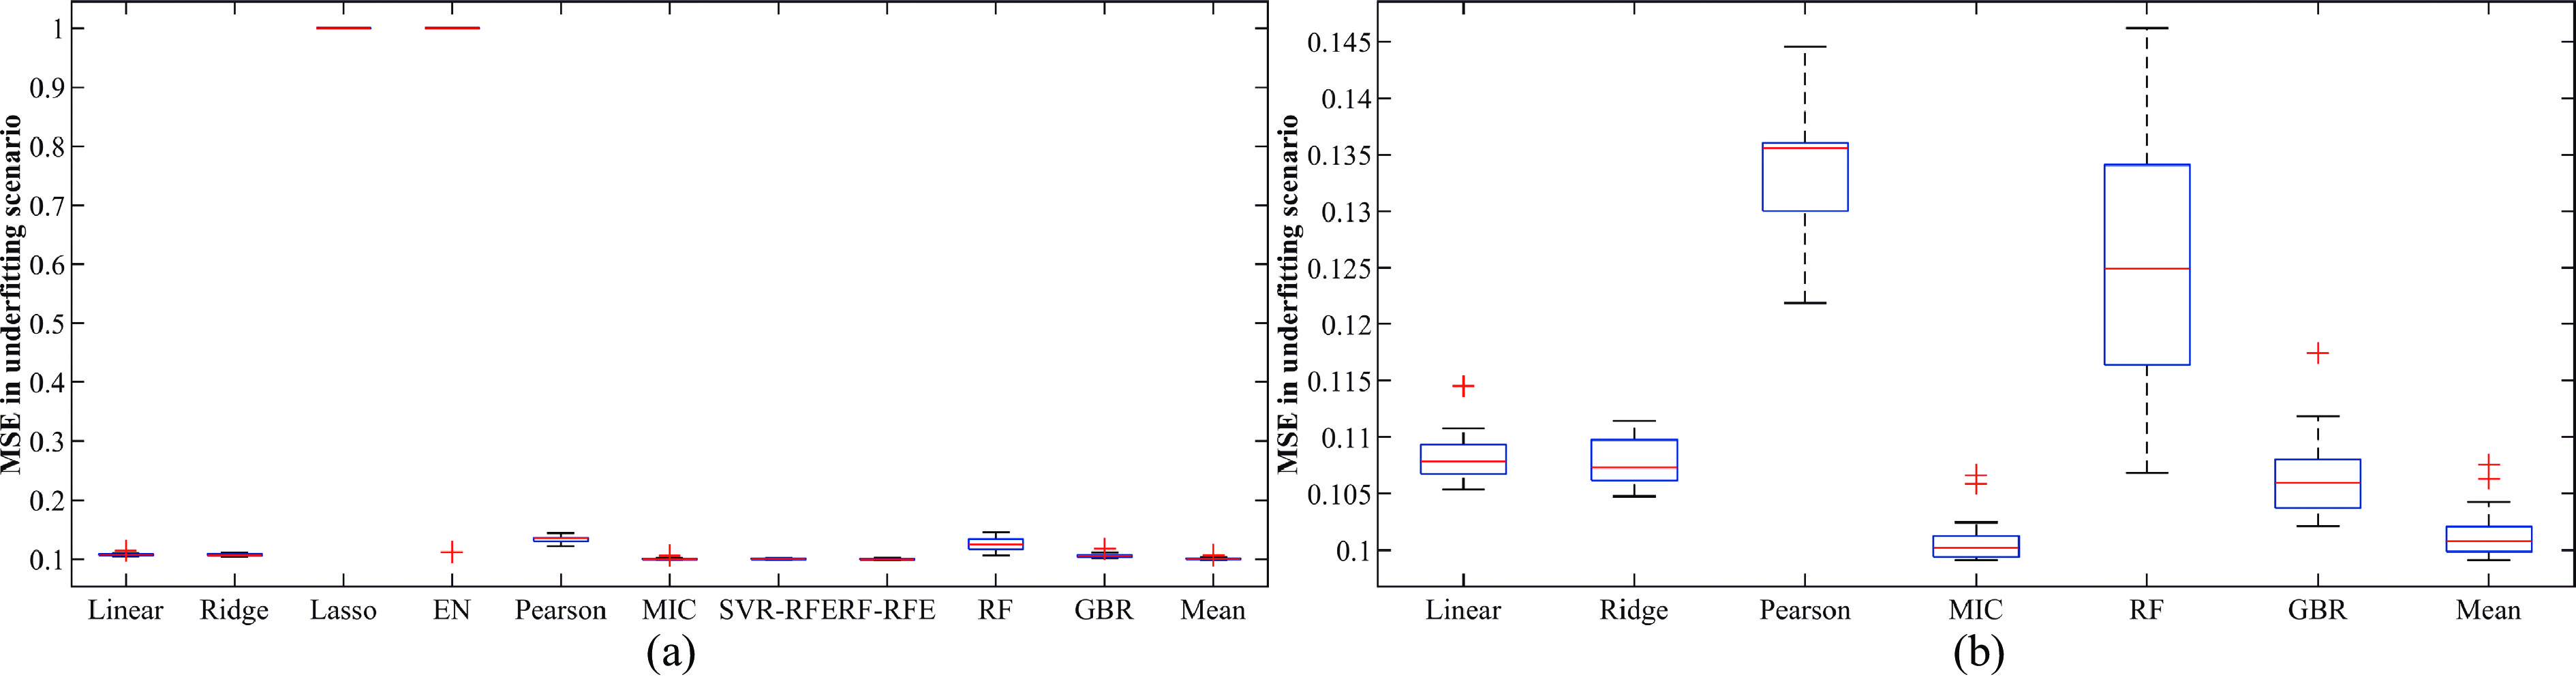
Figure 6. MSE of methods in underfitting scenario I with 30 replications.
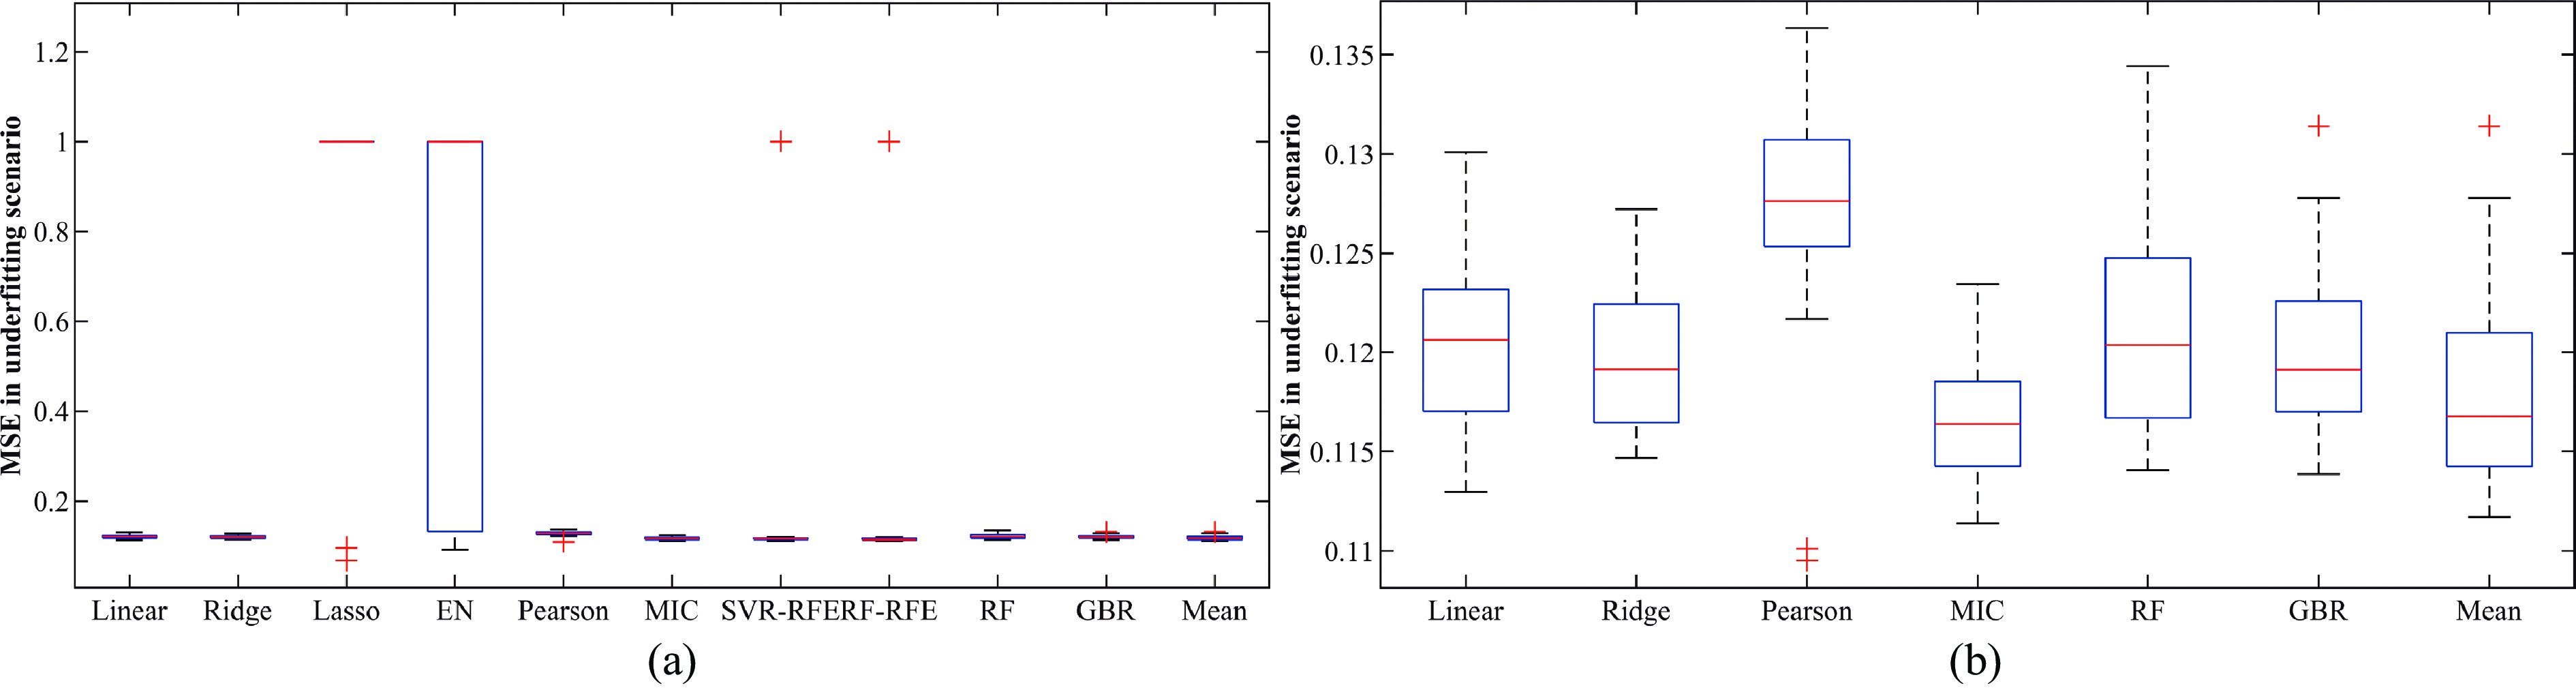
Figure 7. MSE of methods in underfitting scenario II with 30 replications.
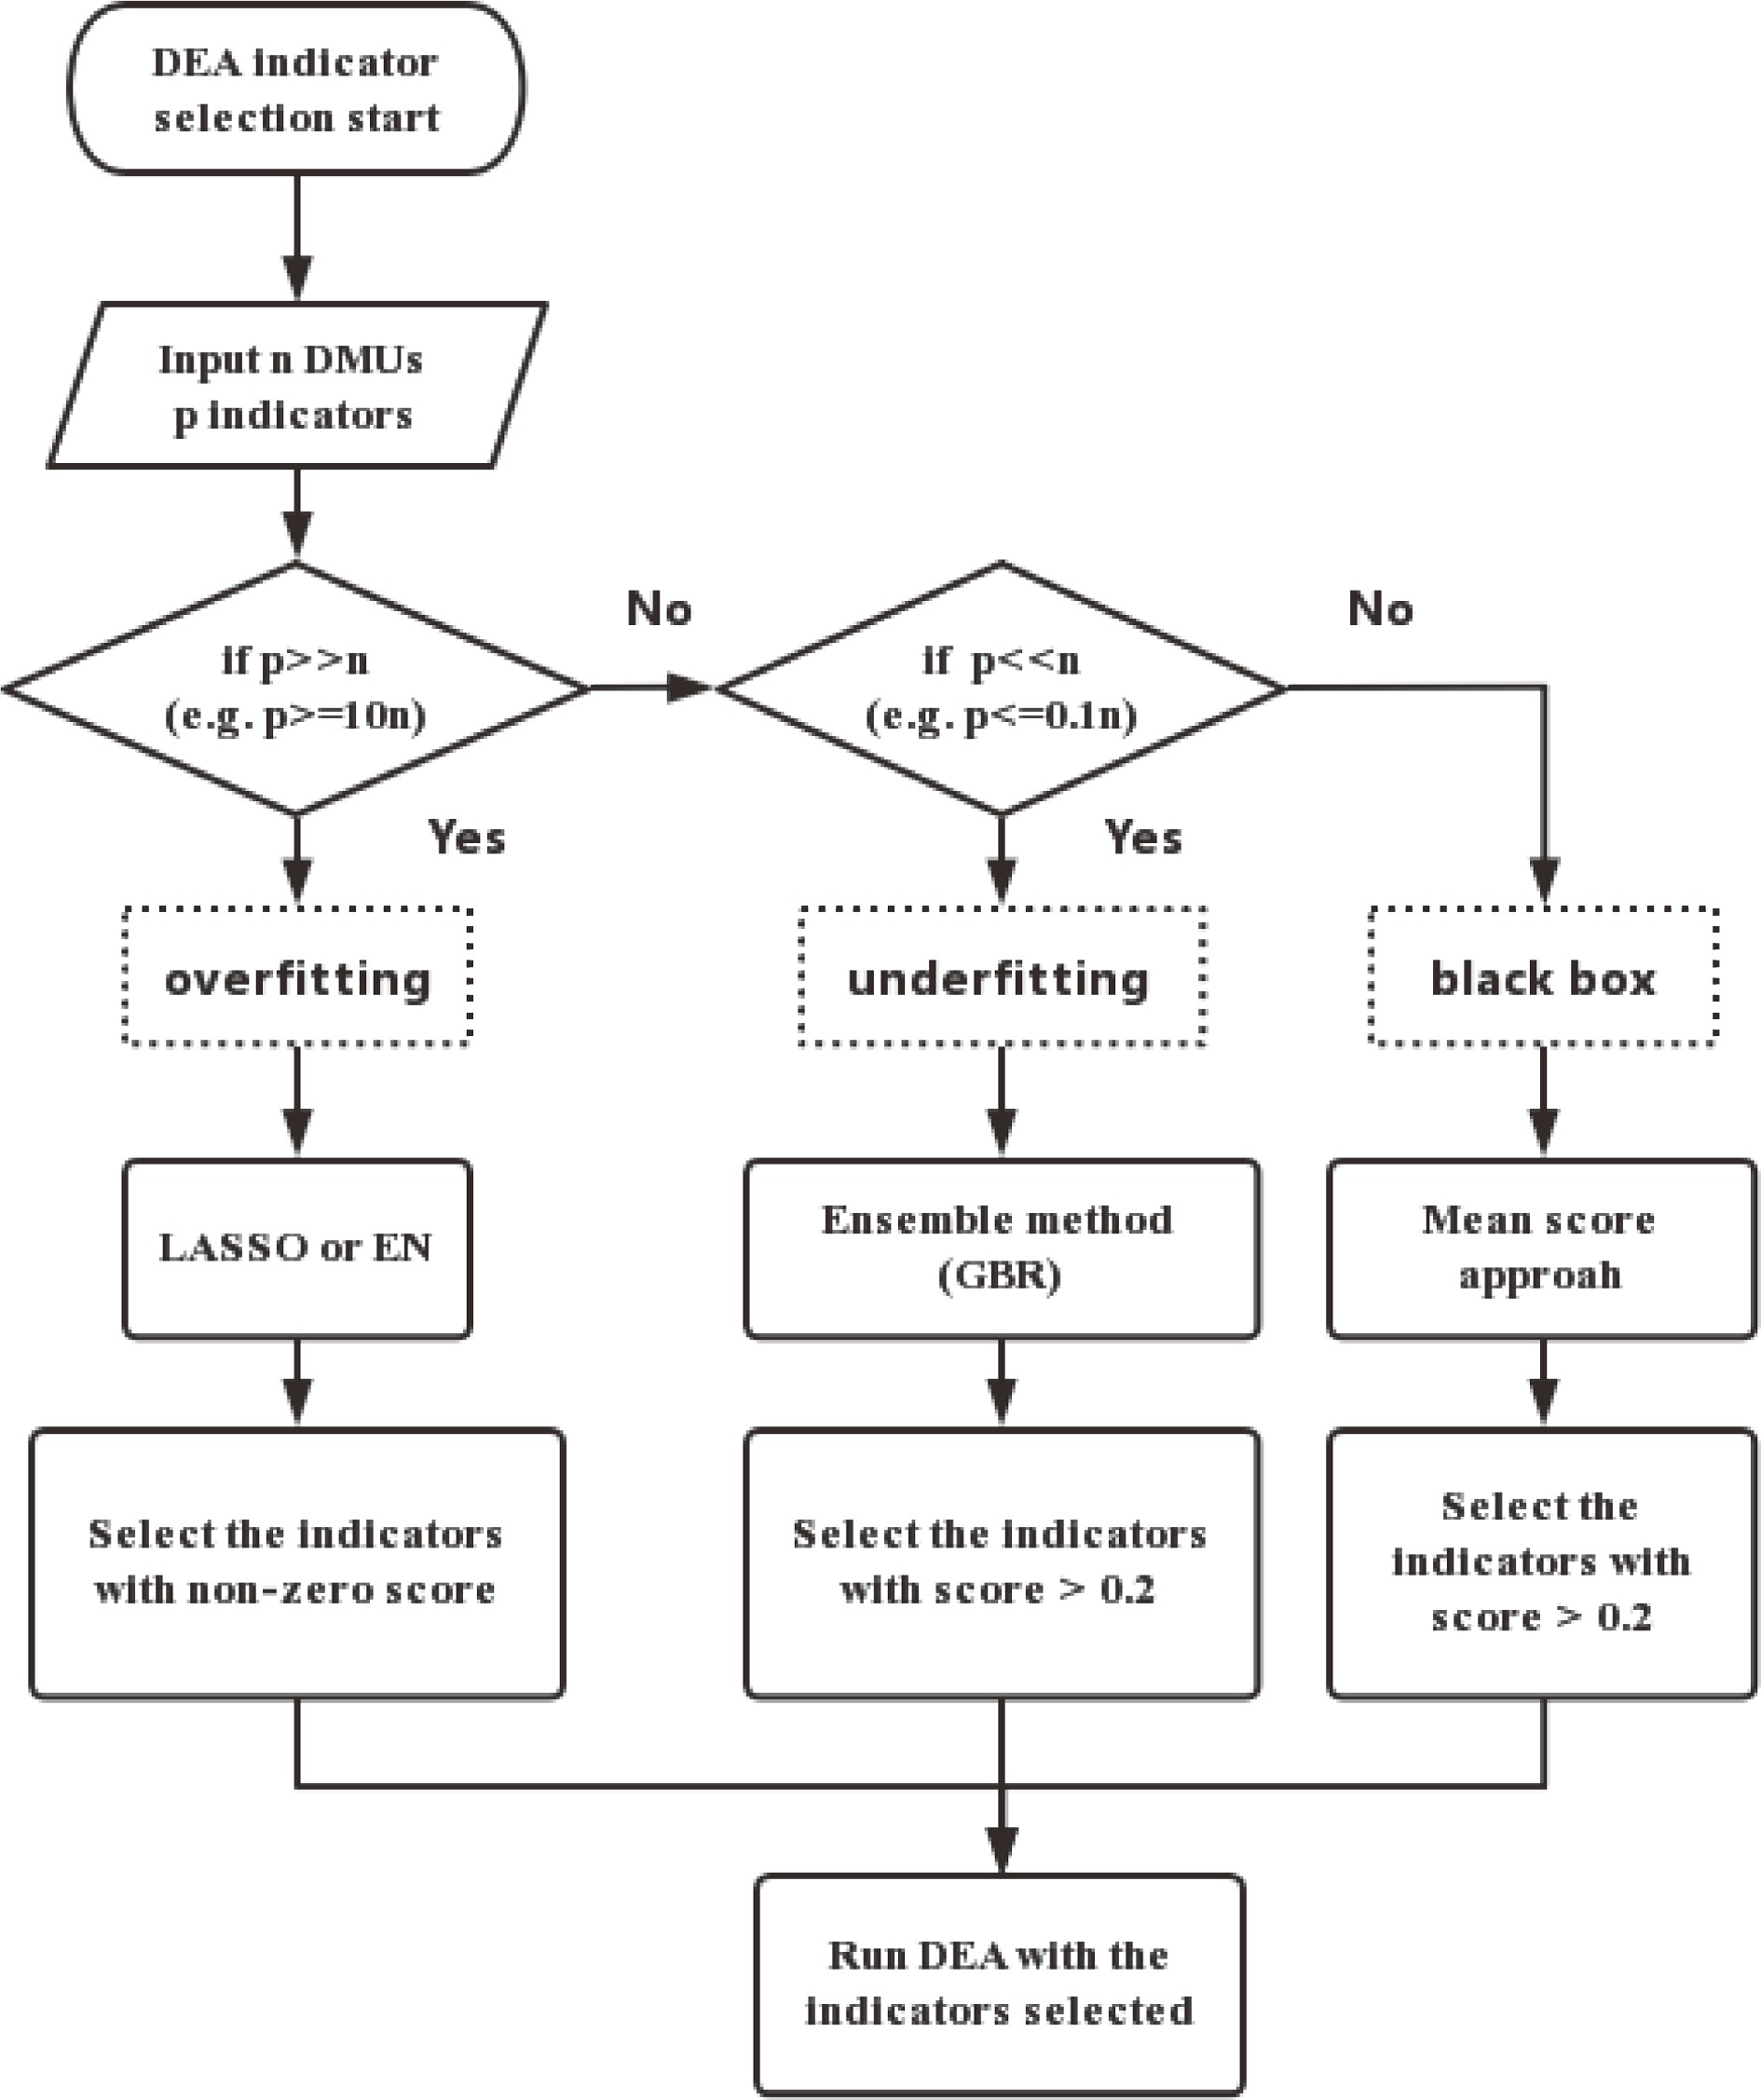
Figure 8. A smart indicator selection mechanism for DEA.
| [1] |
An Q, Chen H, Wu J, et al. Measuring slacks-based efficiency for commercial banks in China by using a two-stage DEA model with undesirable output. Annals of Operations Research, 2015, 235 (1): 13–35. DOI: 10.1007/s10479-015-1987-1
|
| [2] |
Cook W D, Liang L, Zha Y, et al. A modified super-efficiency DEA model for infeasibility. Journal of the Operational Research Society, 2009, 60 (2): 276–81. DOI: 10.1057/palgrave.jors.2602544
|
| [3] |
Liang X, Zhou Z. Cooperation and competition among urban agglomerations in environmental efficiency measurement: A cross-efficiency approach. JUSTC, 2022, 52 (4): 3. DOI: 10.52396/JUSTC-2022-0028
|
| [4] |
Chen Y, Tsionas M G, Zelenyuk V. LASSO+DEA for small and big wide data. Omega, 2021, 102: 102419. DOI: 10.1016/j.omega.2021.102419
|
| [5] |
Lee C Y, Cai J Y. LASSO variable selection in data envelopment analysis with small datasets. Omega, 2020, 91: 102019. DOI: 10.1016/j.omega.2018.12.008
|
| [6] |
Golany B, Roll Y. An application procedure for DEA. Omega, 1989, 17 (3): 237–250. DOI: 10.1016/0305-0483(89)90029-7
|
| [7] |
Boussofiane A, Dyson R G, Thanassoulis E. Applied data envelopment analysis. European Journal of Operational Research, 1991, 52 (1): 1–15. DOI: 10.1016/0377-2217(91)90331-O
|
| [8] |
Bowlin W F. Measuring performance: An introduction to data envelopment analysis (DEA). The Journal of Cost Analysis, 1998, 15 (2): 3–27. DOI: 10.1080/08823871.1998.10462318
|
| [9] |
Cooper W W, Seiford L M, Tone K. Data Envelopment Analysis: A Comprehensive Text with Models, Applications, References and DEA-Solver Software. New York: Springer, 2007.
|
| [10] |
Sehra S, Flores D, Montañez G D. Undecidability of underfitting in learning algorithms. In: 2021 2nd International Conference on Computing and Data Science (CDS). Stanford, CA: IEEE, 2021: 28–29.
|
| [11] |
Ueda T, Hoshiai Y. Application of principal component analysis for parsimonious summarization of DEA inputs and/or outputs. Journal of the Operations Research Society of Japan, 1997, 40 (4): 466–478. DOI: 10.15807/jorsj.40.466
|
| [12] |
Adler N, Golany B. Including principal component weights to improve discrimination in data envelopment analysis. Journal of the Operational Research Society, 2002, 53 (9): 985–991. DOI: 10.1057/palgrave.jors.2601400
|
| [13] |
Tibshirani R. Regression shrinkage and selection via the lasso. Journal of the Royal Statistical Society:Series B (Methodological), 1996, 58 (1): 267–288. DOI: 10.1111/j.2517-6161.1996.tb02080.x
|
| [14] |
Rosa G J M. The Elements of Statistical Learning: Data Mining, Inference, and Prediction by Hastie T, Tibshirani R, and Friedman J. Biometrics, 2010, 66 (4): 1315–1315. DOI: 10.1111/j.1541-0420.2010.01516.x
|
| [15] |
Li S, Fang H, Liu X. Parameter optimization of support vector regression based on sine cosine algorithm. Expert Systems with Applications, 2018, 91: 63–77. DOI: 10.1016/j.eswa.2017.08.038
|
| [16] |
Breiman L. Random forests. Machine Learning, 2001, 45 (1): 5–32. DOI: 10.1023/A:1010933404324
|
| [17] |
Friedman J H. Greedy function approximation: A gradient boosting machine. Annals of Statistics, 2001, 29 (5): 1189–1232. DOI: 10.1214/aos/1013203450
|
| [18] |
Guyon I, Elisseeff A. An introduction to variable and feature selection. Journal of Machine Learning Research, 2003, 3: 1157–1182.
|
| [19] |
Mézard M, Montanari A. Information, Physics, and Computation. Oxford: Oxford University Press, 2009: 584.
|
| [20] |
Profillidis V A, Botzoris G N. Chapter 5: Statistical methods for transport demand modeling. In: Modeling of Transport Demand. Amsterdam: Elsevier, 2019: 163–224.
|
| [21] |
Biswas S, Bordoloi M, Purkayastha B. Review on feature selection and classification using neuro-fuzzy approaches. International Journal of Applied Evolutionary Computation, 2016, 7: 28–44. DOI: 10.4018/IJAEC.2016100102
|
| [22] |
Fraser A M, Swinney H L. Independent coordinates for strange attractors from mutual information. Physical Review A, 1986, 33 (2): 1134–1140. DOI: 10.1103/PhysRevA.33.1134
|
| [23] |
Reshef D N, Reshef Y A, Finucane H K, et al. Detecting novel associations in large data sets. Science, 2011, 334 (6062): 1518–1524. DOI: 10.1126/science.1205438
|
| [24] |
Zhang Z, Dong J, Luo X, et al. Heartbeat classification using disease-specific feature selection. Computers in Biology and Medicine, 2014, 46: 79–89. DOI: 10.1016/j.compbiomed.2013.11.019
|
| [25] |
Soares F, Anzanello M J. Support vector regression coupled with wavelength selection as a robust analytical method. Chemometrics and Intelligent Laboratory Systems, 2018, 172: 167–173. DOI: 10.1016/j.chemolab.2017.12.007
|
| [26] |
Friedman J H. Multivariate adaptive regression splines. The Annals of Statistics, 1991, 19 (1): 1–67. DOI: 10.1214/aos/1176347963
|
| [27] |
Breiman L. Bagging predictors. Machine Learning, 1996, 24 (2): 123–140. DOI: 10.1023/A:1018054314350
|

ISSN 0253-2778
CN 34-1054/N
Copyright © Editorial Office of JUSTC, All Rights Reserved. 皖ICP备05002528号
Supported by: Beijing Renhe Information Technology Co., Ltd. 
| Algorithm 2.1 CEEMDAN_Multi_Att_RL algorithm. |
| Require: Technical indicators, including the Open, High, Low, Close, Volume, Amount, Open_MA_2, Open_MA_5, and Open_MA_10 (All technical indicators are at the minute level); |
| Ensure: Sequence value processed by the CEEMDAN method; |
| 1: Perform CEEMDAN so that \overline{{\rm{IMF}}_{1} },\cdots,\overline{{\rm{IMF}}_{n} } and R_{n}(t) of each factor sequence are obtained; |
| 2: For the j th factor of the i th stock, add the values of the corresponding positions of arrays \overline{{\rm{IMF}}_{2} },\cdots,\overline{{\rm{IMF}}_{n-1} } to obtain a new sequence value D_{i,j} ; |
| Require: Sequence value D of technical indicators processed by the CEEMDAN method, Account information (balance and position information of each stock), Q network architecture and \epsilon ; |
| 3: Initialize all parameters \theta of the Q network randomly; |
| 4: Initialize the action-value function Q corresponding to all states and actions based on \theta ; |
| 5: Initialize replay memory {\cal{D}} ; |
| 6: for i = 1,\cdots , t do |
| 7: Initialize state S to obtain s_1 ; |
| 8: Initialize a random process \epsilon for action; |
| 9: Take s_t as the input of Q network to obtain the Q value outputs corresponding to all actions; |
| 10: Select a_t = {{\rm{argmax}}}_{a_t} Q(s_t,a_t,\theta) ; |
| 11: Execute the action a_t in the state s_t to obtain the new state s_{t+1} and reward r_t ; |
| 12: Decide whether to terminate the states (\text{is}\_\text{end} = \text{true}/\text{false}); |
| 13: Save ( s_t , a_t , r_t , s_{t+1} , is_end) to replay memory {\cal{D}} ; |
| 14: S = s_{t+1}; |
| 15: M samples ( s_k , a_k , r_k , s_{k+1} , is_end) are sampled from replay memory {\cal{D}} , and calculate the current target Q value y_k ; |
| 16: y_k=\left\{\begin{aligned} r_k, \qquad \qquad && {\rm{is} }\_{\rm{end} } &={\rm{true} }; \\ r_k +\gamma \max_{a'} Q(s',a'; \theta_{k-1}), && {\rm{is} }\_{\rm{end} } &={\rm{false} }; \end{aligned}\right. |
| 17: Use the mean squaresp loss function: |
| L_k(\theta_k) = \mathbb{E}_{\pi}[(r_k+\gamma \max\limits_{a'} Q(s', a';\theta_{k-1})-Q(s,a;\theta_k))^2]; |
| 18: The gradient back propagation of the neural network is used to update all the parameters \theta of the Q network; |
| 19: If s_{t+1} is in the termination state, the current round of iteration is completed; otherwise, continue to iterate; |
| 20: end for |
 DownLoad:
CSV
DownLoad:
CSV
| Abbreviation | Description |
| CI | Compound interest value of structure |
| SR | Sharpe ratio of structure |
| MD | max drawdown of structure |
| Mean of dr | Mean of simple interest of structure |
| Std of dr | Standard deviation of simple interest of structure |
| Min of dr | minimum of simple interest of structure |
| Qn of dr | Quartile n of simple interest of structure |
| Med of dr | Median of simple interest of structure |
| Max of dr | median of simple interest of structure |
DownLoad:
CSV
| 2018 | benchmark | CMAR_10 | MAR_10 | CDRL_10 | DRL_10 |
| CI | 0.8538 | 1.0907 | 1.0676 | 1.0370 | 1.0000 |
| SR | −0.5790 | 0.5609 | 0.4503 | 0.2900 | 0.1046 |
| MD | −0.2294 | −0.1336 | −0.0957 | −0.1050 | −0.1256 |
| Mean of dr | −0.0005 | 0.0004 | 0.0004 | 0.0002 | 0.0001 |
| Std of dr | 0.0142 | 0.0134 | 0.0131 | 0.0140 | 0.0130 |
| Min of dr | −0.0531 | −0.0407 | −0.0412 | −0.0498 | −0.0708 |
| Q1 of dr | −0.0089 | −0.0079 | −0.0077 | −0.0079 | −0.0075 |
| Med of dr | 0.0002 | 0.0006 | 0.0007 | 0.0005 | −0.0001 |
| Q3 of dr | 0.0078 | 0.0084 | 0.0078 | 0.0086 | 0.0081 |
| Max of dr | 0.0463 | 0.0457 | 0.0482 | 0.0437 | 0.0349 |
DownLoad:
CSV
| 2018 | benchmark | CMAR_1_m | MAR_1_m | CDRL_1_m | DRL_1_m |
| CI | 0.8538 | 1.1298 | 1.0937 | 1.0555 | 0.9706 |
| SR | −0.5790 | 1.6010 | 1.0398 | 0.7624 | −0.2508 |
| MD | -0.2294 | −0.0360 | −0.0612 | −0.0561 | −0.1032 |
| Mean of dr | −0.0005 | 0.0005 | 0.0004 | 0.0002 | −0.0001 |
| Std of dr | 0.0142 | 0.0055 | 0.0063 | 0.0051 | 0.0064 |
| Min of dr | −0.0531 | −0.0144 | −0.0240 | −0.0147 | −0.0250 |
| Q1 of dr | −0.0089 | −0.0029 | −0.0032 | −0.0029 | −0.0033 |
| Med of dr | 0.0002 | 0.0001 | 0.0001 | 0.0004 | −0.0002 |
| Q3 of dr | 0.0078 | 0.0033 | 0.0042 | 0.0030 | 0.0036 |
| Max of dr | 0.0463 | 0.0199 | 0.0200 | 0.0154 | 0.0201 |
DownLoad:
CSV
| 2019 | benchmark | CMAR_10 | MAR_10 | CDRL_10 | DRL_10 |
| CI | 1.3357 | 1.5413 | 1.4418 | 1.4116 | 1.3796 |
| SR | 2.0358 | 3.1193 | 3.1507 | 2.6594 | 2.4129 |
| MD | −0.1019 | −0.0827 | −0.0724 | −0.0702 | −0.1200 |
| Mean of dr | 0.0013 | 0.0019 | 0.0016 | 0.0015 | 0.0014 |
| Std of dr | 0.0115 | 0.0120 | 0.0096 | 0.0107 | 0.0109 |
| Min of dr | −0.0346 | −0.0363 | −0.0282 | −0.0316 | −0.0298 |
| Q1 of dr | −0.0051 | −0.0043 | −0.0033 | −0.0043 | −0.0053 |
| Med of dr | 0.0013 | 0.0009 | 0.0011 | 0.0008 | 0.0020 |
| Q3 of dr | 0.0076 | 0.0081 | 0.0072 | 0.0063 | 0.0073 |
| Max of dr | 0.0450 | 0.0521 | 0.0358 | 0.0432 | 0.0392 |
DownLoad:
CSV
| 2019 | benchmark | CMAR_1_m | MAR_1_m | CDRL_1_m | DRL_1_m |
| CI | 1.3357 | 1.4118 | 1.3610 | 1.3411 | 1.3196 |
| SR | 2.0358 | 4.2549 | 4.1825 | 3.2599 | 3.4278 |
| MD | −0.1019 | −0.0295 | −0.0317 | −0.0421 | −0.0394 |
| Mean of dr | 0.0013 | 0.0014 | 0.0013 | 0.0012 | 0.0012 |
| Std of dr | 0.0115 | 0.0065 | 0.0058 | 0.0070 | 0.0062 |
| Min of dr | −0.0346 | −0.0134 | −0.0132 | −0.0196 | −0.0151 |
| Q1 of dr | −0.0051 | −0.0023 | −0.0019 | −0.0023 | −0.0027 |
| Med of dr | 0.0013 | 0.0007 | 0.0009 | 0.0005 | 0.0005 |
| Q3 of dr | 0.0076 | 0.0039 | 0.0041 | 0.0044 | 0.0042 |
| Max of dr | 0.0450 | 0.0330 | 0.0282 | 0.0326 | 0.0231 |
DownLoad:
CSV
| 2020 | benchmark | CMAR_10 | MAR_10 | CDRL_10 | DRL_10 |
| CI | 1.1444 | 1.3836 | 1.2743 | 1.2397 | 1.1653 |
| SR | 0.7393 | 1.7615 | 1.4447 | 1.2661 | 0.8979 |
| MD | −0.1553 | −0.1300 | −0.1443 | −0.1286 | −0.1235 |
| Mean of dr | 0.0007 | 0.0015 | 0.0011 | 0.0010 | 0.0007 |
| Std of dr | 0.0161 | 0.0160 | 0.0139 | 0.0140 | 0.0143 |
| Min of dr | −0.1138 | −0.0948 | −0.0930 | −0.0781 | −0.1025 |
| Q1 of dr | −0.0065 | −0.0060 | −0.0057 | −0.0059 | −0.0058 |
| Med of dr | −0.0005 | 0.0001 | −0.0001 | 0.0003 | −0.0005 |
| Q3 of dr | 0.0083 | 0.0081 | 0.0074 | 0.0072 | 0.0070 |
| Max of dr | 0.0662 | 0.0706 | 0.0511 | 0.0719 | 0.0744 |
DownLoad:
CSV
| 2020 | benchmark | CMAR_1_m | MAR_1_m | CDRL_1_m | DRL_1_m |
| CI | 1.1444 | 1.4176 | 1.2883 | 1.2313 | 1.1735 |
| SR | 0.7393 | 3.6530 | 2.9738 | 2.1343 | 1.6955 |
| MD | −0.1553 | −0.0413 | −0.0301 | −0.0461 | −0.0528 |
| Mean of dr | 0.0007 | 0.0015 | 0.0011 | 0.0009 | 0.0007 |
| Std of dr | 0.0161 | 0.0077 | 0.0065 | 0.0074 | 0.0070 |
| Min of dr | −0.1138 | −0.0353 | −0.0169 | −0.0351 | −0.0394 |
| Q1 of dr | −0.0065 | −0.0021 | −0.0022 | −0.0027 | −0.0030 |
| Med of dr | −0.0005 | 0.0006 | 0.0002 | 0.0005 | −0.0001 |
| Q3 of dr | 0.0083 | 0.0041 | 0.0036 | 0.0038 | 0.0033 |
| Max of dr | 0.0662 | 0.0560 | 0.0375 | 0.0344 | 0.0384 |
DownLoad:
CSV