 Download:
Figures of the Article
-
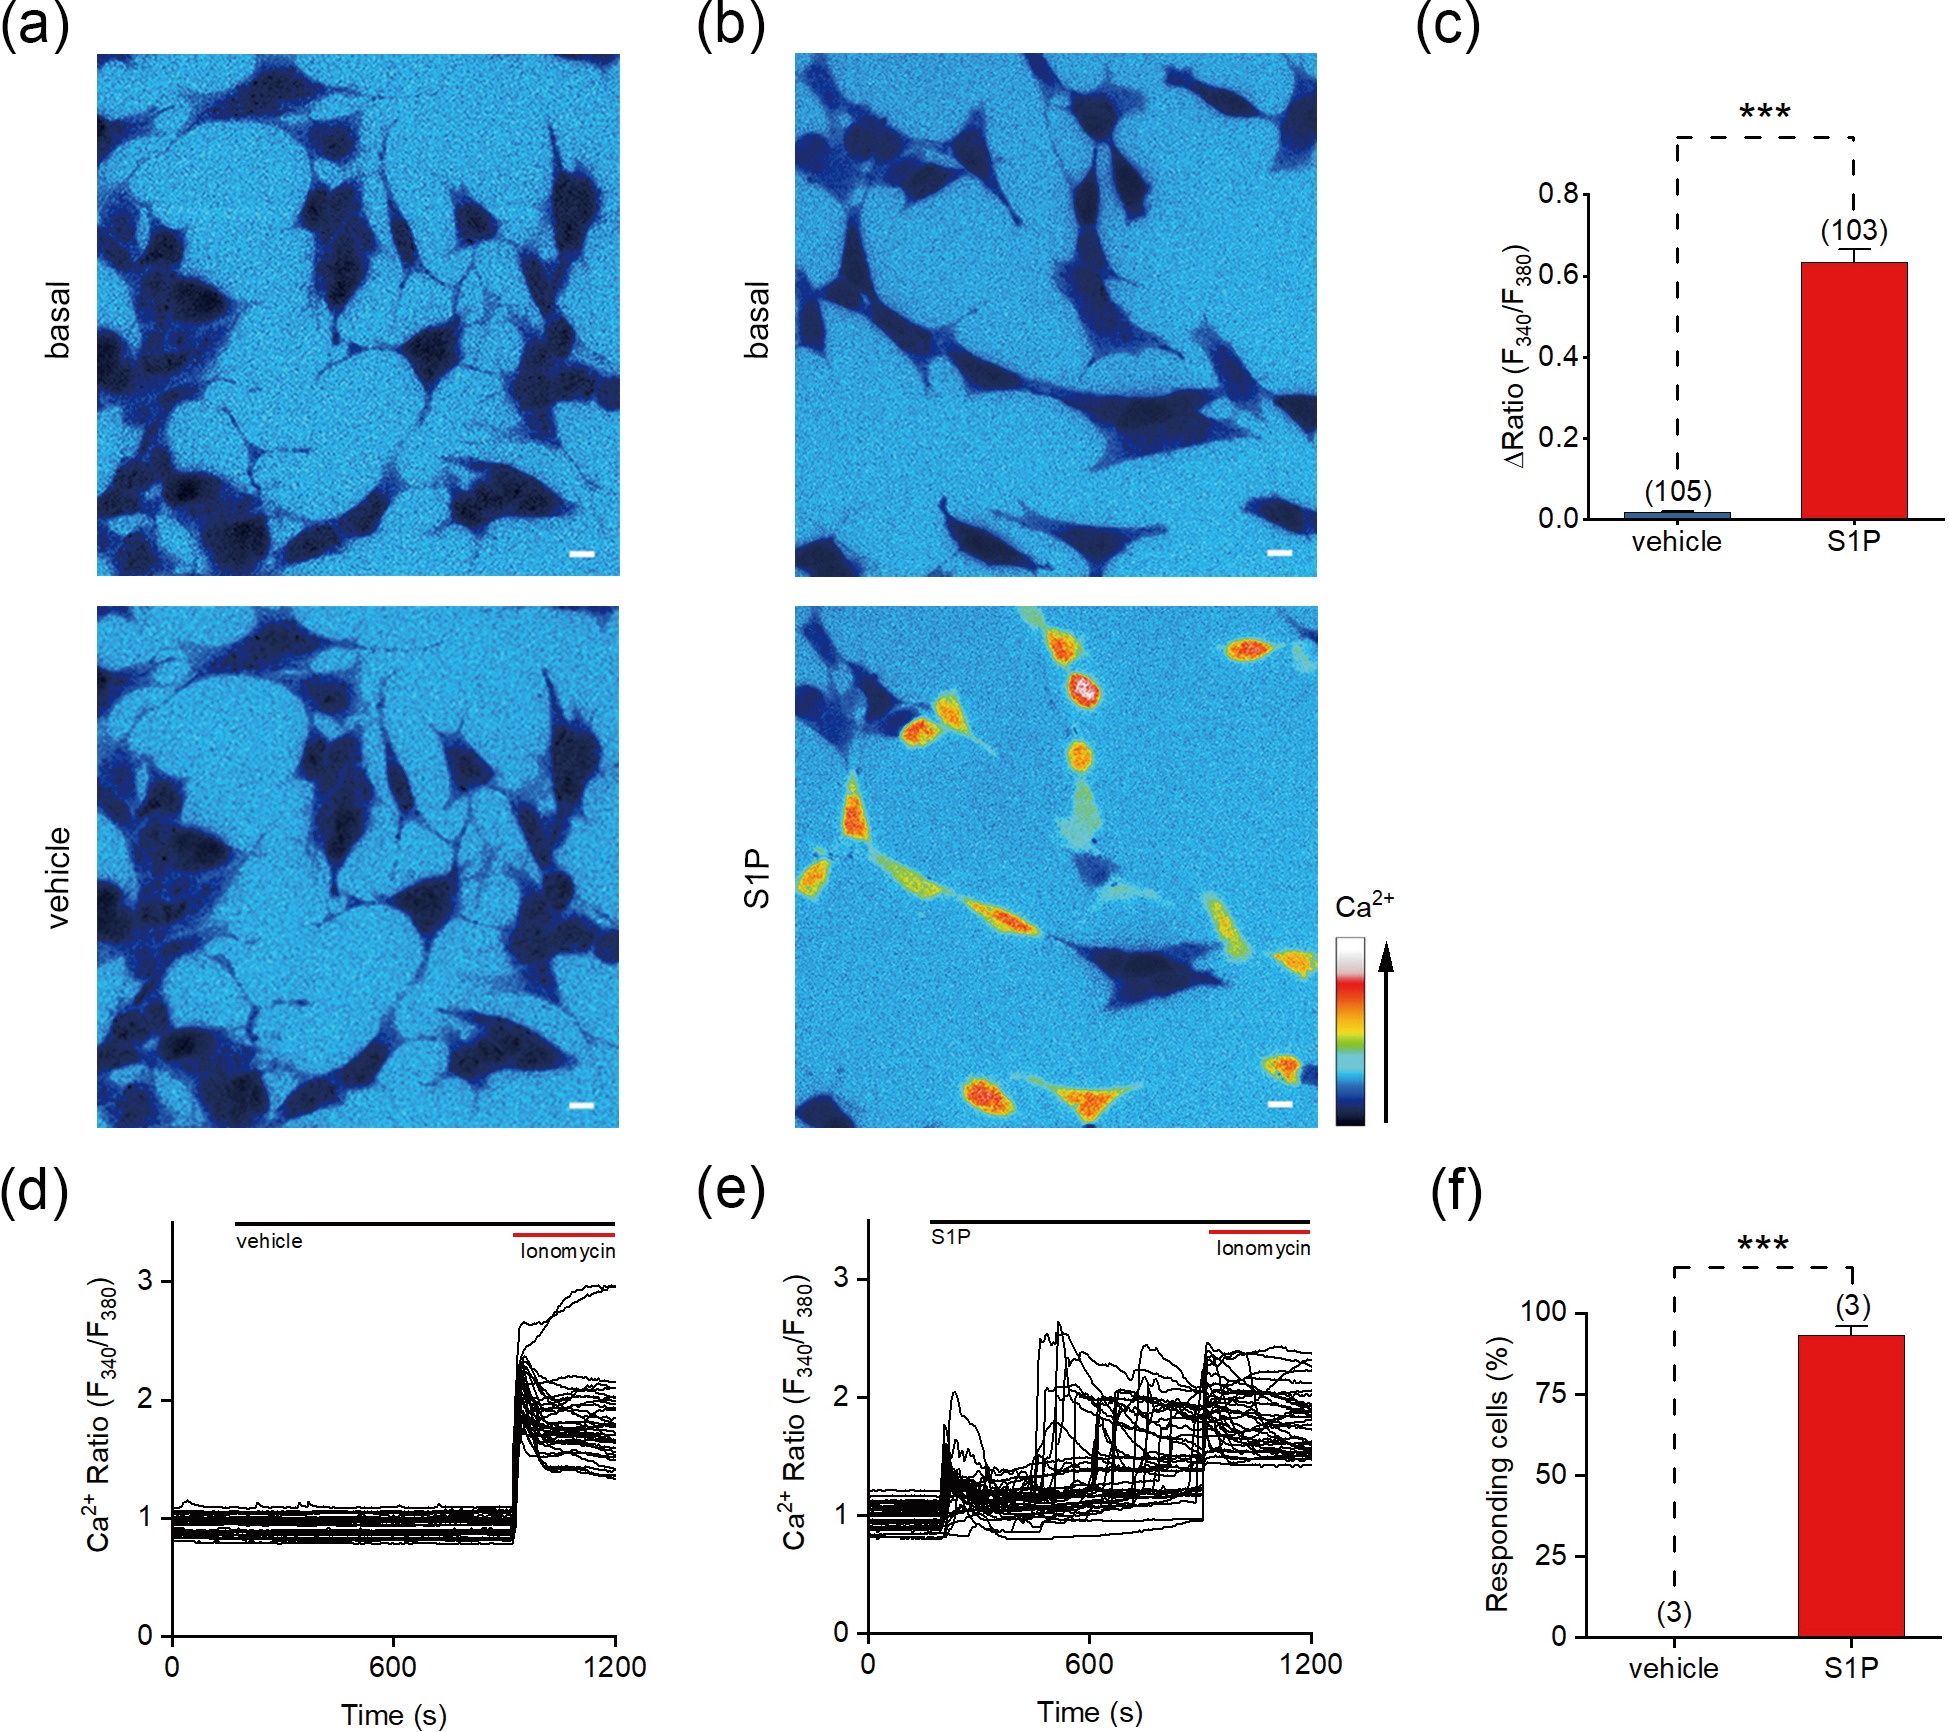
![]() S1P evokes Ca2+ signals in SH-SY5Y cells. (a, b) Representative pseudocolor images of the Fura-2 AM fluorescence ratio (F340/F380) responding to vehicle (a) and 10 μmol/L S1P (b) in SH-SY5Y cells. (c) Changes in the F340/F380 ratio (ΔRatio) of cells induced by vehicle or S1P. (d, e) Representative F340/F380 ratios of SH-SY5Y cells in response to vehicle (d) or 10 µmol/L S1P (e). (f) Percentage of cells responding to the application of vehicle or S1P (ΔRatio > 0.2). Scale bar = 10 μm. The data are presented as the means ± SEMs. ***P < 0.001.
S1P evokes Ca2+ signals in SH-SY5Y cells. (a, b) Representative pseudocolor images of the Fura-2 AM fluorescence ratio (F340/F380) responding to vehicle (a) and 10 μmol/L S1P (b) in SH-SY5Y cells. (c) Changes in the F340/F380 ratio (ΔRatio) of cells induced by vehicle or S1P. (d, e) Representative F340/F380 ratios of SH-SY5Y cells in response to vehicle (d) or 10 µmol/L S1P (e). (f) Percentage of cells responding to the application of vehicle or S1P (ΔRatio > 0.2). Scale bar = 10 μm. The data are presented as the means ± SEMs. ***P < 0.001.
-
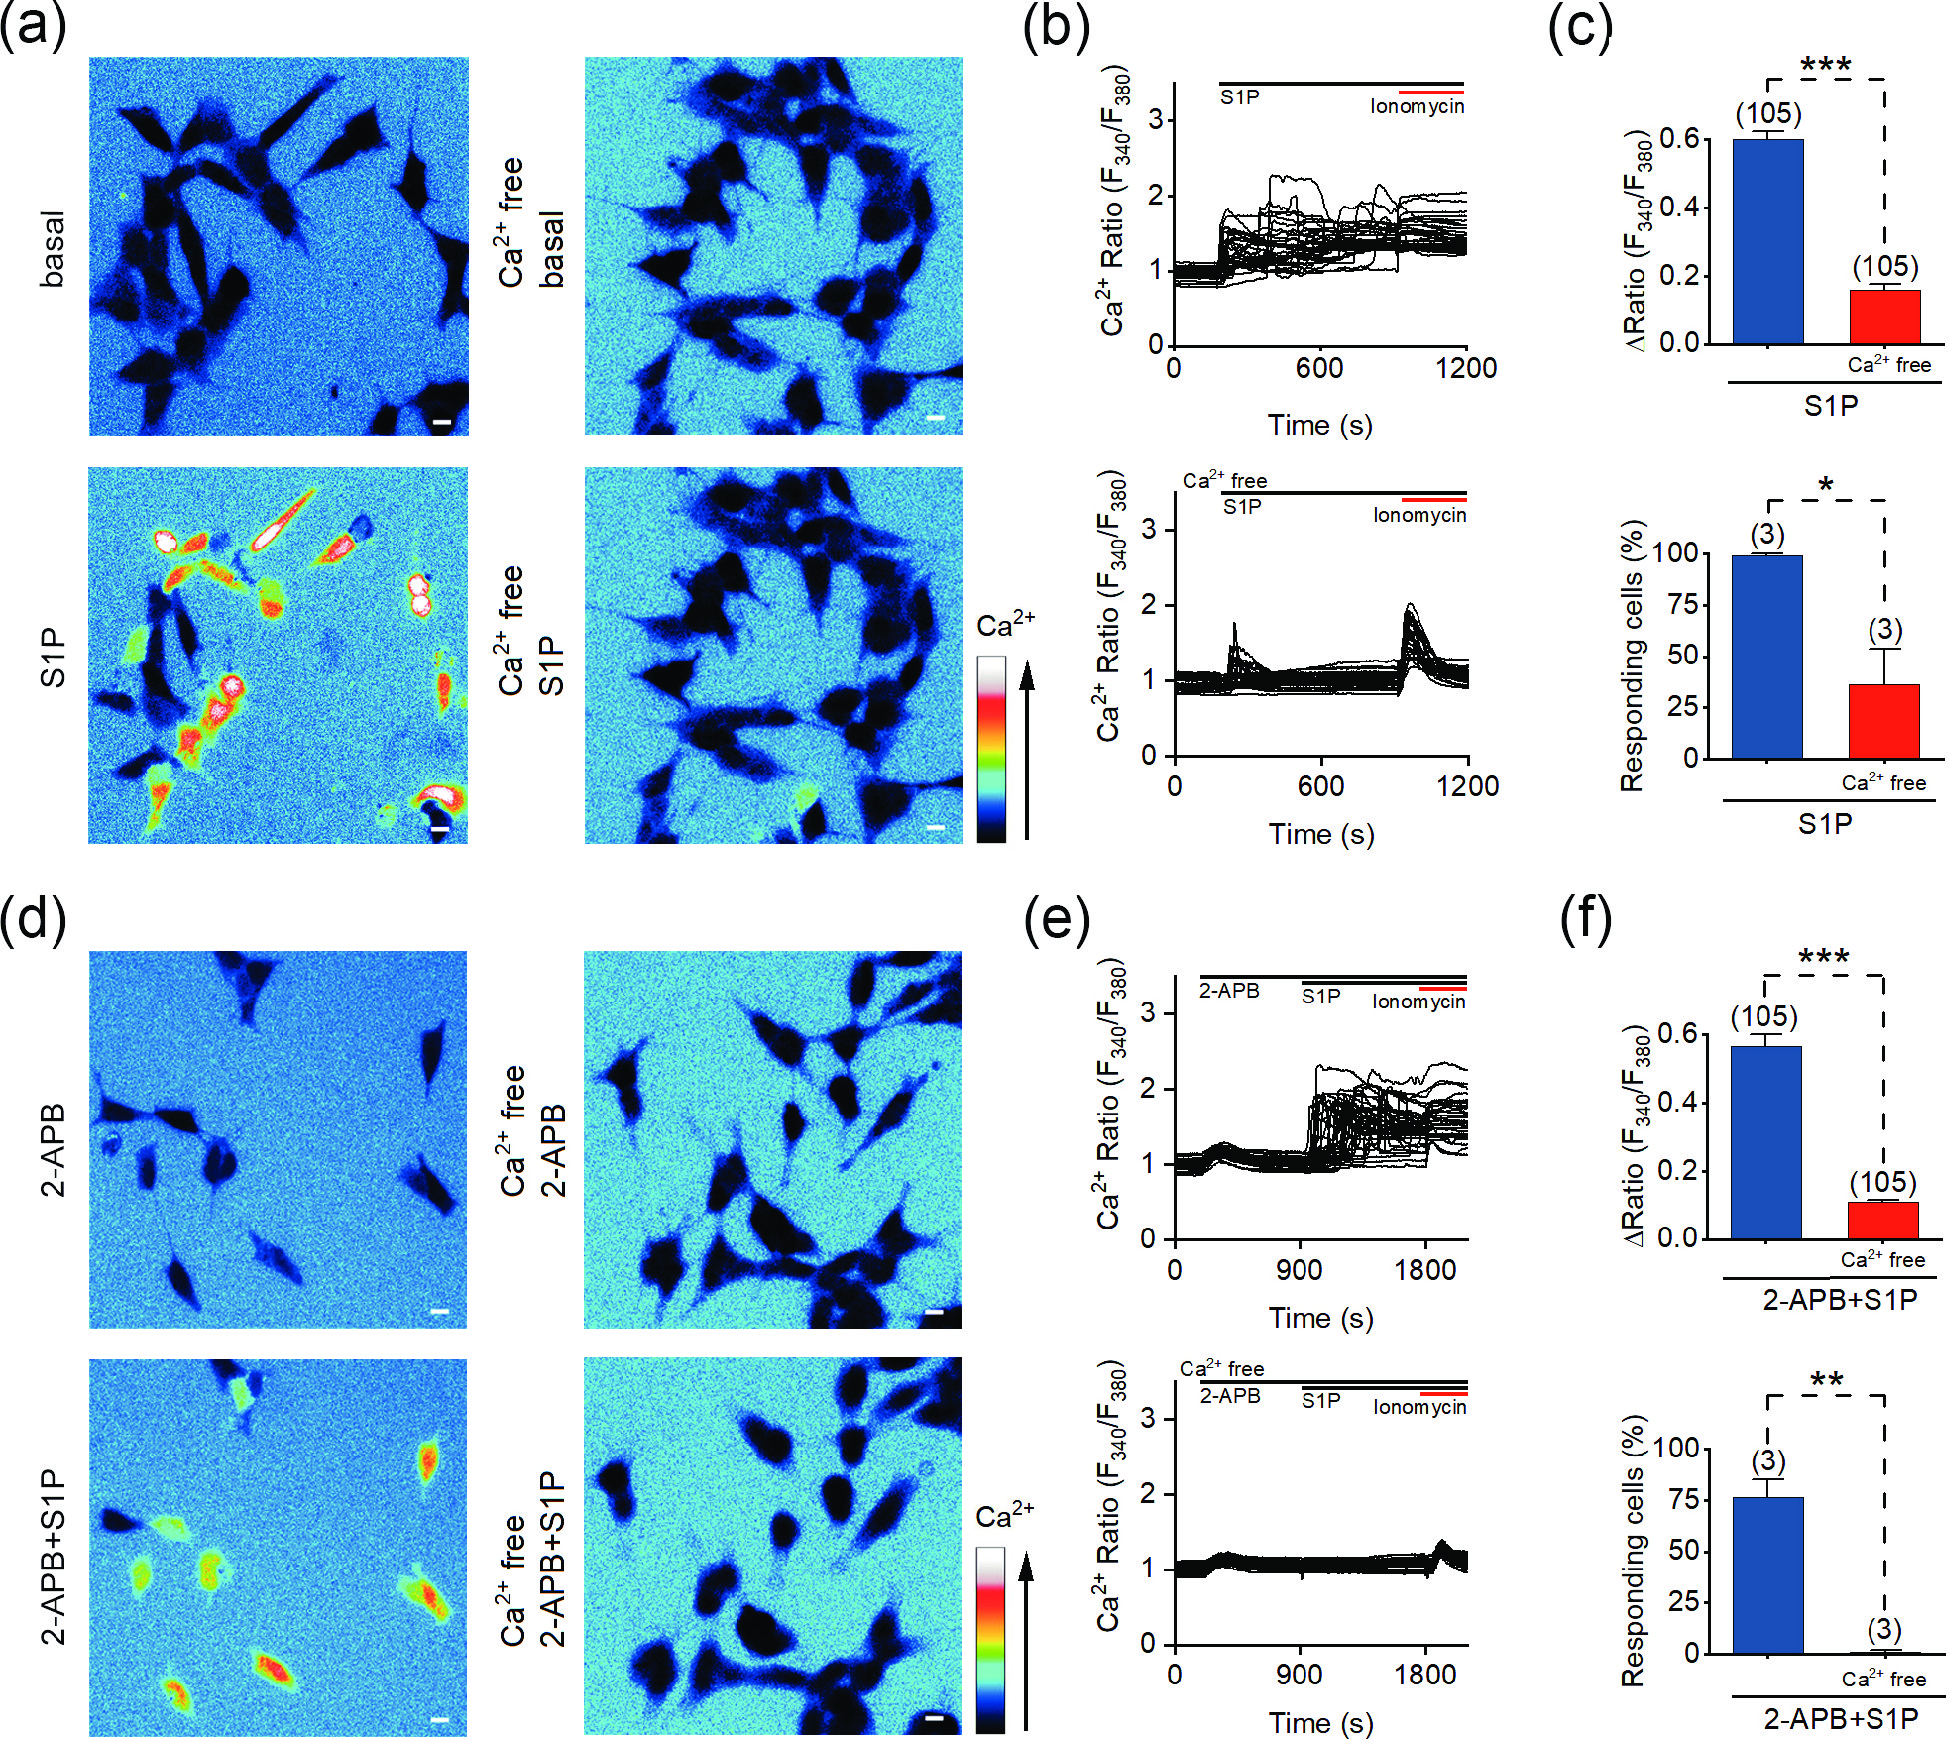
![]() S1P induces the influx of extracellular Ca2+. (a) Representative pseudocolor images of F340/F380 in SH-SY5Y cells before and after the application of 10 μmol/L S1P in Ca2+-containing (left) and Ca2+-free (right) bath solution. (b) Representative traces of calcium signals responding to 10 μmol/L S1P treatment under Ca2+-containing (upper) and Ca2+-free (lower) conditions. (c) Statistics of the ΔRatio (F340/F380; upper) and percentage of responding cells (ΔRatio > 0.2) shown in (a) and (b). (d) Representative pseudocolor images of the F340/F380 ratio in SH-SY5Y cells treated with 100 μmol/L 2-APB (upper) or 100 μmol/L 2-APB + 10 μmol/L S1P (lower) in Ca2+-containing (left) and Ca2+-free (right) solution. (e) Representative F340/F380 ratios of SH-SY5Y cells in response to 100 μmol/L 2-APB + 10 μmol/L S1P in Ca2+ (upper) and Ca2+-free (lower) solution. (f) Statistics of the ΔRatio (F340/F380; upper) and percentage of responding cells (ΔRatio > 0.2) shown in (d) and (e). Scale bar = 10 μm. The data are presented as the means ± SEMs. *P < 0.05, **P < 0.01, ***P < 0.001.
S1P induces the influx of extracellular Ca2+. (a) Representative pseudocolor images of F340/F380 in SH-SY5Y cells before and after the application of 10 μmol/L S1P in Ca2+-containing (left) and Ca2+-free (right) bath solution. (b) Representative traces of calcium signals responding to 10 μmol/L S1P treatment under Ca2+-containing (upper) and Ca2+-free (lower) conditions. (c) Statistics of the ΔRatio (F340/F380; upper) and percentage of responding cells (ΔRatio > 0.2) shown in (a) and (b). (d) Representative pseudocolor images of the F340/F380 ratio in SH-SY5Y cells treated with 100 μmol/L 2-APB (upper) or 100 μmol/L 2-APB + 10 μmol/L S1P (lower) in Ca2+-containing (left) and Ca2+-free (right) solution. (e) Representative F340/F380 ratios of SH-SY5Y cells in response to 100 μmol/L 2-APB + 10 μmol/L S1P in Ca2+ (upper) and Ca2+-free (lower) solution. (f) Statistics of the ΔRatio (F340/F380; upper) and percentage of responding cells (ΔRatio > 0.2) shown in (d) and (e). Scale bar = 10 μm. The data are presented as the means ± SEMs. *P < 0.05, **P < 0.01, ***P < 0.001.
-
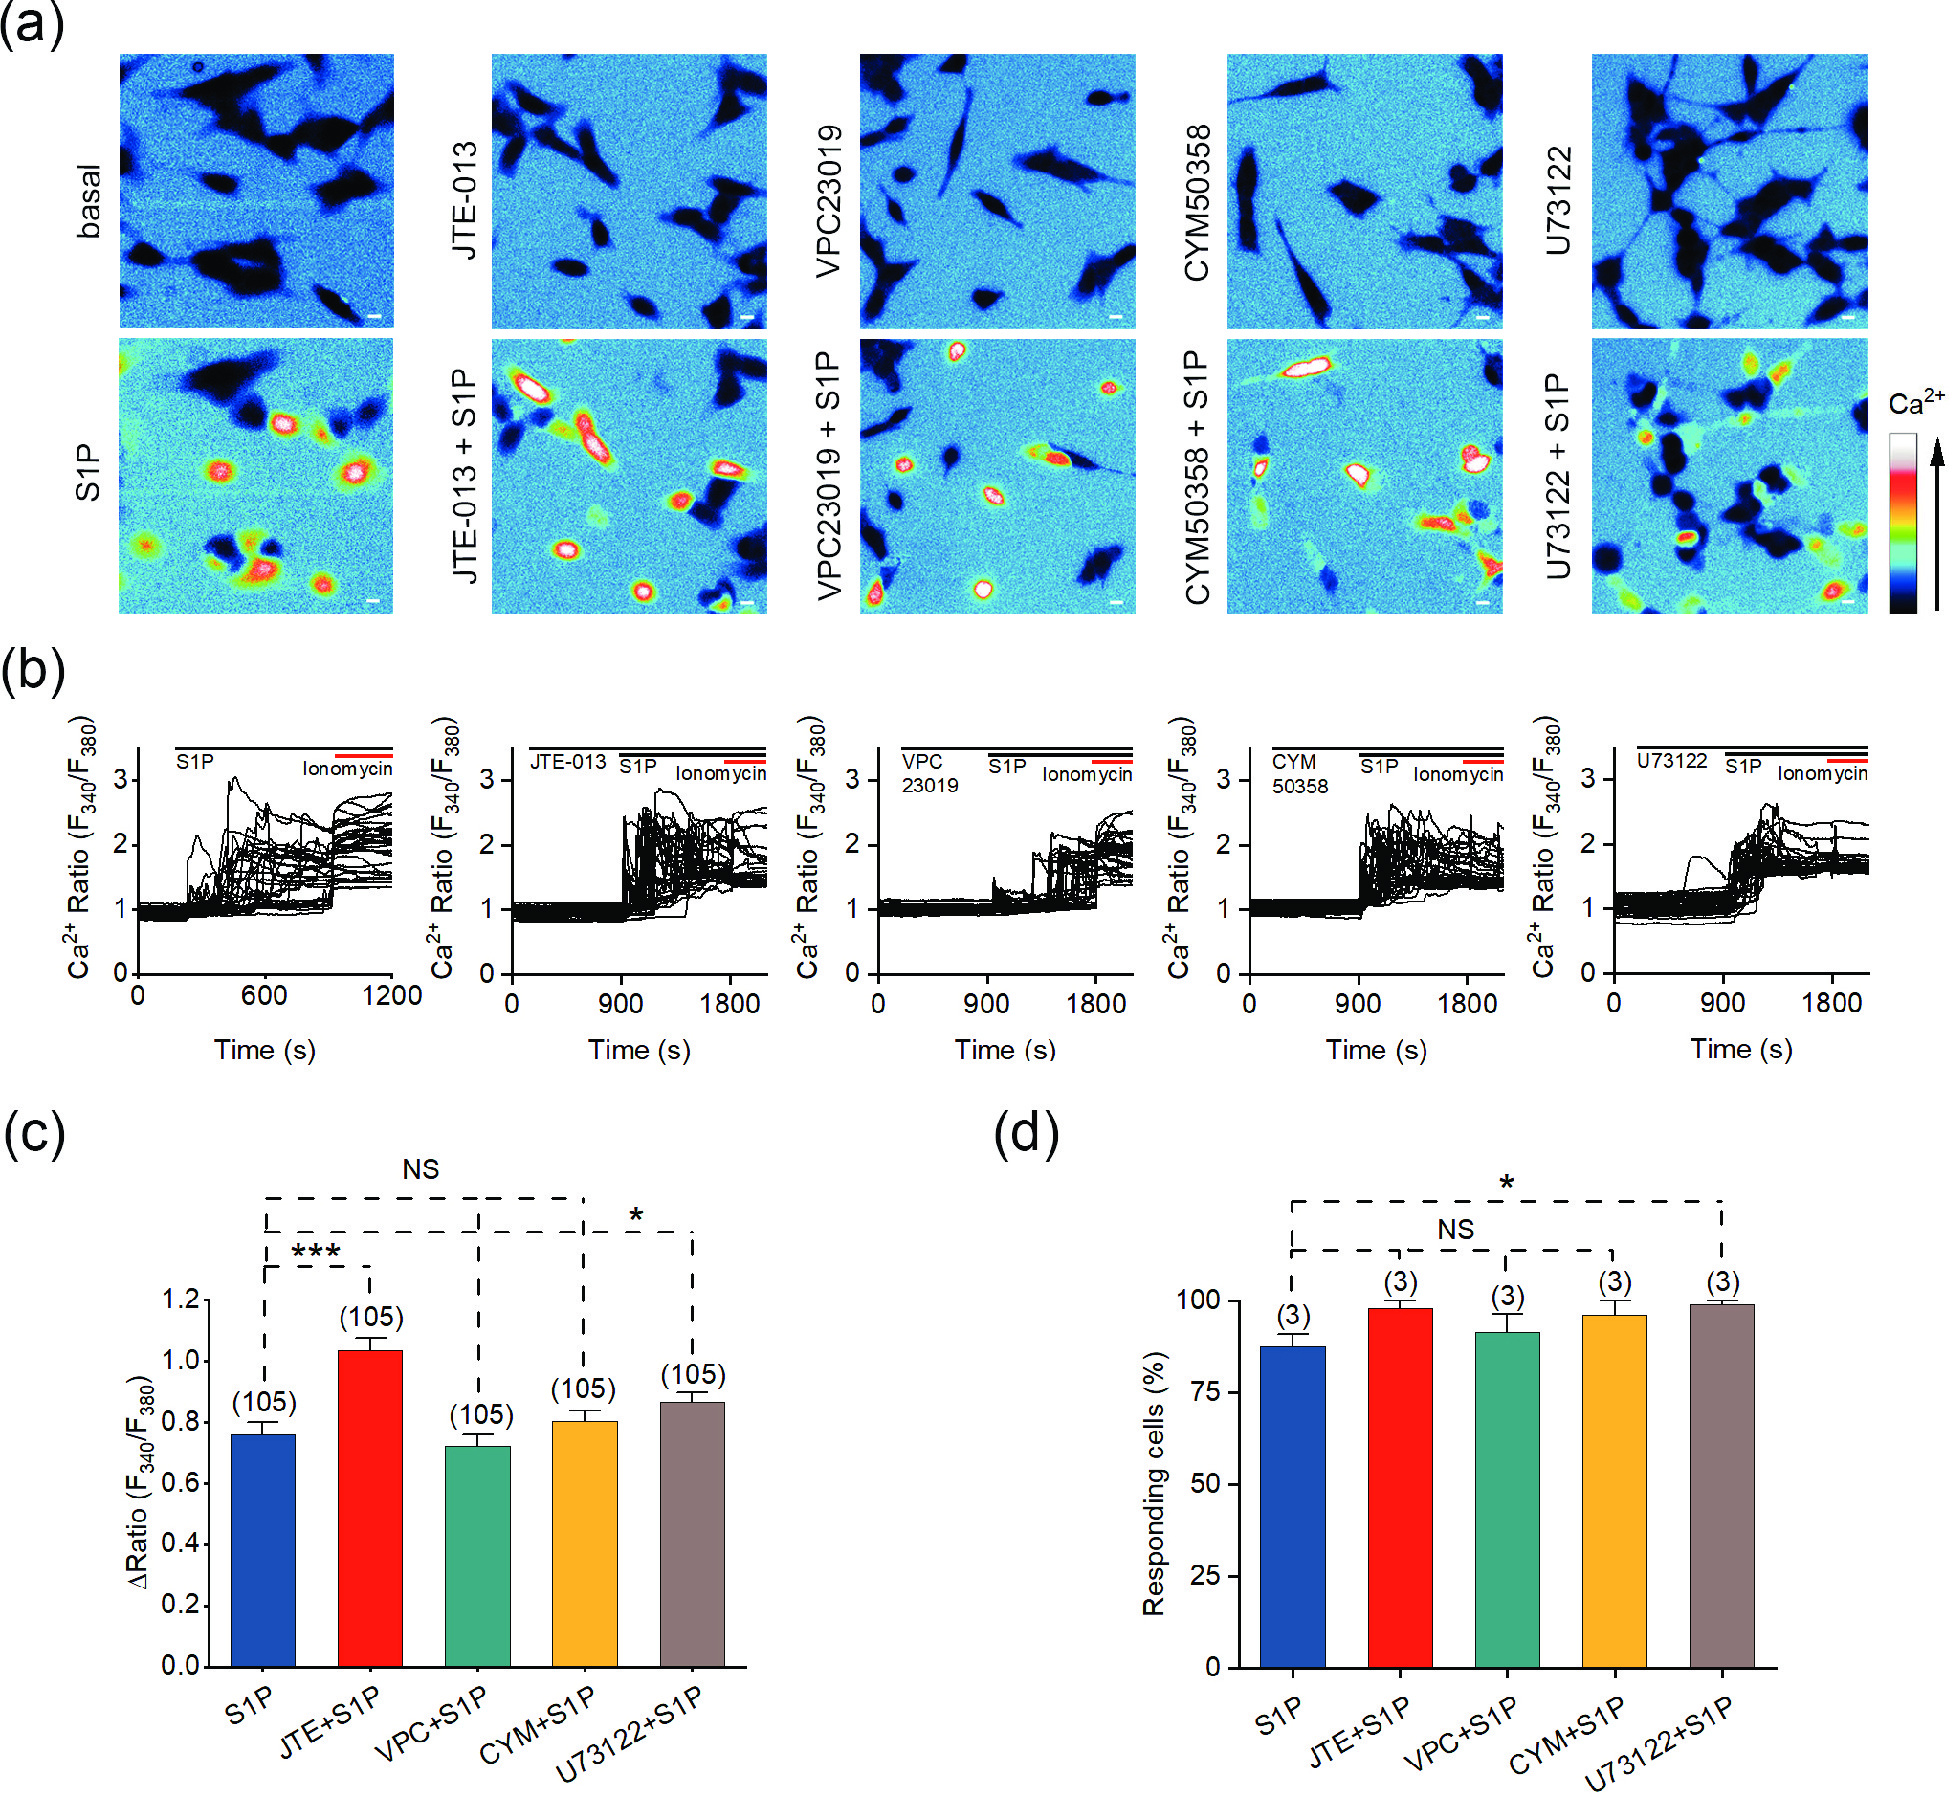
![]() The S1P-induced Ca2+ response is independent of G-protein coupled S1P receptors. (a) Representative pseudocolor images of F340/F380 in SH-SY5Y cells preincubated with the indicated antagonists and treated with 10 μmol/L S1P. (b) Representative traces of calcium signals responding to 10 μmol/L S1P treatment in SH-SY5Y cells incubated with the indicated antagonists. (c) Statistics of the ΔRatio (F340/F380). (d) Statistics of the percentage of responding cells. Scale bar = 10 μm. The data are presented as the means ± SEMs. *P < 0.05, ***P < 0.001. NS indicates no significant difference.
The S1P-induced Ca2+ response is independent of G-protein coupled S1P receptors. (a) Representative pseudocolor images of F340/F380 in SH-SY5Y cells preincubated with the indicated antagonists and treated with 10 μmol/L S1P. (b) Representative traces of calcium signals responding to 10 μmol/L S1P treatment in SH-SY5Y cells incubated with the indicated antagonists. (c) Statistics of the ΔRatio (F340/F380). (d) Statistics of the percentage of responding cells. Scale bar = 10 μm. The data are presented as the means ± SEMs. *P < 0.05, ***P < 0.001. NS indicates no significant difference.
-
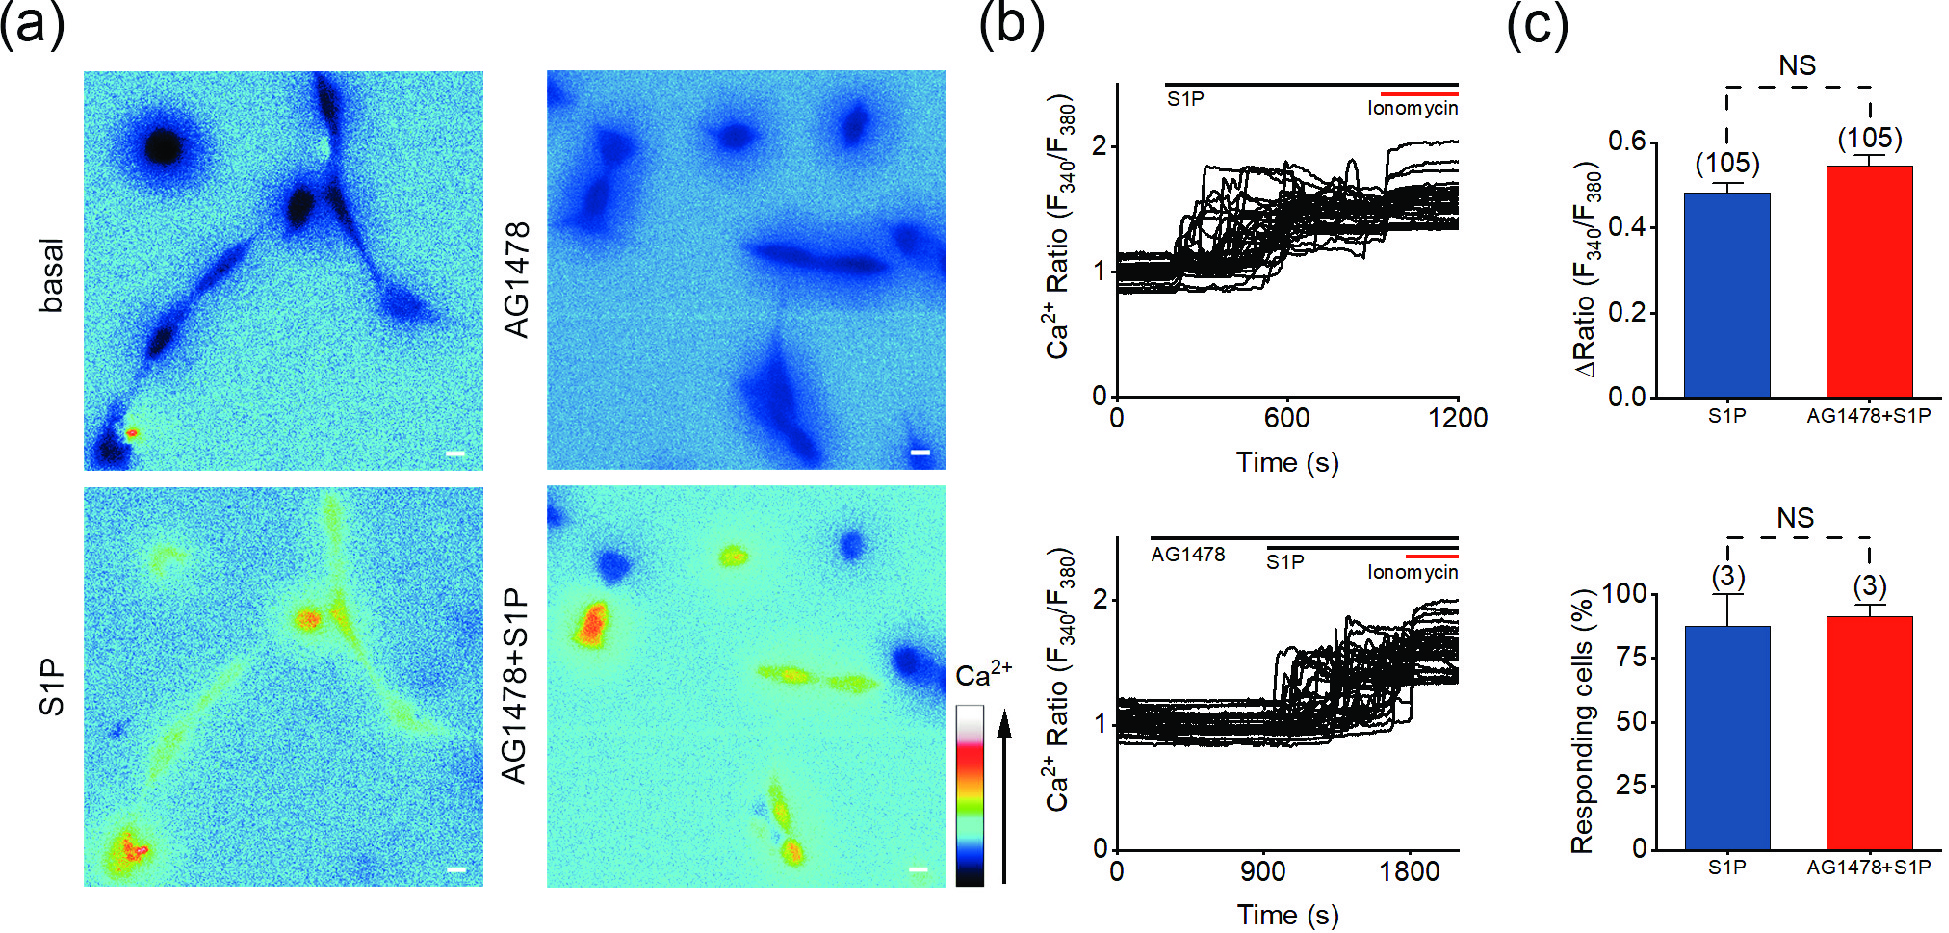
![]() S1P-induced Ca2+ response is independent of the transactivation of EGFR. (a) Representative pseudocolor images of F340/F380 in SH-SY5Y cells preincubated with 1 μmol/L AG1478 and treated with 10 μmol/L S1P. (b) Representative traces of calcium signals responding to 10 μmol/L S1P treatment in SH-SY5Y cells incubated with 1 μmol/L AG1478. (c) Statistics of the ΔRatio (F340/F380) and statistics of the percentage of responding cells. Scale bar = 10 μm. The data are presented as the means ± SEMs. NS indicates no significant difference.
S1P-induced Ca2+ response is independent of the transactivation of EGFR. (a) Representative pseudocolor images of F340/F380 in SH-SY5Y cells preincubated with 1 μmol/L AG1478 and treated with 10 μmol/L S1P. (b) Representative traces of calcium signals responding to 10 μmol/L S1P treatment in SH-SY5Y cells incubated with 1 μmol/L AG1478. (c) Statistics of the ΔRatio (F340/F380) and statistics of the percentage of responding cells. Scale bar = 10 μm. The data are presented as the means ± SEMs. NS indicates no significant difference.
-
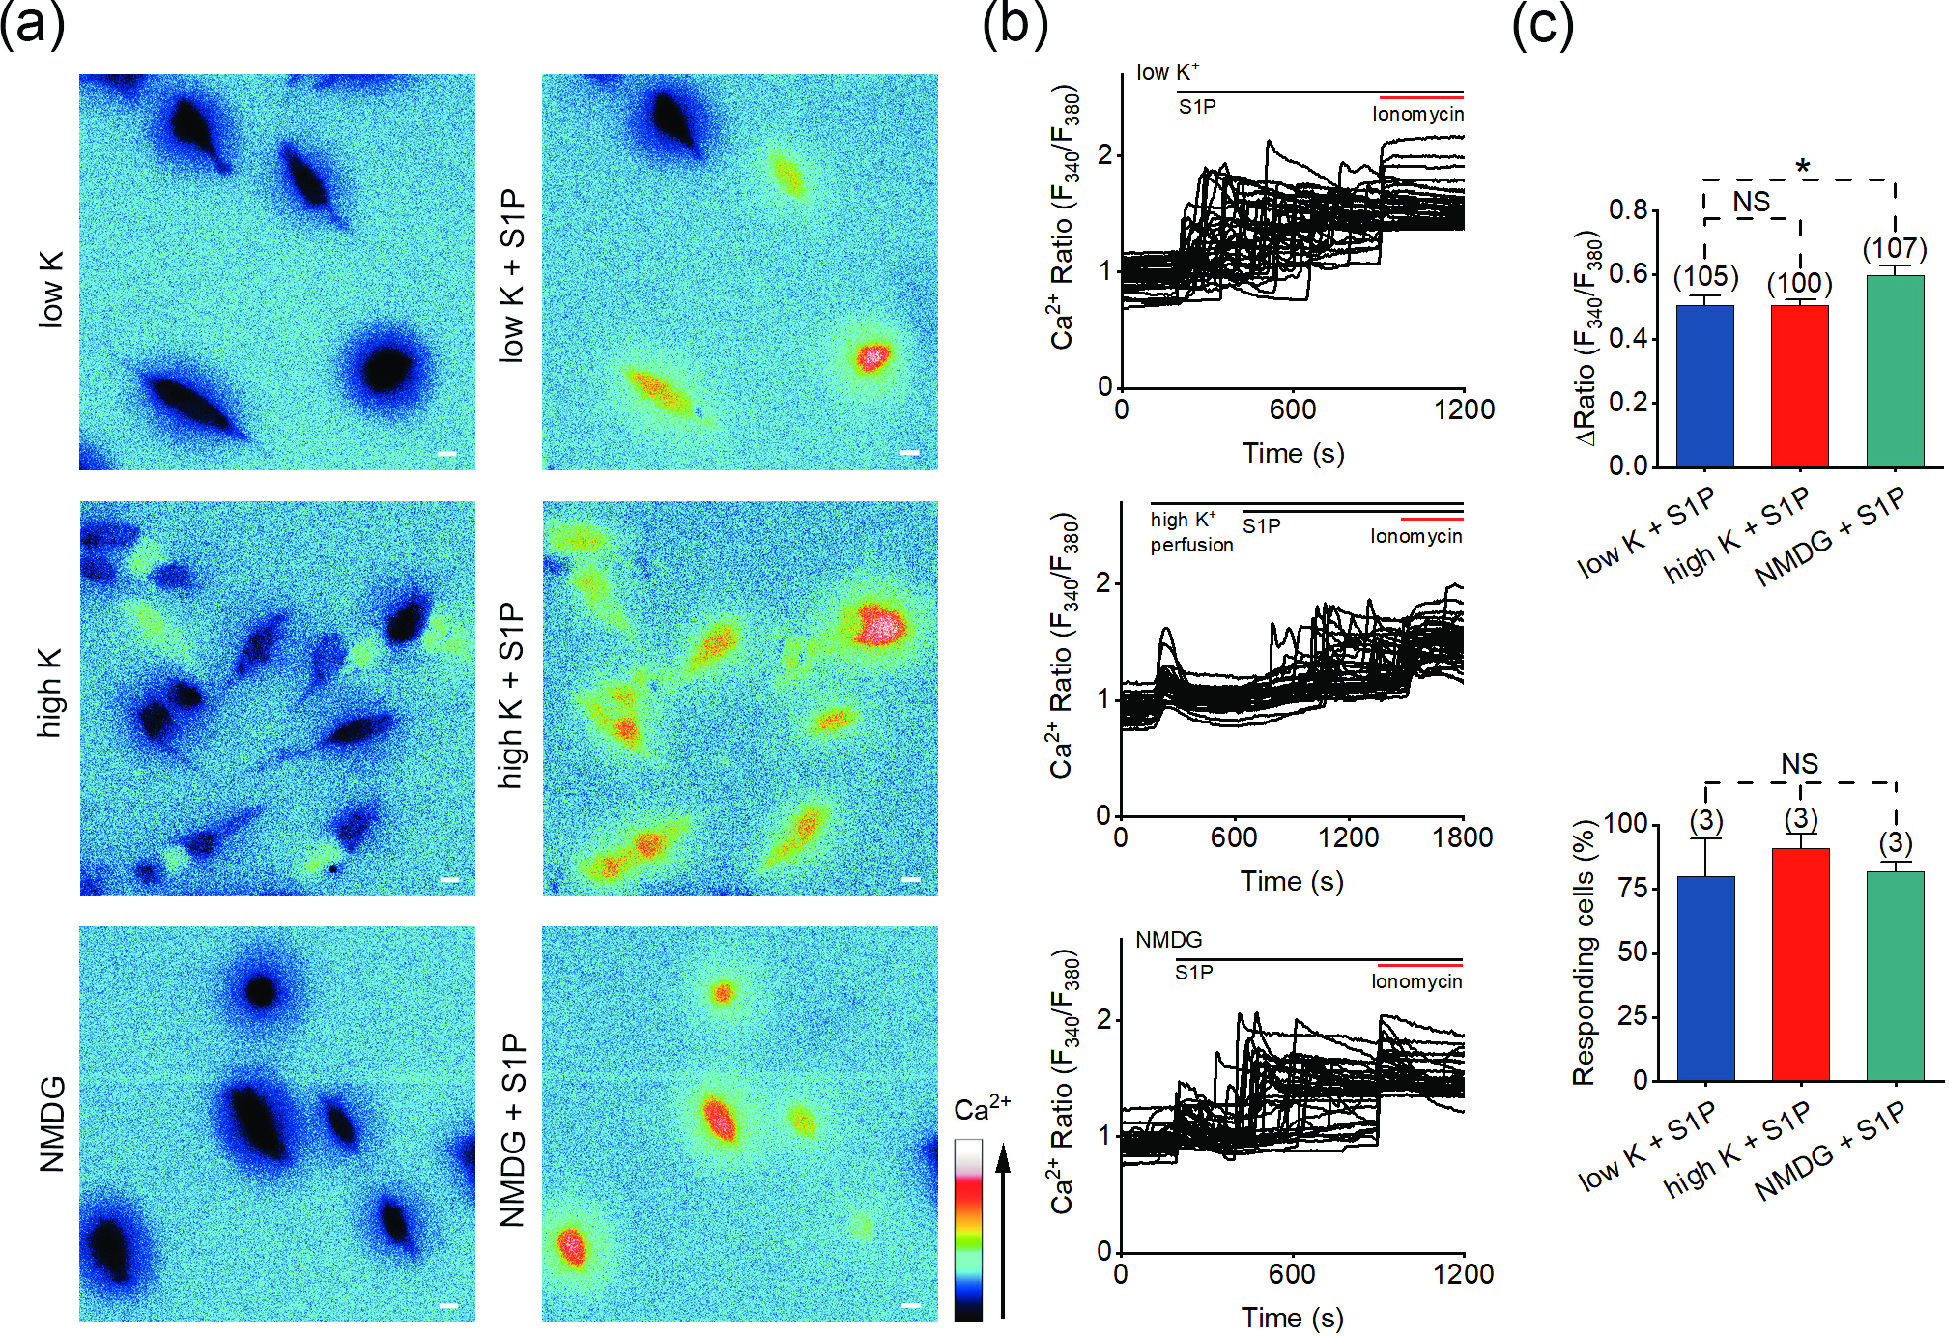
![]() S1P induces calcium signals in high-K+ solution and Na+-free solution. (a) Representative pseudocolor images of F340/F380 showing the S1P-induced calcium signals in SH-SY5Y cells with low-K+ (5.4 mmol/L; upper), high-K+ (100 mmol/L; middle) or Na+-free (lower) solution treatment. (b) Representative traces of calcium signals responding to low-K+ (upper), high-K+ (middle) or Na+-free (lower) treatment in SH-SY5Y cells. (c) Statistics of the ΔRatio (F340/F380; upper) and percentage of responding cells (ΔRatio > 0.2; lower) shown in (a) and (b). Scale bar = 10 μm. The data are presented as the means ± SEMs. *P < 0.05. NS indicates no significant difference.
S1P induces calcium signals in high-K+ solution and Na+-free solution. (a) Representative pseudocolor images of F340/F380 showing the S1P-induced calcium signals in SH-SY5Y cells with low-K+ (5.4 mmol/L; upper), high-K+ (100 mmol/L; middle) or Na+-free (lower) solution treatment. (b) Representative traces of calcium signals responding to low-K+ (upper), high-K+ (middle) or Na+-free (lower) treatment in SH-SY5Y cells. (c) Statistics of the ΔRatio (F340/F380; upper) and percentage of responding cells (ΔRatio > 0.2; lower) shown in (a) and (b). Scale bar = 10 μm. The data are presented as the means ± SEMs. *P < 0.05. NS indicates no significant difference.
-
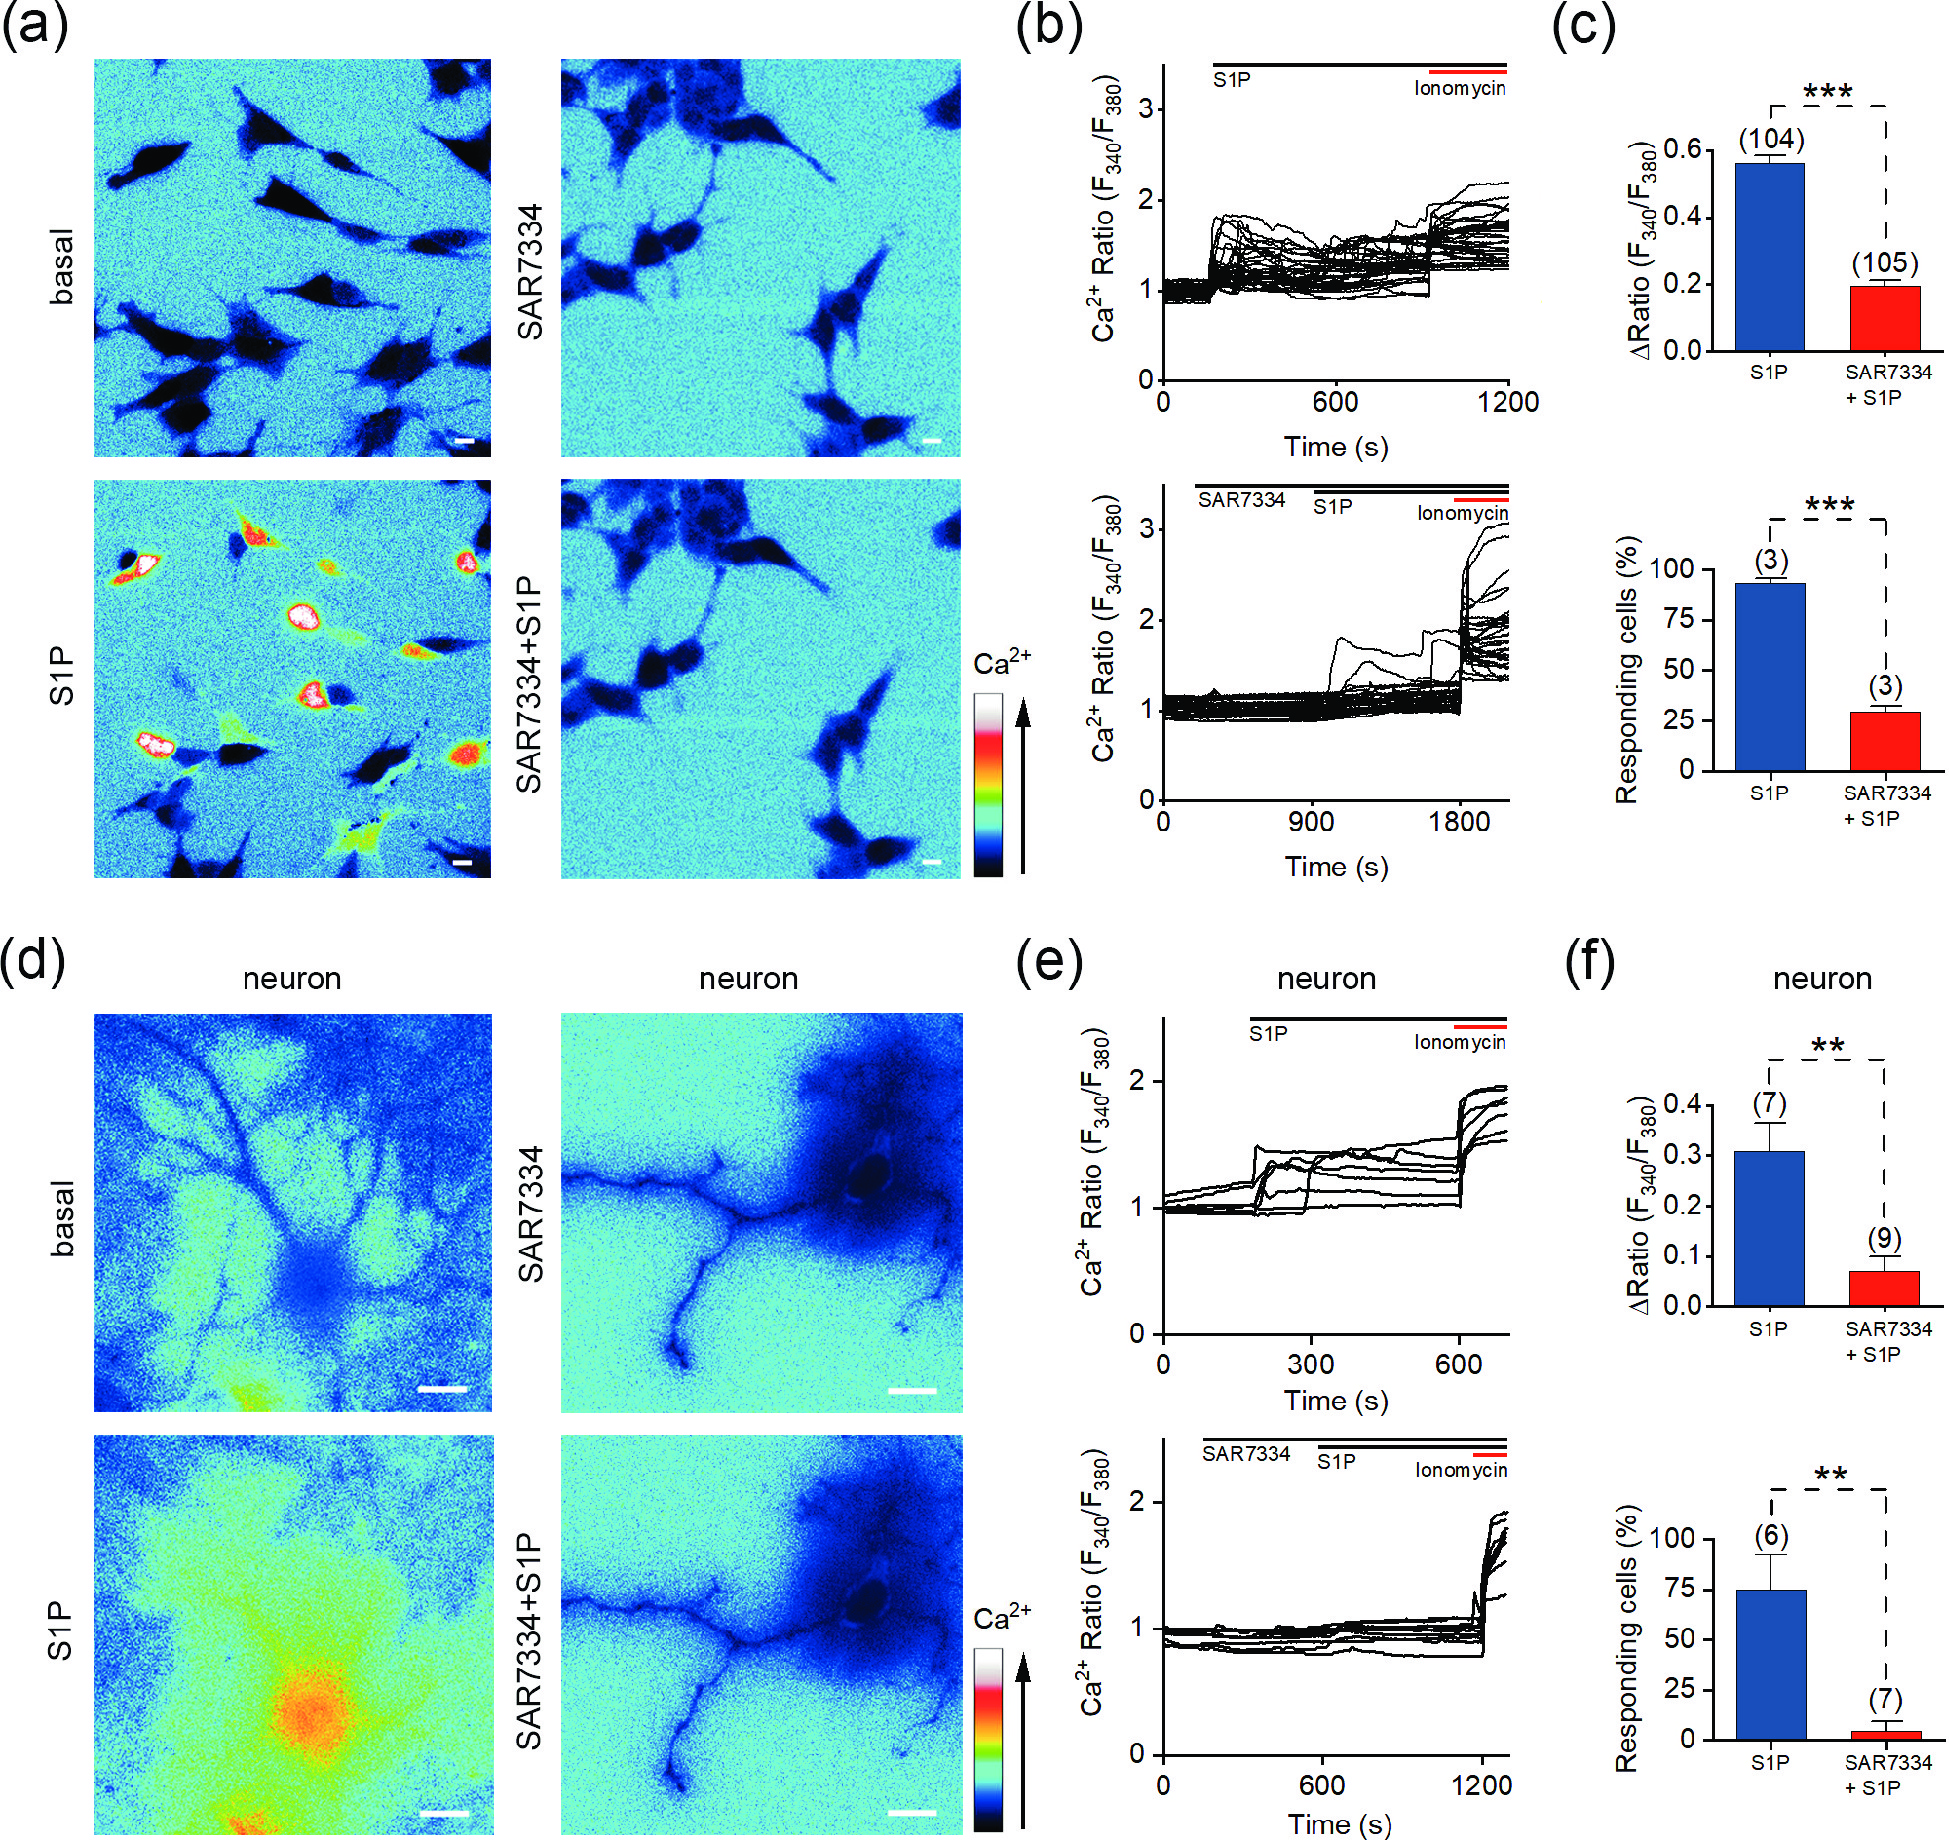
![]() S1P-induced Ca2+ mobilization is mediated by the TRPC6 channel in both SH-SY5Y cells and hippocampal neurons. (a) Representative pseudocolor images of F340/F380 showing the S1P-induced calcium signals in SH-SY5Y cells preincubated with vehicle (left) or 1 μmol/L SAR7334 (right). (b) Representative traces of calcium signals responding to 10 μmol/L S1P treatment in SH-SY5Y cells preincubated with vehicle (upper) or 1 μmol/L SAR7334 (lower). (c) Statistics of the ΔRatio (F340/F380; upper) and percentage of responding cells (ΔRatio > 0.2) shown in (a) and (b). (d) Representative pseudocolor images of F340/F380 showing the S1P-induced calcium signals in hippocampal neurons preincubated with vehicle (left) or 0.1 μmol/L SAR7334 (right). (e) Representative traces of calcium signals responding to 10 μmol/L S1P treatment in hippocampal neurons preincubated with vehicle (upper) or 0.1 μmol/L SAR7334 (lower). (f) Statistics of the ΔRatio (F340/F380; upper) and percentage of responding cells (ΔRatio > 0.2) shown in (c) and (d). Scale bar = 10 μm. The data are presented as the means ± SEMs. **P < 0.01, ***P < 0.001.
S1P-induced Ca2+ mobilization is mediated by the TRPC6 channel in both SH-SY5Y cells and hippocampal neurons. (a) Representative pseudocolor images of F340/F380 showing the S1P-induced calcium signals in SH-SY5Y cells preincubated with vehicle (left) or 1 μmol/L SAR7334 (right). (b) Representative traces of calcium signals responding to 10 μmol/L S1P treatment in SH-SY5Y cells preincubated with vehicle (upper) or 1 μmol/L SAR7334 (lower). (c) Statistics of the ΔRatio (F340/F380; upper) and percentage of responding cells (ΔRatio > 0.2) shown in (a) and (b). (d) Representative pseudocolor images of F340/F380 showing the S1P-induced calcium signals in hippocampal neurons preincubated with vehicle (left) or 0.1 μmol/L SAR7334 (right). (e) Representative traces of calcium signals responding to 10 μmol/L S1P treatment in hippocampal neurons preincubated with vehicle (upper) or 0.1 μmol/L SAR7334 (lower). (f) Statistics of the ΔRatio (F340/F380; upper) and percentage of responding cells (ΔRatio > 0.2) shown in (c) and (d). Scale bar = 10 μm. The data are presented as the means ± SEMs. **P < 0.01, ***P < 0.001.
-
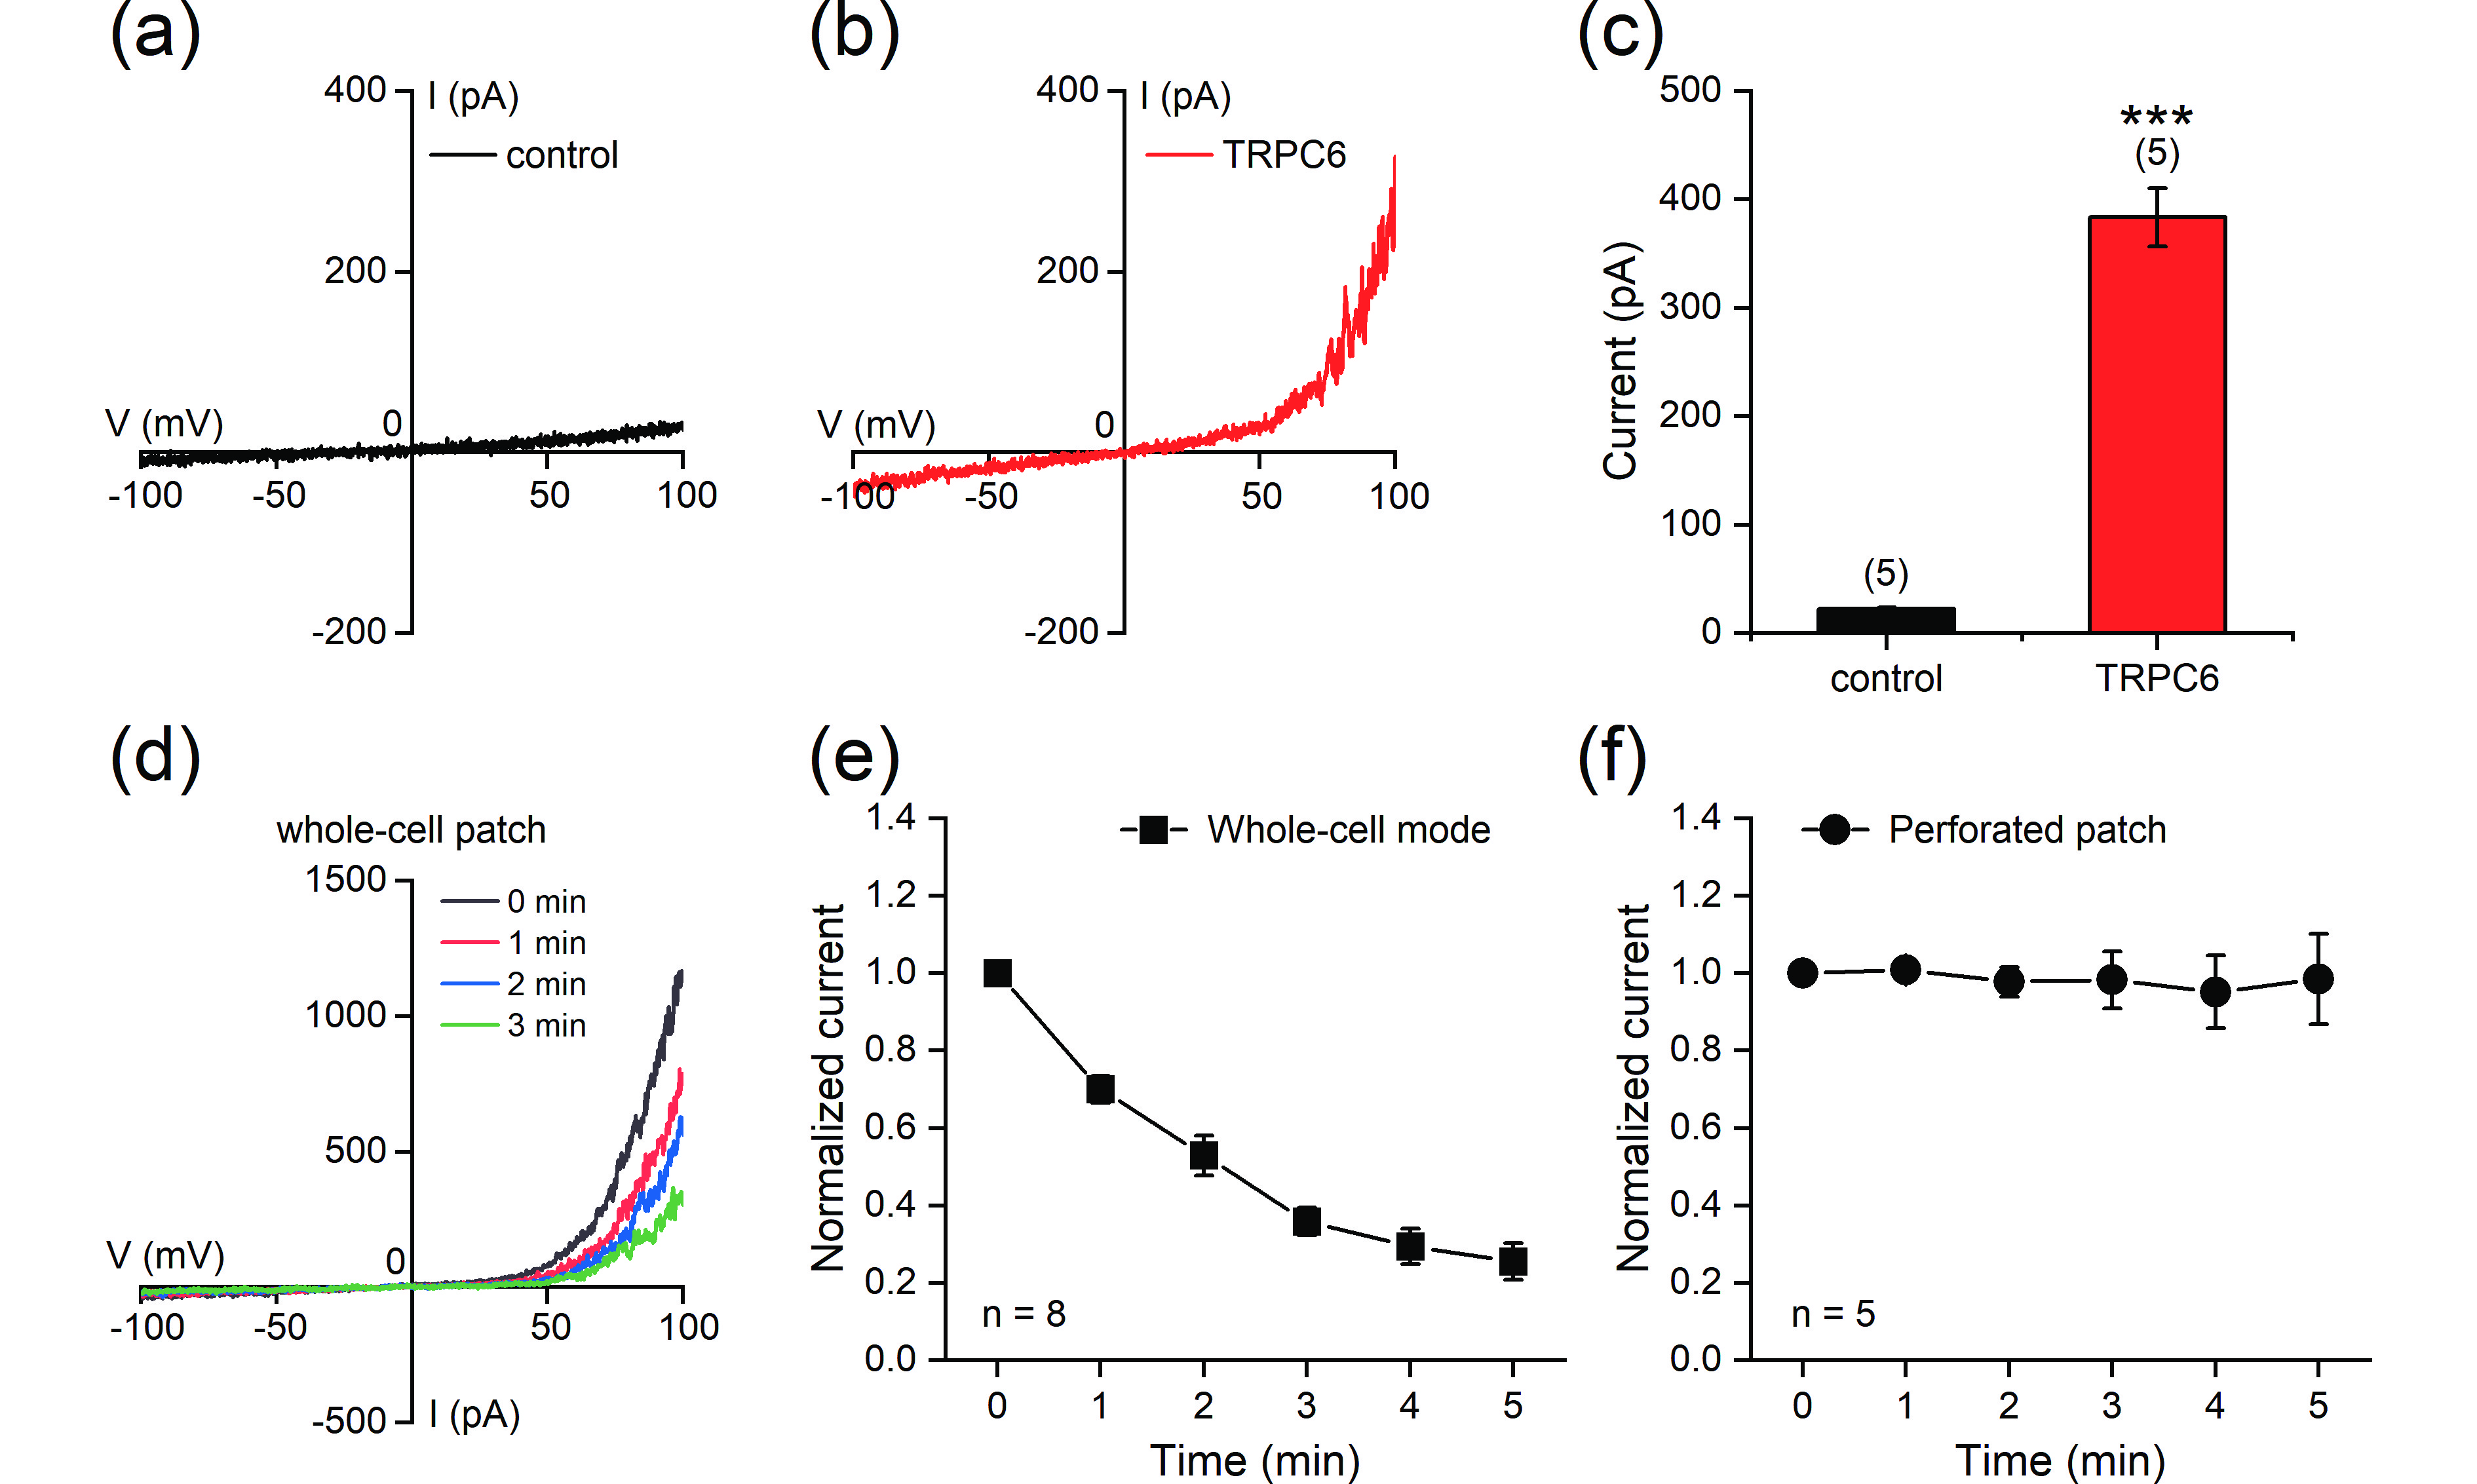
![]() Reconstitution of the TRPC6 current in HEK293T cells. (a, b) Representative whole-cell currents recorded in HEK293T cells transfected with empty vector (a) or TRPC6 (b). The currents were elicited with ramp protocols (−100 mV to +100 mV in 1 s). (c) Current amplitudes measured at +100 mV. (d) Representative currents recorded using whole-cell patch-clamp in TRPC6-transfected HEK293T cells at different time points after the start of recording. (e, f) Stability of the currents under whole-cell patch-clamp mode (e) or perforated patch-clamp mode (f). The current amplitudes (measured at +100 mV) at different time points were normalized to the values at the start of recordings. The data are presented as the means ± SEMs. ***P < 0.001.
Reconstitution of the TRPC6 current in HEK293T cells. (a, b) Representative whole-cell currents recorded in HEK293T cells transfected with empty vector (a) or TRPC6 (b). The currents were elicited with ramp protocols (−100 mV to +100 mV in 1 s). (c) Current amplitudes measured at +100 mV. (d) Representative currents recorded using whole-cell patch-clamp in TRPC6-transfected HEK293T cells at different time points after the start of recording. (e, f) Stability of the currents under whole-cell patch-clamp mode (e) or perforated patch-clamp mode (f). The current amplitudes (measured at +100 mV) at different time points were normalized to the values at the start of recordings. The data are presented as the means ± SEMs. ***P < 0.001.
-
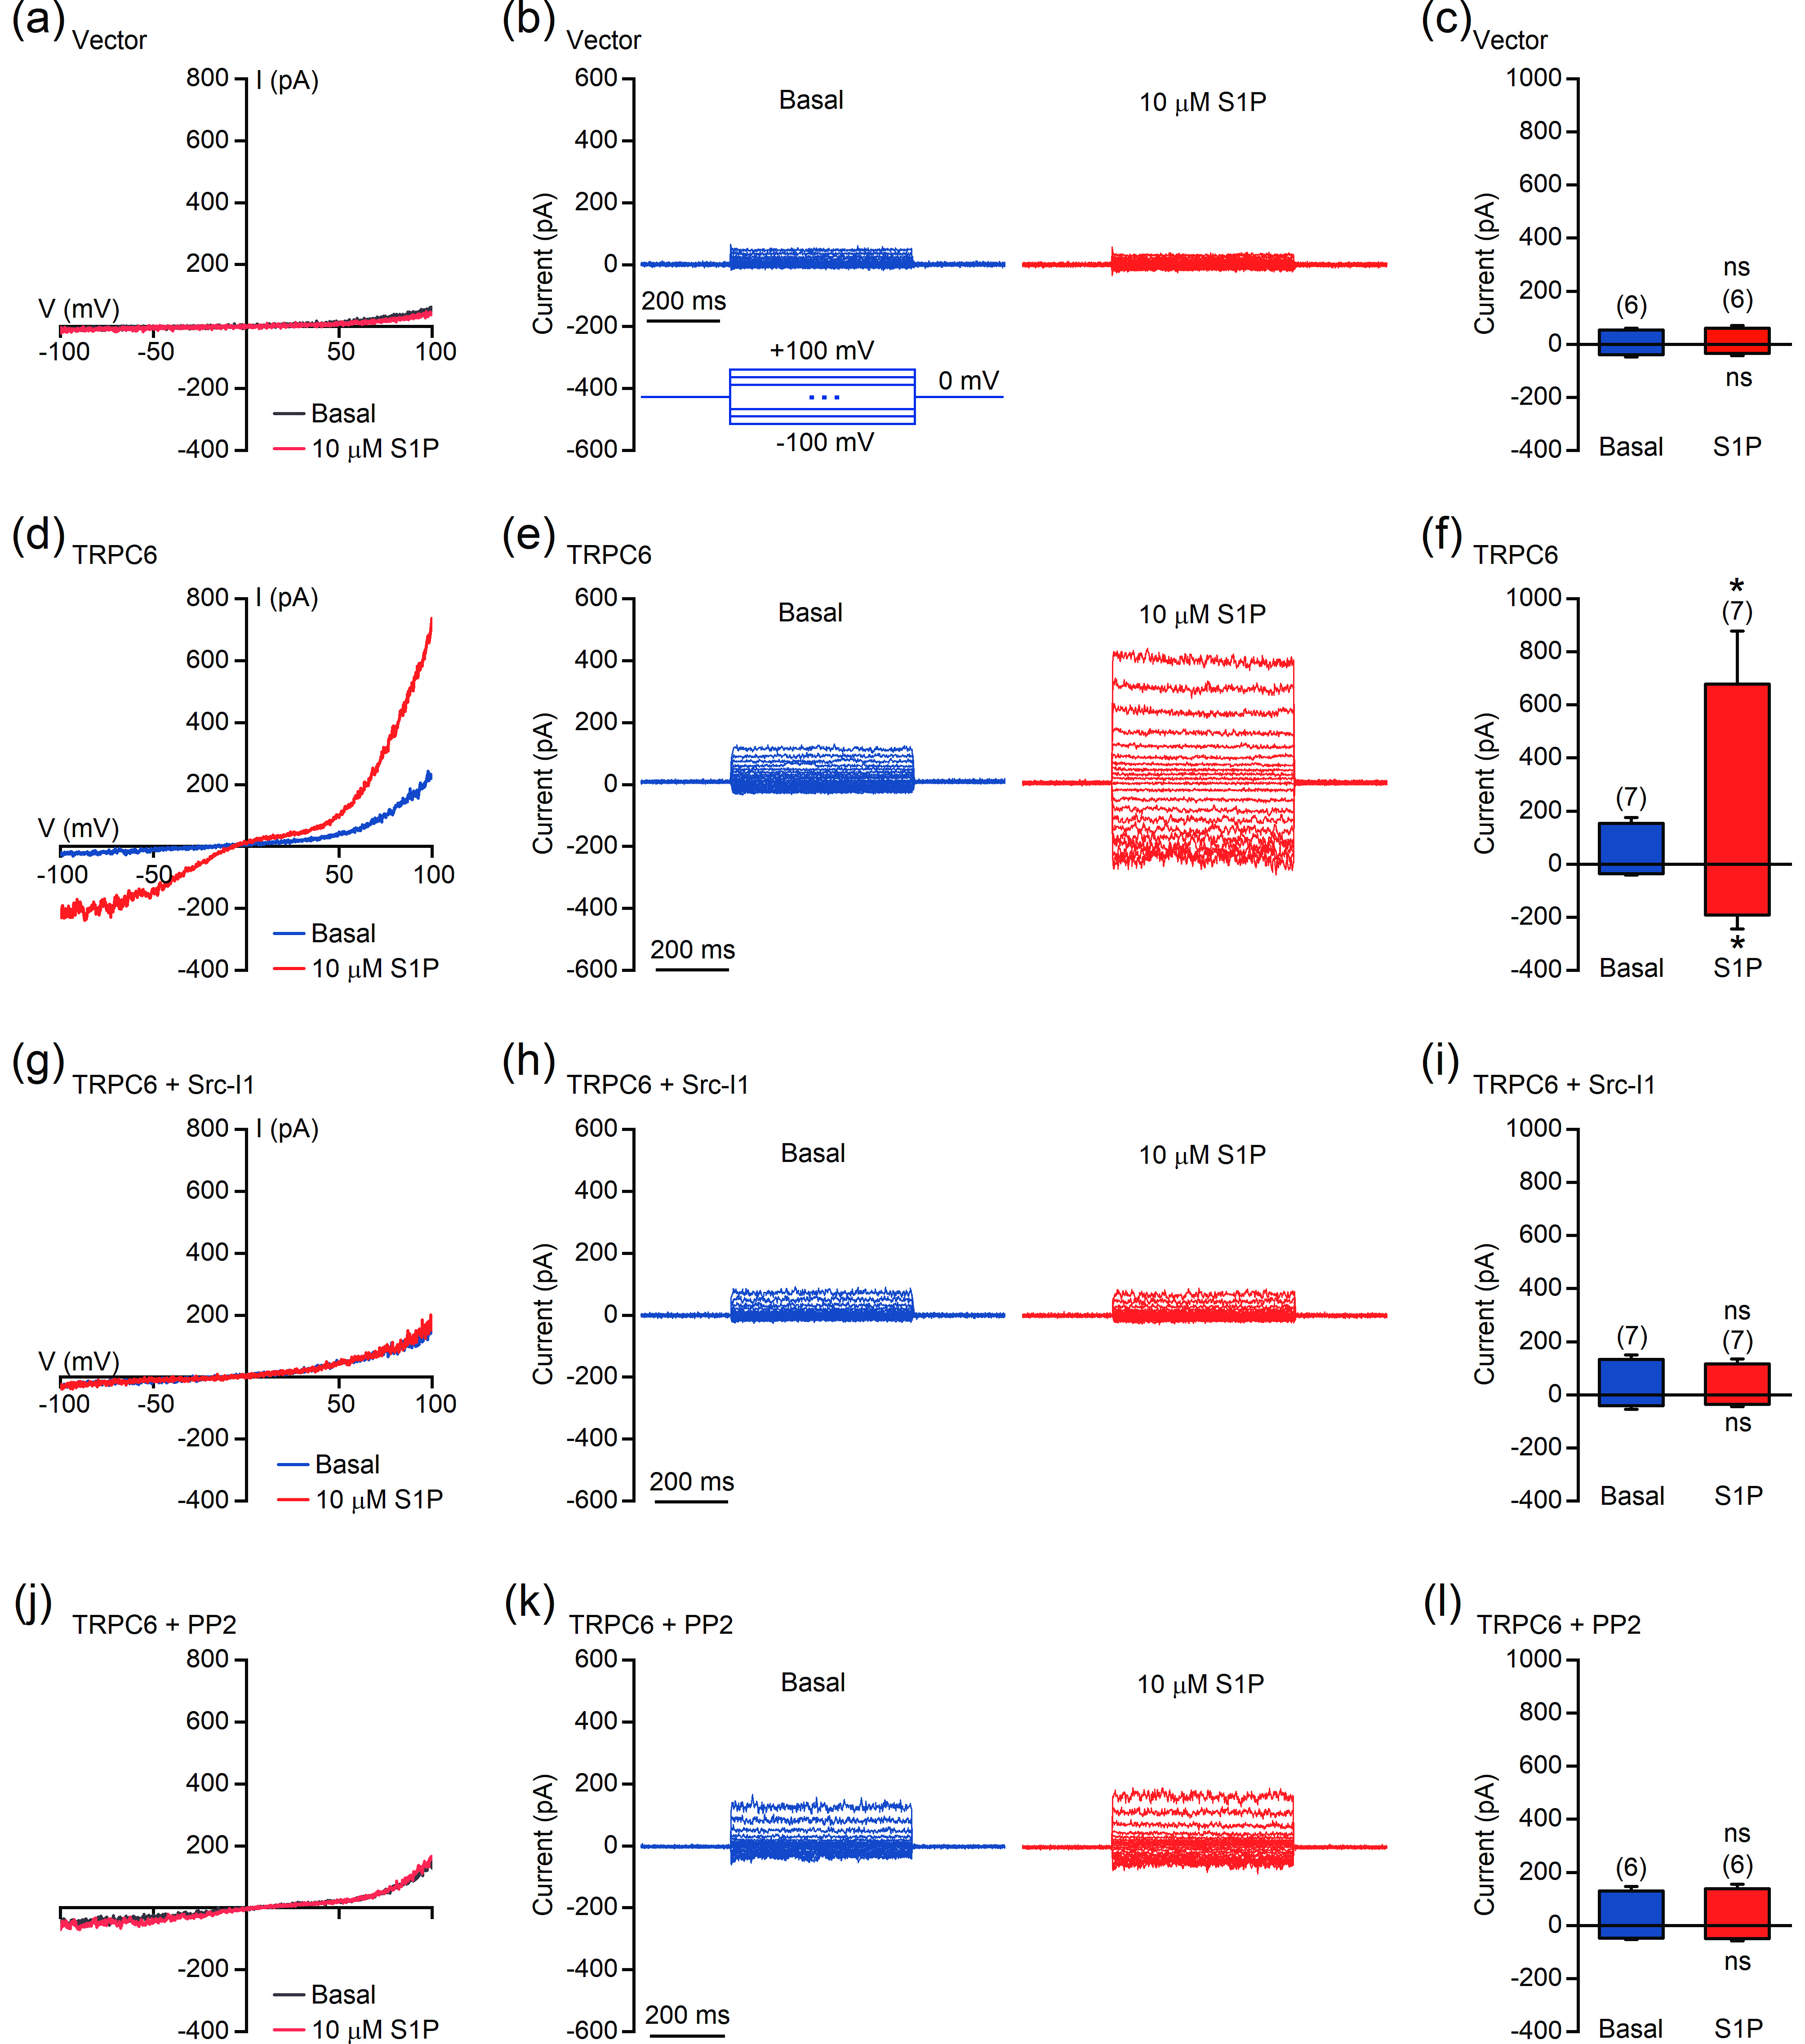
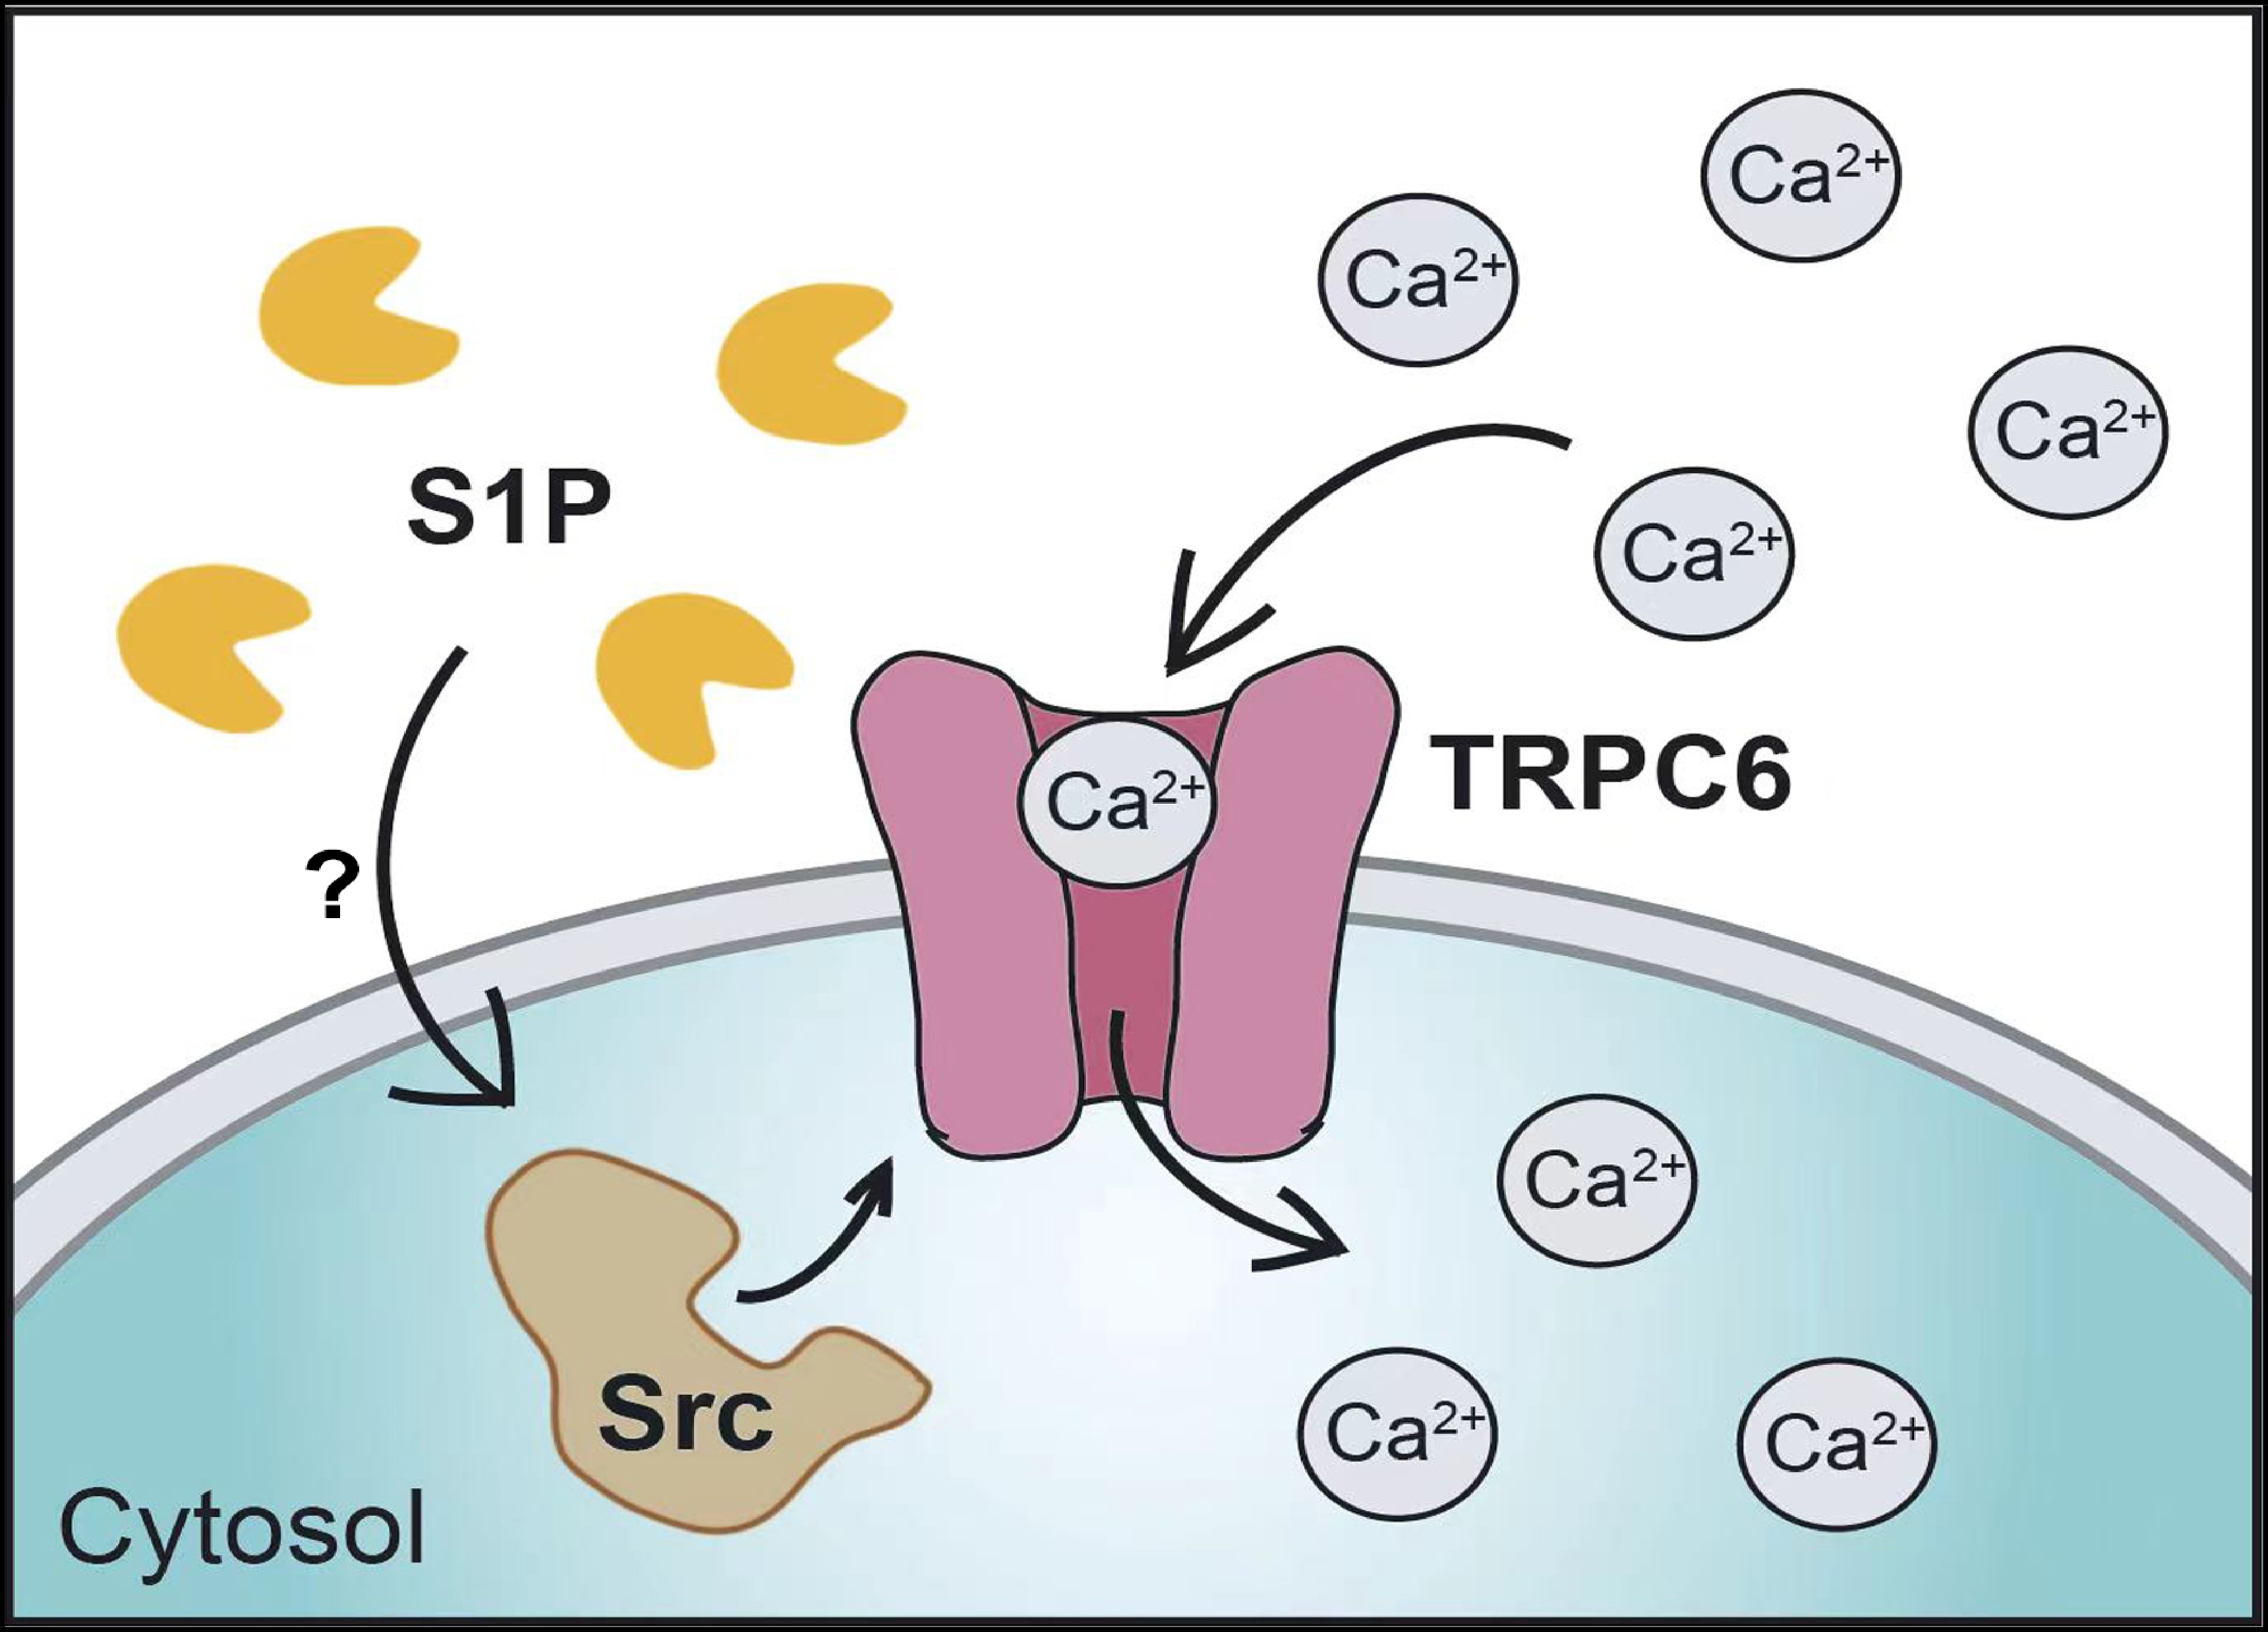
![]() S1P activates TRPC6 in a Src-dependent manner. (a–l) Perforated patch-clamp recordings were performed in HEK293T cells transfected with empty vector (a–c) or TRPC6 (d–i). Cells used in (g–l) were treated with 2 μmol/L Src-I1 (g–i) or 1 μmol/L PP2 (j–l) for 10 min before recording. (a, d, g, and j) Representative currents recorded with ramp protocols (−100 to +100 mV in 1 s). (b, e, h, and k) Representative currents recorded with step protocols (250 ms step pulses from −100 to +100 mV, 10 mV step; Vh = 0 mV). (c, f, i, and l) Amplitudes of the inward and outward currents shown in (a), (d), (g), and (j), respectively. The data are presented as the means ± SEMs. *P < 0.05. NS indicates no significant difference.
S1P activates TRPC6 in a Src-dependent manner. (a–l) Perforated patch-clamp recordings were performed in HEK293T cells transfected with empty vector (a–c) or TRPC6 (d–i). Cells used in (g–l) were treated with 2 μmol/L Src-I1 (g–i) or 1 μmol/L PP2 (j–l) for 10 min before recording. (a, d, g, and j) Representative currents recorded with ramp protocols (−100 to +100 mV in 1 s). (b, e, h, and k) Representative currents recorded with step protocols (250 ms step pulses from −100 to +100 mV, 10 mV step; Vh = 0 mV). (c, f, i, and l) Amplitudes of the inward and outward currents shown in (a), (d), (g), and (j), respectively. The data are presented as the means ± SEMs. *P < 0.05. NS indicates no significant difference.