
 Download:
Figures of the Article
-
![]() Analysis of basic information of three Acetobacteraceae strains. (a) Photograph of the cellulose films produced by the three test strains after 4 d of incubation in 50 mL centrifuge tubes. (b) Dry weights of the cellulose films formed by the three test strains after 4 d of incubation in 12-well plates. The division times (c) and growth curves (d) of the three test strains during static incubation. The growth curves (e) and division times (f) of the three test strains during shaking incubation. The error bars represent the means ± SDs; n = 3, 4; ns = not significant; ** P ≤ 0.01; *** P ≤ 0.001; **** P ≤
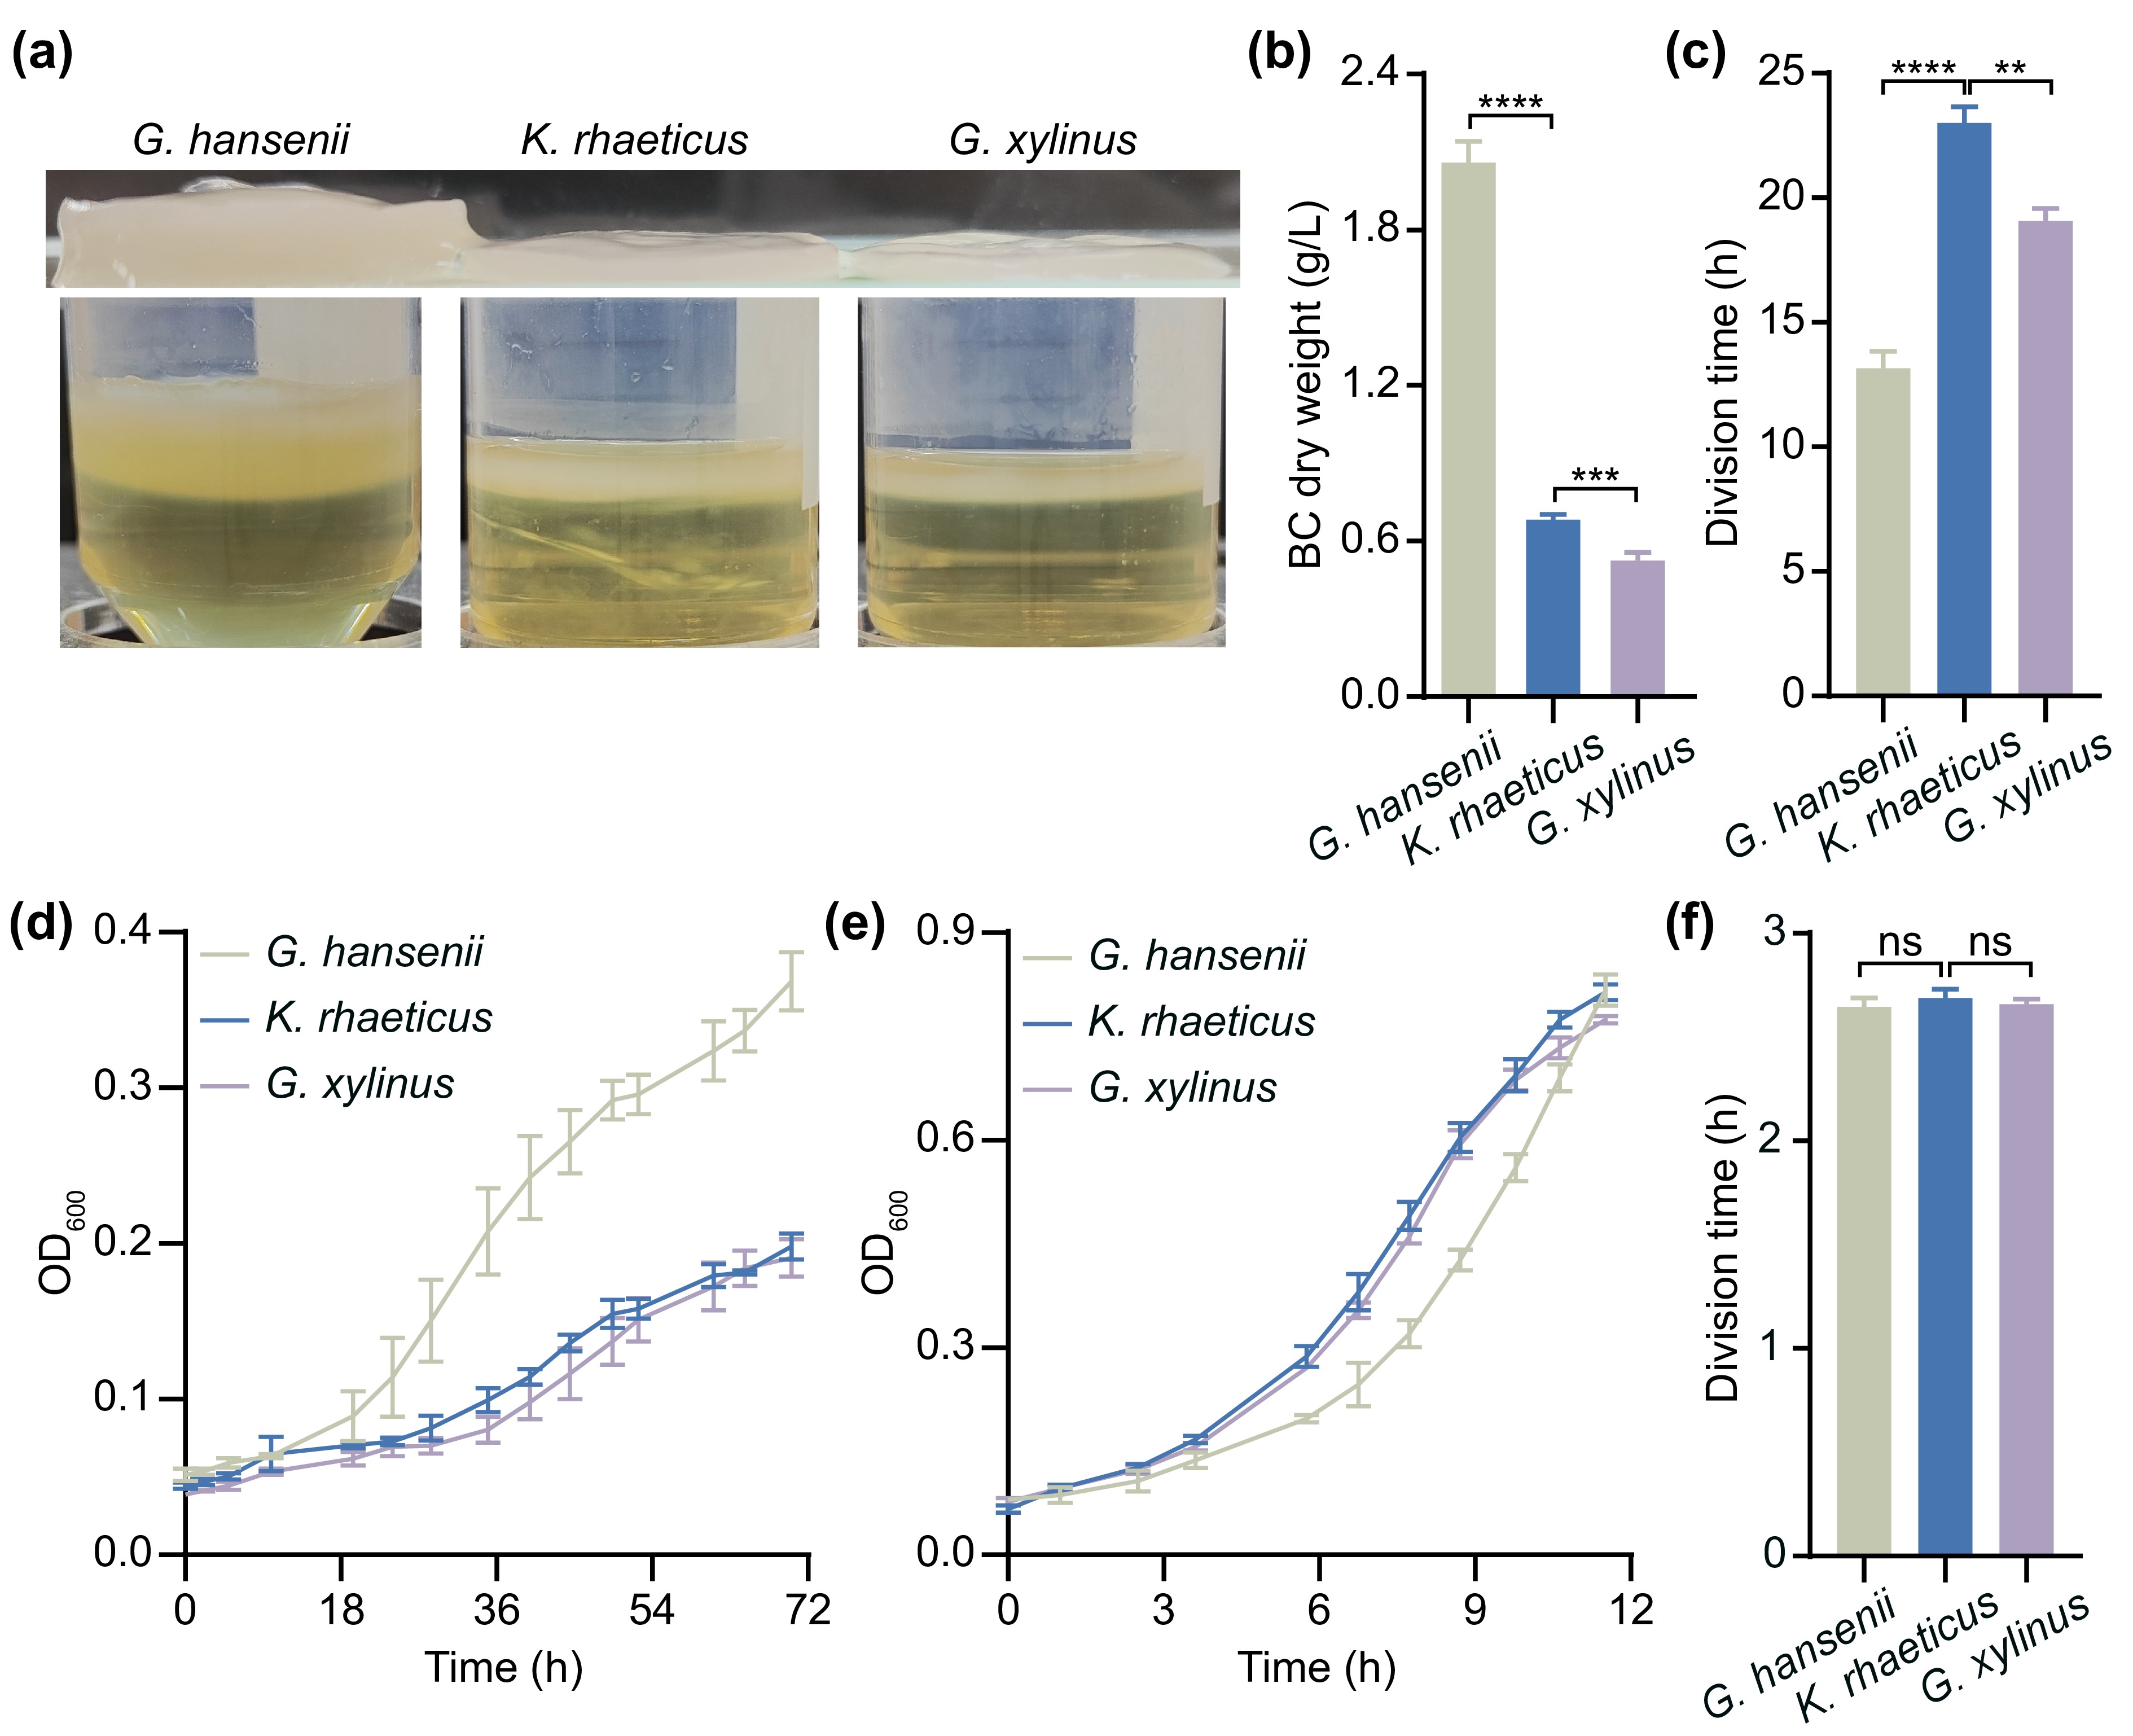
Analysis of basic information of three Acetobacteraceae strains. (a) Photograph of the cellulose films produced by the three test strains after 4 d of incubation in 50 mL centrifuge tubes. (b) Dry weights of the cellulose films formed by the three test strains after 4 d of incubation in 12-well plates. The division times (c) and growth curves (d) of the three test strains during static incubation. The growth curves (e) and division times (f) of the three test strains during shaking incubation. The error bars represent the means ± SDs; n = 3, 4; ns = not significant; ** P ≤ 0.01; *** P ≤ 0.001; **** P ≤0.0001 (Student’s t test). -
![]() Plasmid features analysis. (a) Minimum inhibitory concentrations (MICs) of seven antibiotics against the three test strains. R indicates that the test strains can grow in HS broth containing
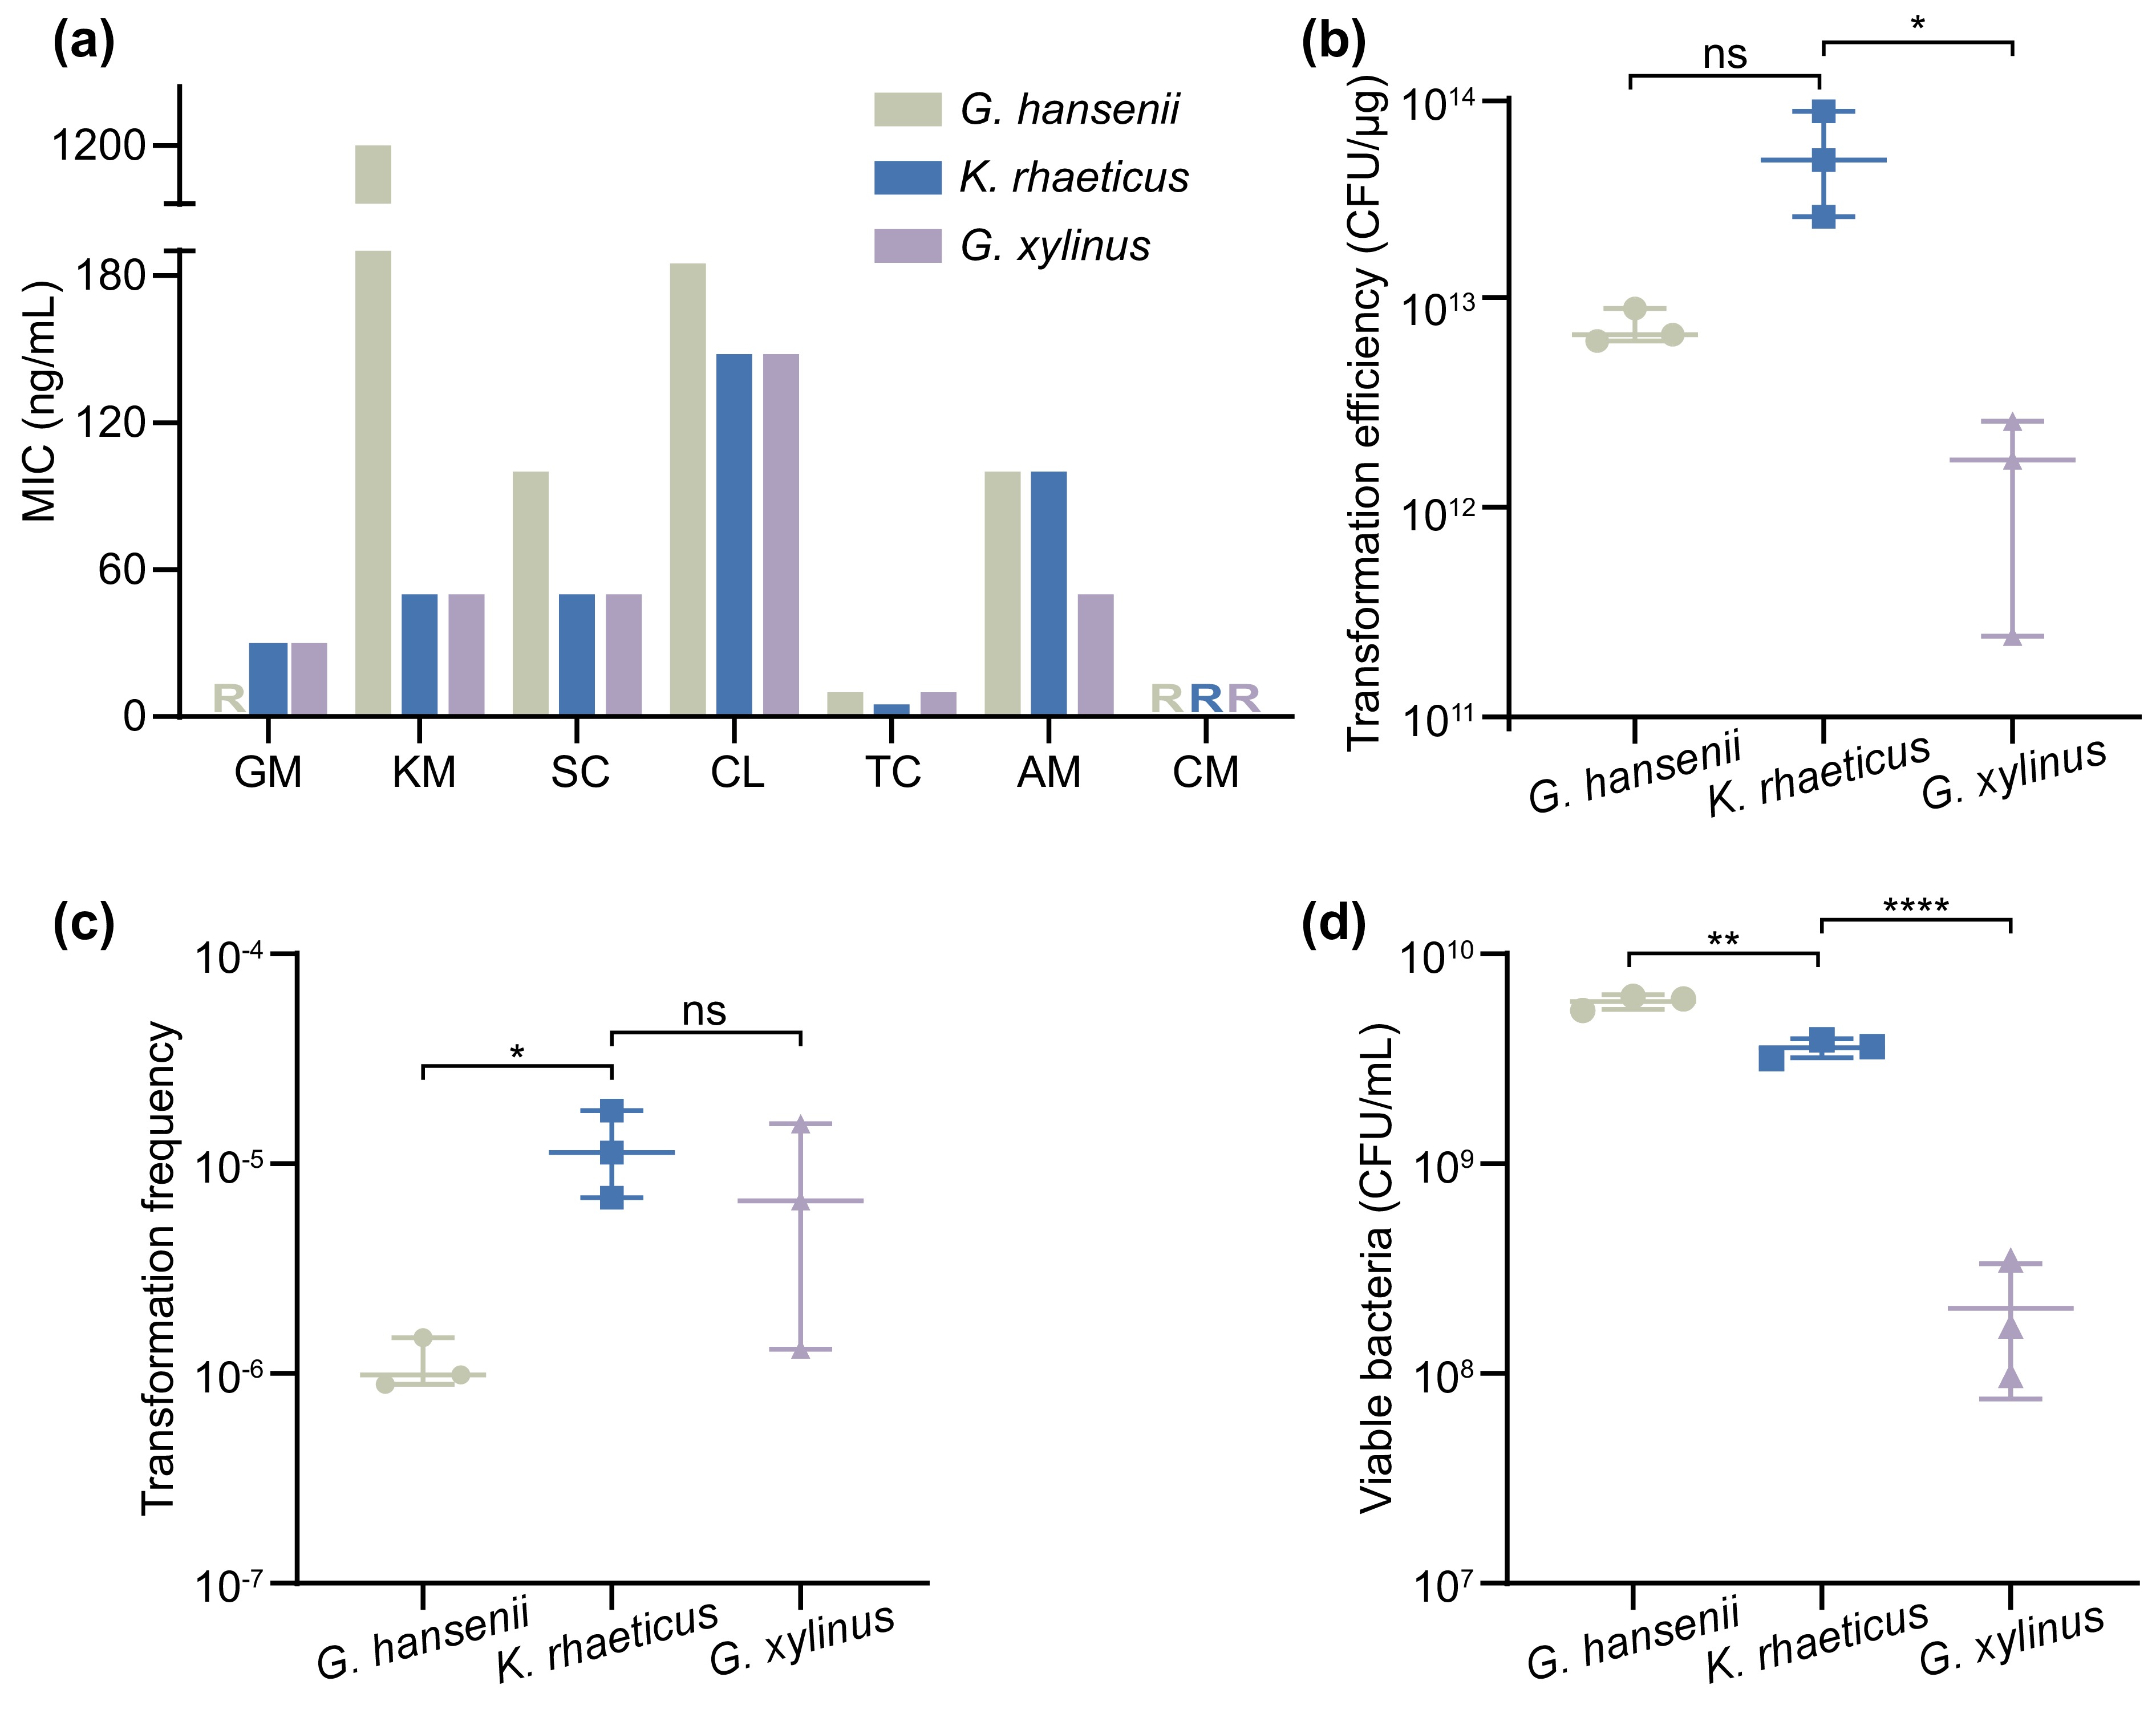
Plasmid features analysis. (a) Minimum inhibitory concentrations (MICs) of seven antibiotics against the three test strains. R indicates that the test strains can grow in HS broth containing 1200 ng/mL antibiotics; GM, KM, SC, CL, TC, AM, and CM represent gentamicin, kanamycin, spectinomycin, chloramphenicol, tetracycline, ampicillin, and carbenicillin, respectively. Plasmid transformation efficiency (b) and frequency (c) of the three test strains. (d) Enumeration of surviving three test strains on HS agar plates after electroporation. The error bars represent the means ± SDs; n = 3; ns = not significant; *P ≤ 0.05; ** P ≤ 0.01; **** P ≤0.0001 (Student’s t test). -
![]() Plasmid replication and stability analysis. Electropherograms of replicable (a) and stabilizable (b) origins of plasmid replication within the three test strains. M refers to the DNA marker, and R1, V01, C01, P10, and 15a represent the plasmid replication origins pBBR1, pMV01, pSC101, pCrep101, and p15a, respectively. (c) Merged image of the strains in panel a after three months of static culture at room temperature; scale bar, 5 µm.
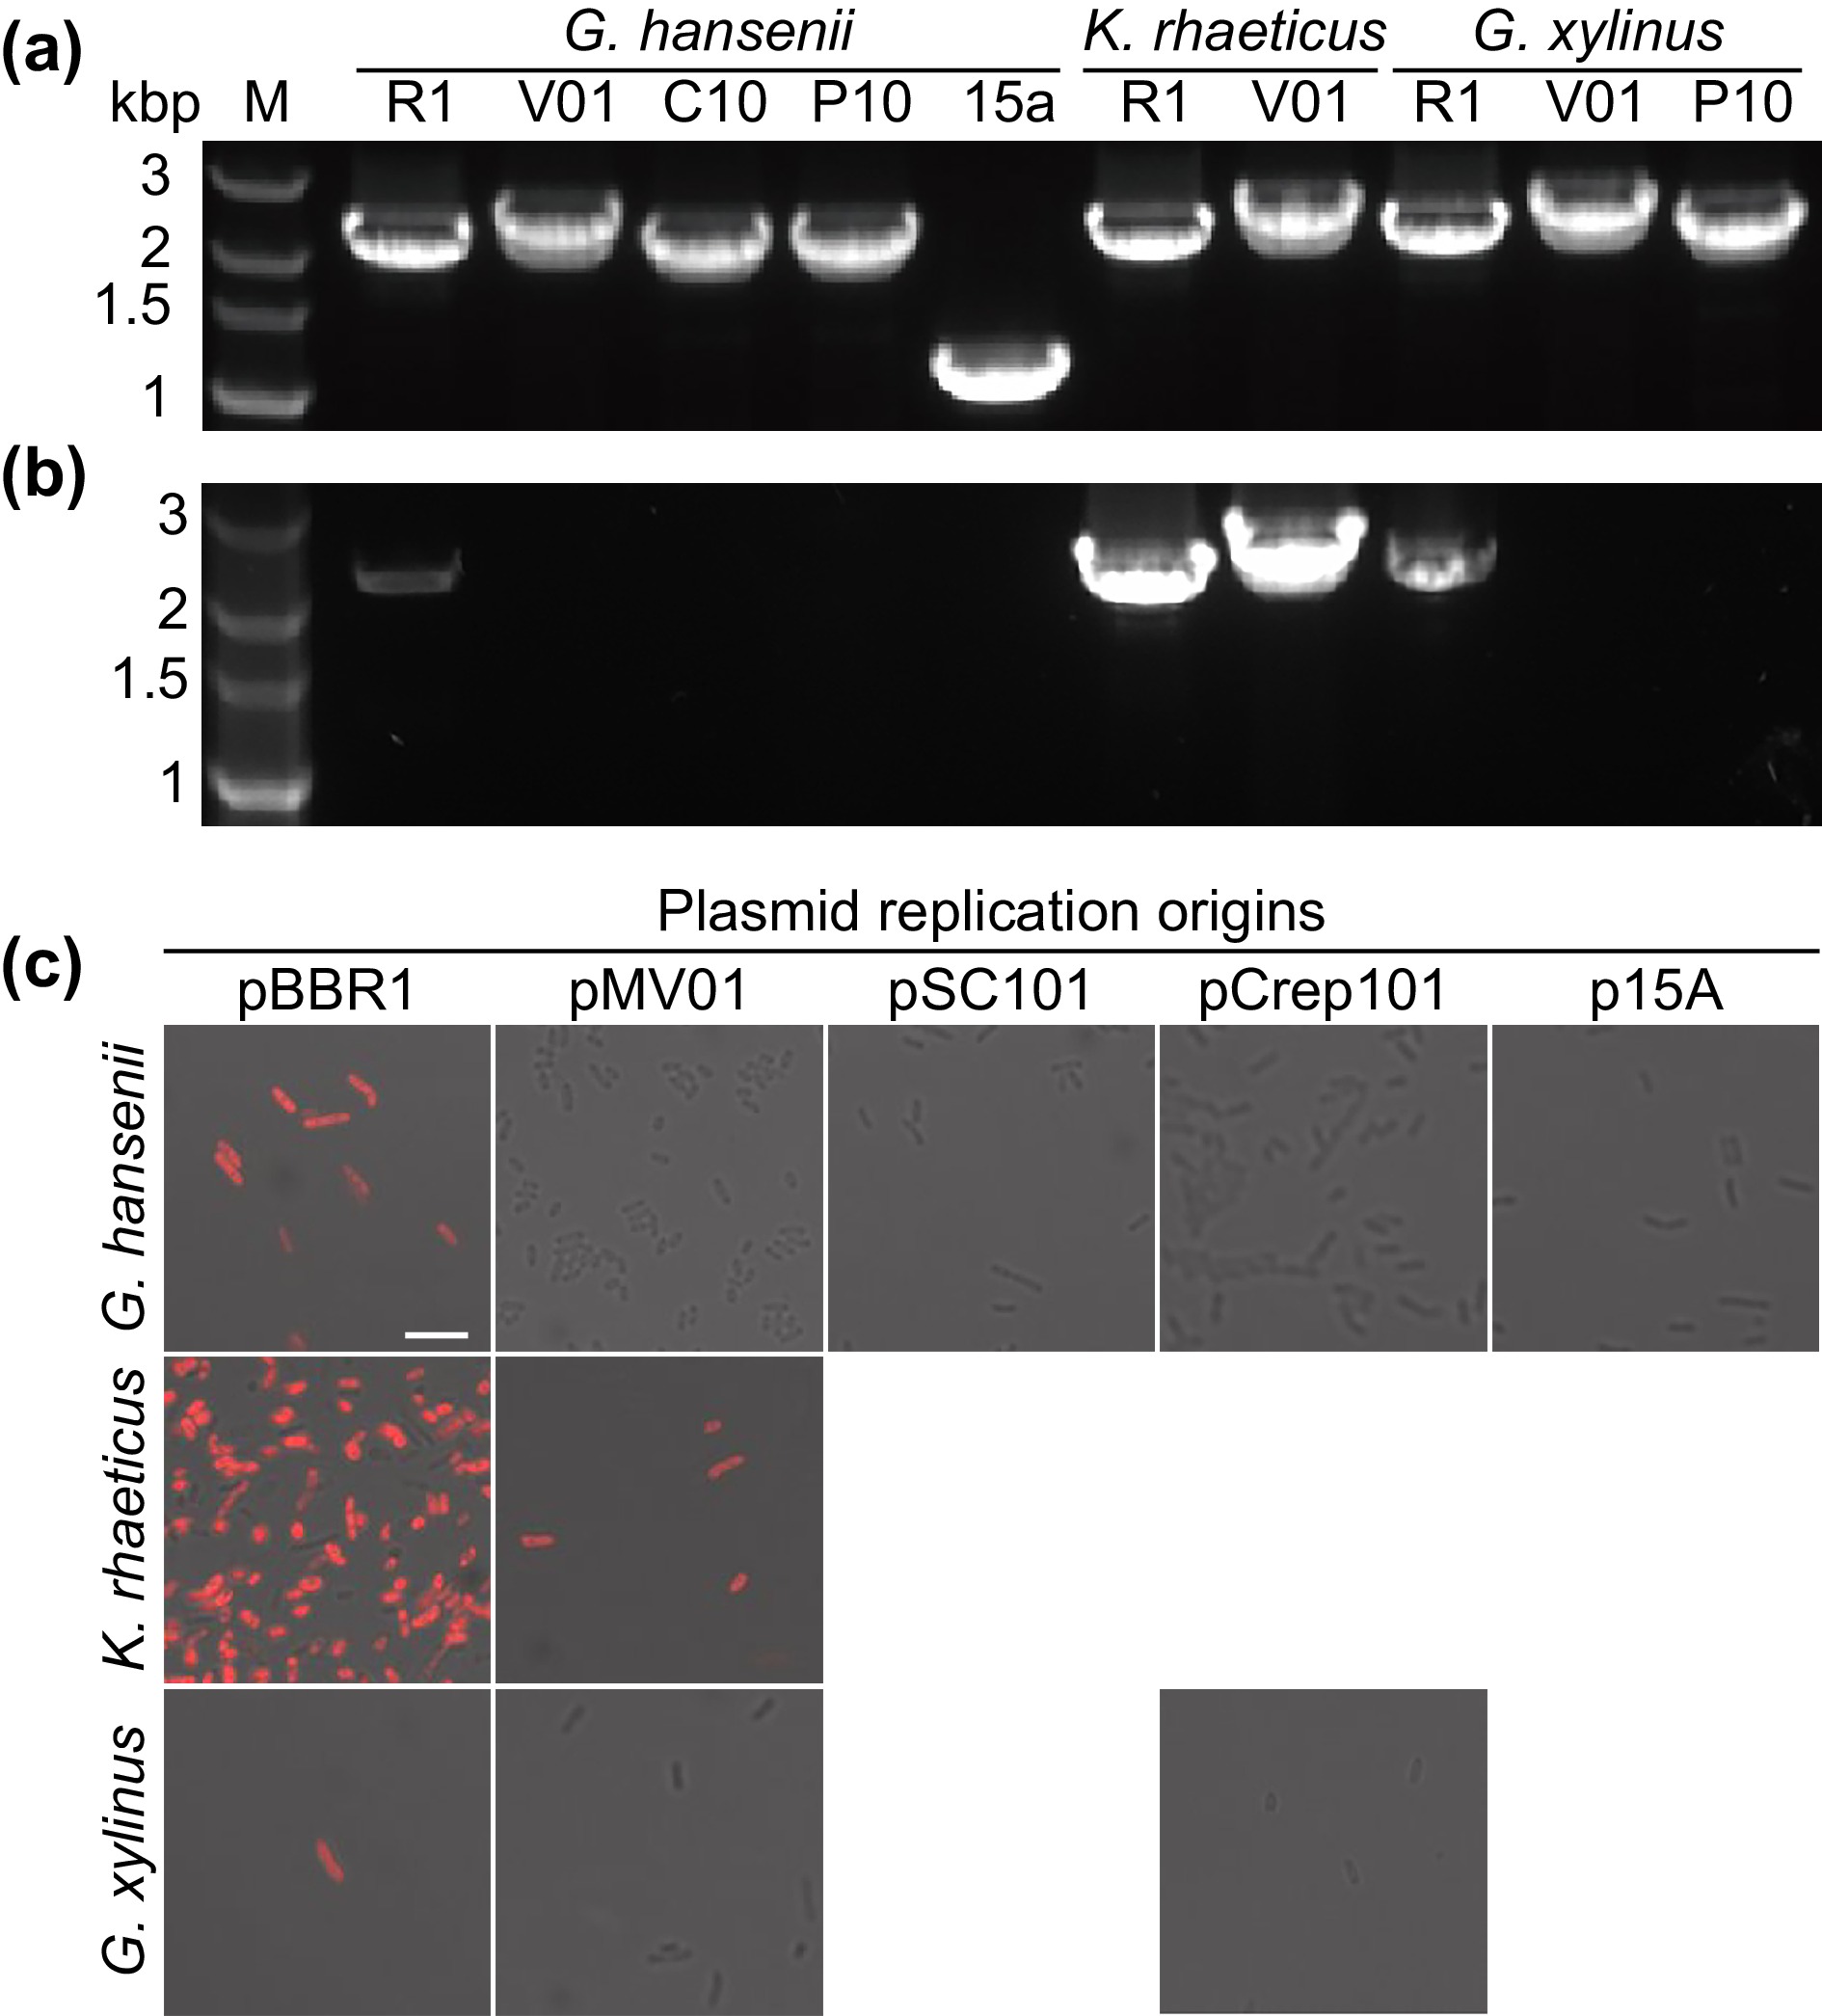
Plasmid replication and stability analysis. Electropherograms of replicable (a) and stabilizable (b) origins of plasmid replication within the three test strains. M refers to the DNA marker, and R1, V01, C01, P10, and 15a represent the plasmid replication origins pBBR1, pMV01, pSC101, pCrep101, and p15a, respectively. (c) Merged image of the strains in panel a after three months of static culture at room temperature; scale bar, 5 µm.
-
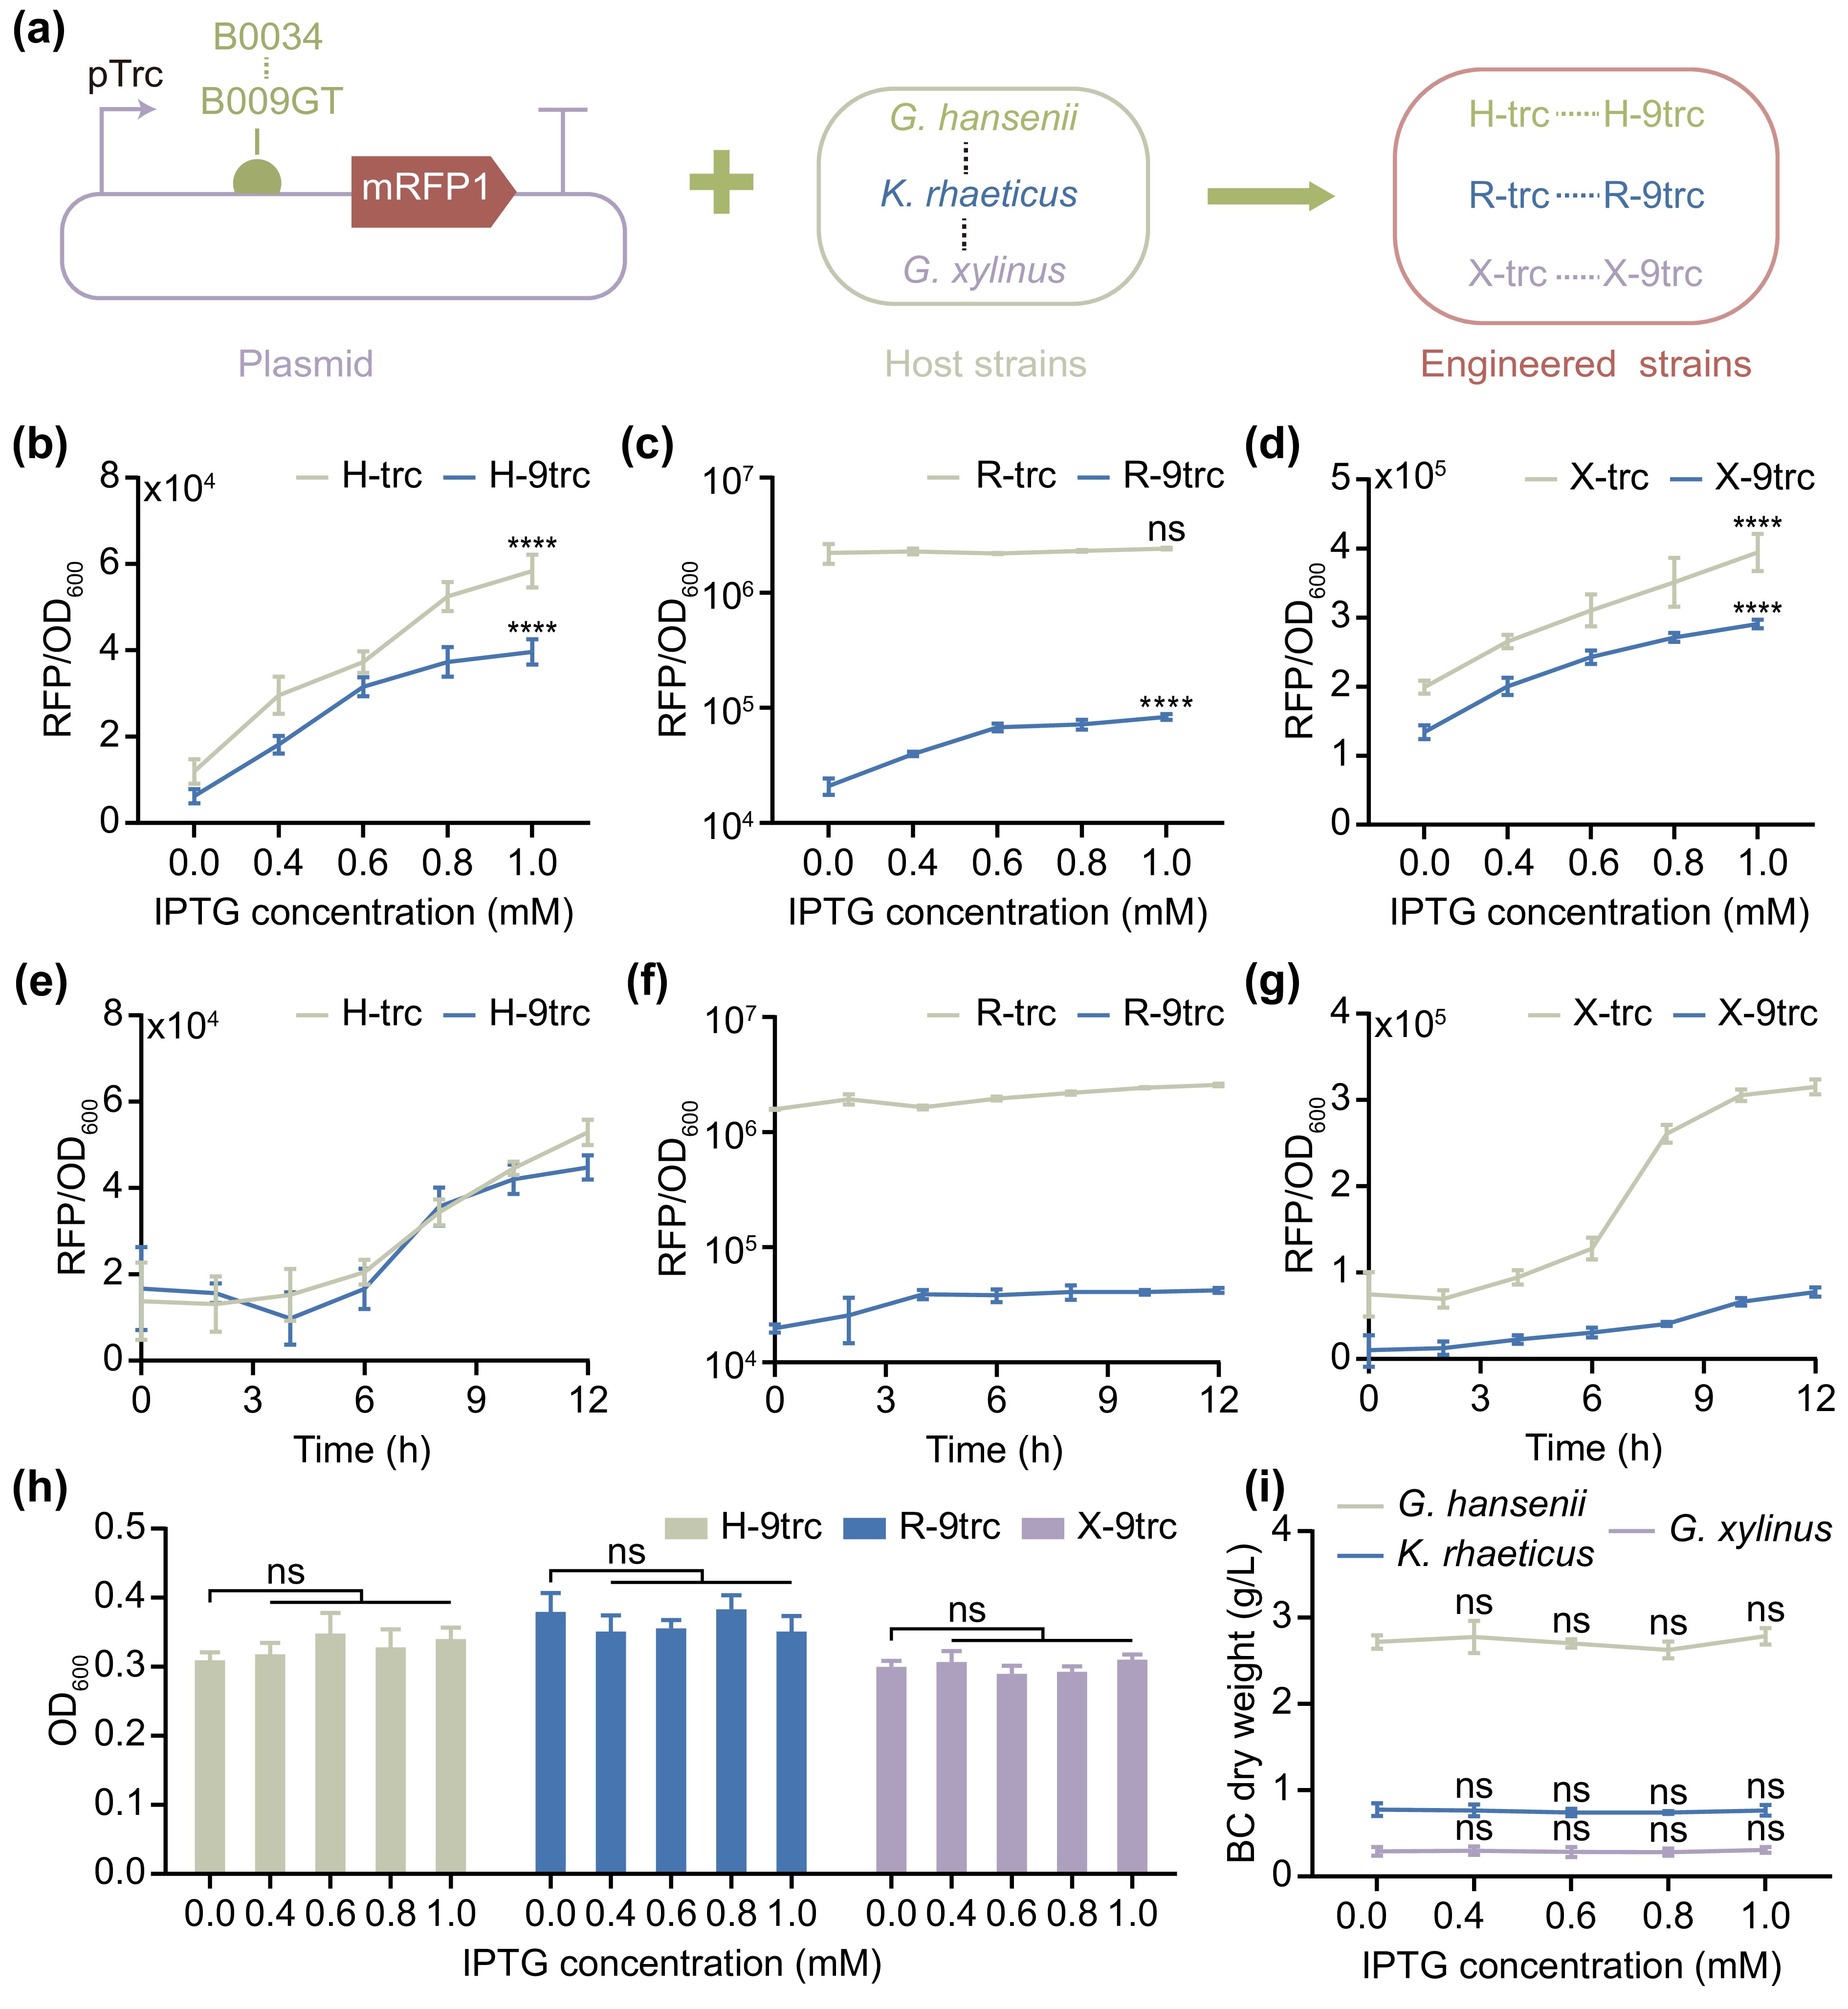
![]() Characterization of the promoter pTrc. (a) Schematic diagram of the engineered strains carrying the pTrc promoter that was tested. Dose response of the inducible promoter pTrc in G. hansenii ATCC
Characterization of the promoter pTrc. (a) Schematic diagram of the engineered strains carrying the pTrc promoter that was tested. Dose response of the inducible promoter pTrc in G. hansenii ATCC 53582 (b), K. rhaeticus iGEM (c) and G. xylinus700178 (d) to varying IPTG concentrations and RBS intensities after 12 h of induction. (e) Induction curves of the H-trc and H-9trc strains at a 1.0 mM IPTG concentration. (f) Induction curves of the R-trc and R-9trc strains at a 1.0 mM IPTG concentration. (g) Induction curves of the X-trc and X-9trc strains at a 1.0 mM IPTG concentration. (h) OD600 values of strains H-9trc, R-9trc and X-9trc after incubation in HS++ containing different IPTG concentrations for 12 h. (i) The dry weights of BC films from G. hansenii ATCC53582 , K. rhaeticus iGEM, and G. xylinus700178 incubated in HS++ broth with varying IPTG concentrations. The error bars represent the means ± SDs; n = 3, 4, significant differences among the control group (IPTG concentration of 0 mM) and the other groups were computed via one-way ANOVA; ns = not significant; **** P ≤ 0.0001. -
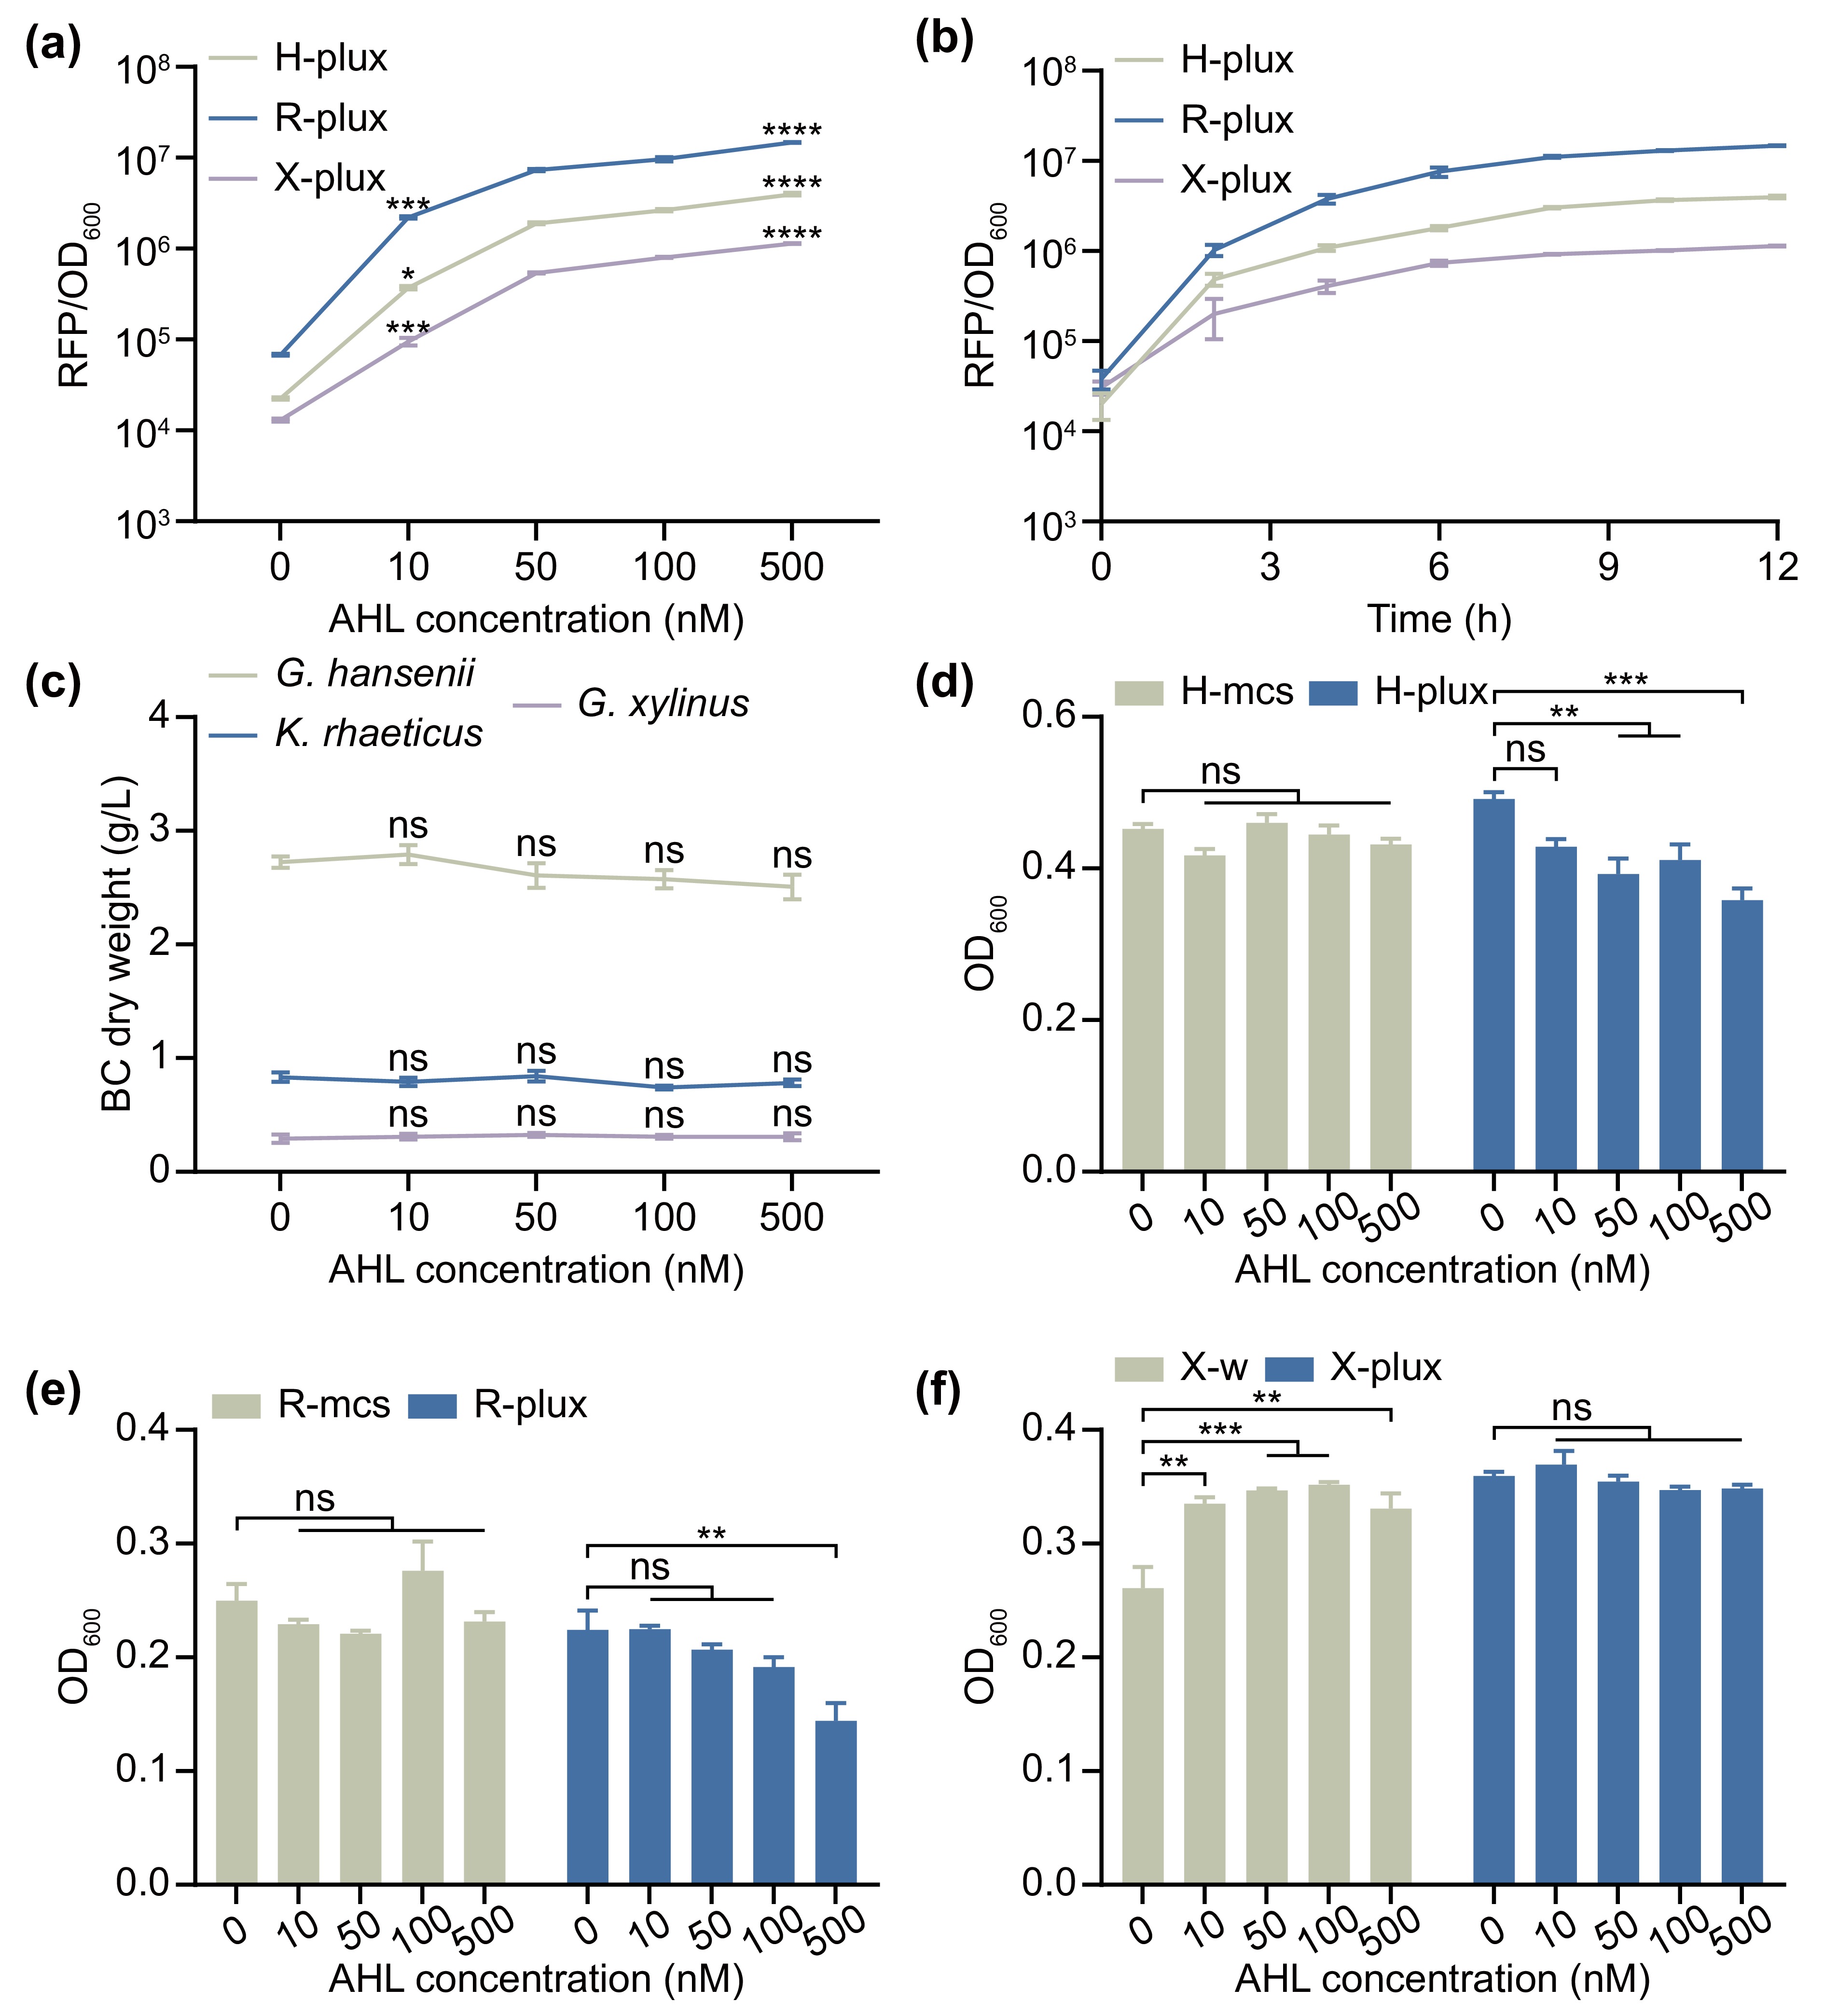
![]() Characterization of the promoter pLux101. (a) Dose response of the H-plux, R-plux, and X-plux strains to different concentrations of AHL after 12 h of induction. (b) Induction curves of the H-plux, R-plux, and X-plux strains at a concentration of 500 nM AHL. (c) BC dry weight films from the G. hansenii ATCC
Characterization of the promoter pLux101. (a) Dose response of the H-plux, R-plux, and X-plux strains to different concentrations of AHL after 12 h of induction. (b) Induction curves of the H-plux, R-plux, and X-plux strains at a concentration of 500 nM AHL. (c) BC dry weight films from the G. hansenii ATCC 53582 , K. rhaeticus iGEM, and G. xylinus700178 strains after incubation in HS++ broth with varying AHL concentrations for 4 d. (d) OD600 values of H-plux and its correction strains (H-mcs) incubated with various AHL concentrations for 12 h. (e) OD600 values of R-plux and its correction strains (R-mcs) incubated with various AHL concentrations for 12 h. (f) OD600 values of X-plux and its correction strains (wild-type G. xylinus700178 strain, X-w) incubated with varying AHL concentrations for 12 h. The error bars represent the means ± SEMs; n = 3, 4, significant differences among the control group (AHL concentration of 0 nM) and the other groups were computed via one-way ANOVA; ns = not significant; * P ≤ 0.05, ** P ≤ 0.01, *** P ≤ 0.001 and **** P ≤ 0.0001. -
![]() Screening of critical genes for bacterial cellulose production. (a) Schematic diagram of pln2 single recombination technology. (b) PCR identification of the nine variant strains obtained via single recombination methods. (c) BC film production of the wild-type G. hansenii ATCC
Screening of critical genes for bacterial cellulose production. (a) Schematic diagram of pln2 single recombination technology. (b) PCR identification of the nine variant strains obtained via single recombination methods. (c) BC film production of the wild-type G. hansenii ATCC 53582 strain (WT) and nine variant strains after stationary incubation in HS broth. (d) BC film production in 12-well plates of four variant strains after complementation of the corresponding genes.

Related articles
-
2023, 53(12): 1201. DOI: 10.52396/JUSTC-2022-0186
-
2023, 53(6): 0605. DOI: 10.52396/JUSTC-2023-0057
-
2022, 52(7): 4-1-4-14. DOI: 10.52396/JUSTC-2021-0268
-
2021, 51(5): 419-430. DOI: 10.52396/JUST-2021-0083
-
2021, 51(4): 308-318. DOI: 10.52396/JUST-2020-0018
-
2021, 51(2): 117-128. DOI: 10.52396/JUST-2021-0041
-
2019, 49(8): 603-605. DOI: 10.3969/j.issn.0253-2778.2019.08.001
-
2019, 49(7): 524-532. DOI: 10.3969/j.issn.0253-2778.2019.07.002
-
2018, 48(1): 57-64. DOI: 10.3969/j.issn.0253-2778.2018.01.008
-
2017, 47(5): 392-402. DOI: 10.3969/j.issn.0253-2778.2017.05.004
