
 Download:
Figures of the Article
-
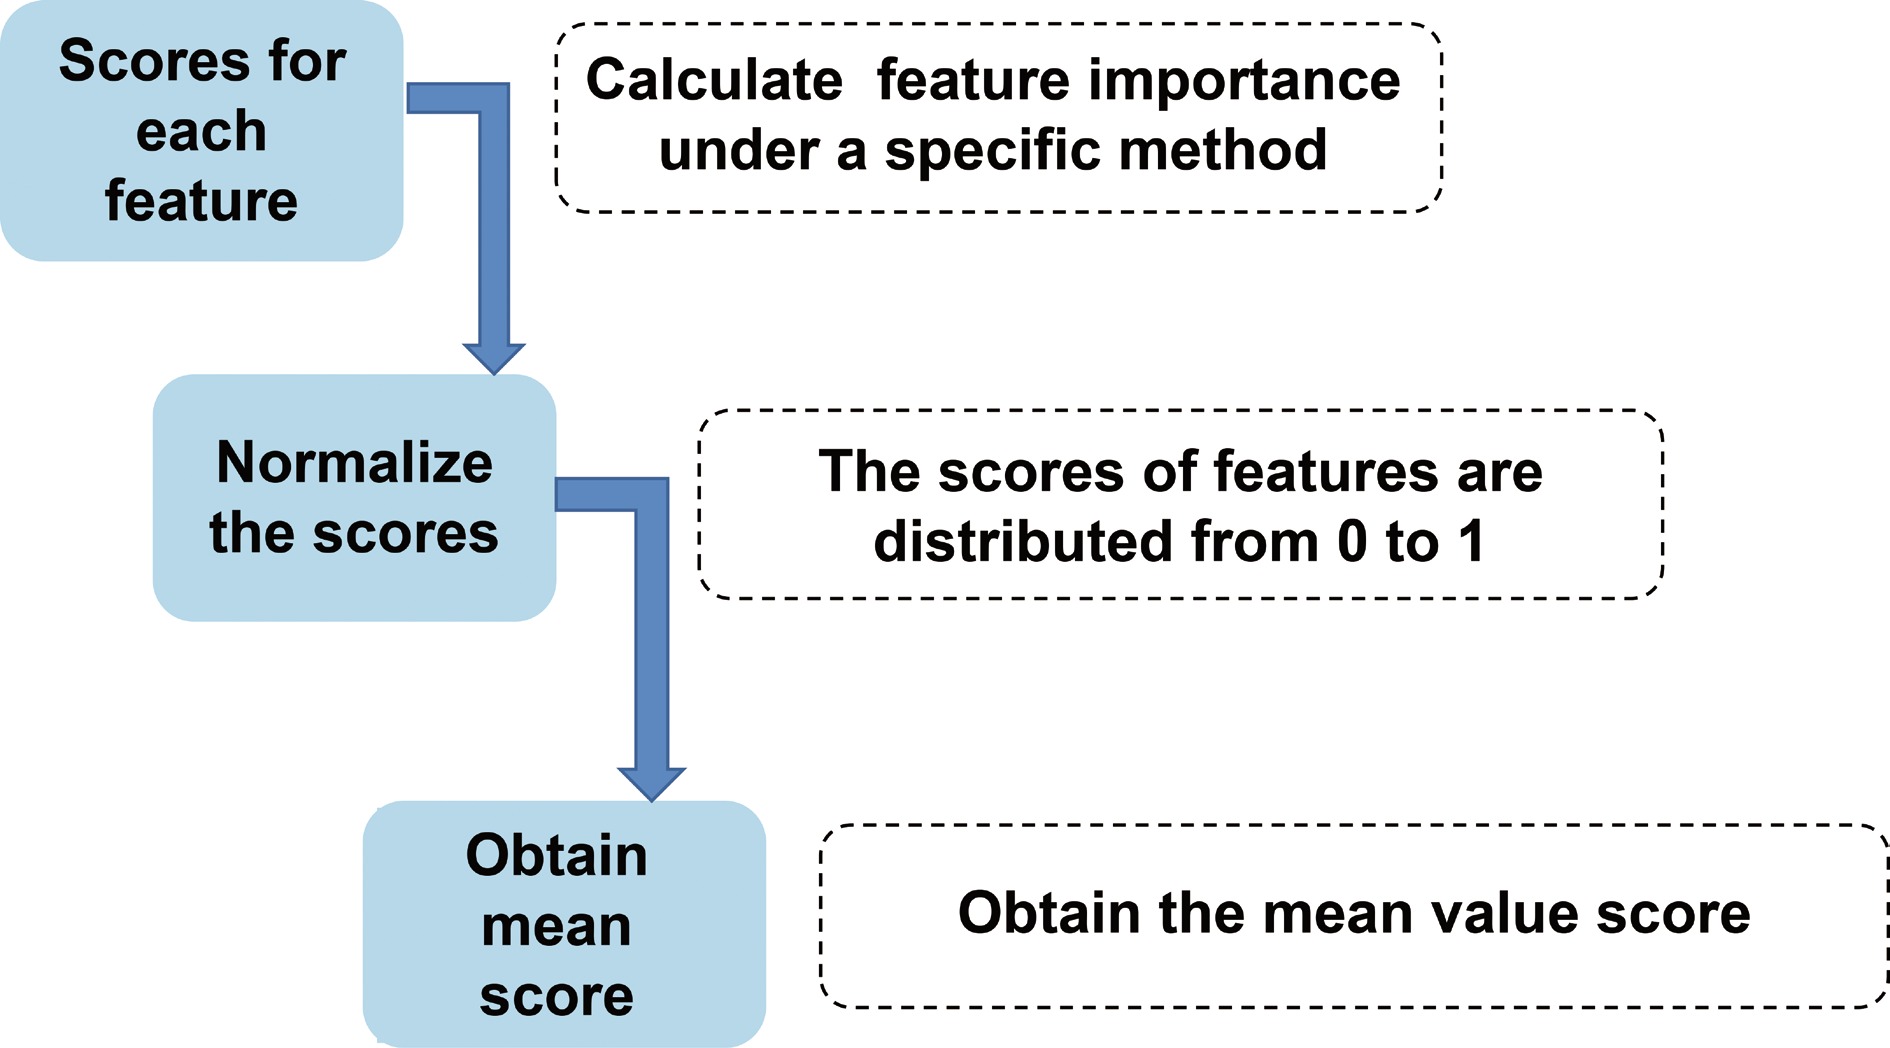
![]() Flow chart for the mean score methodology.
Flow chart for the mean score methodology.
-
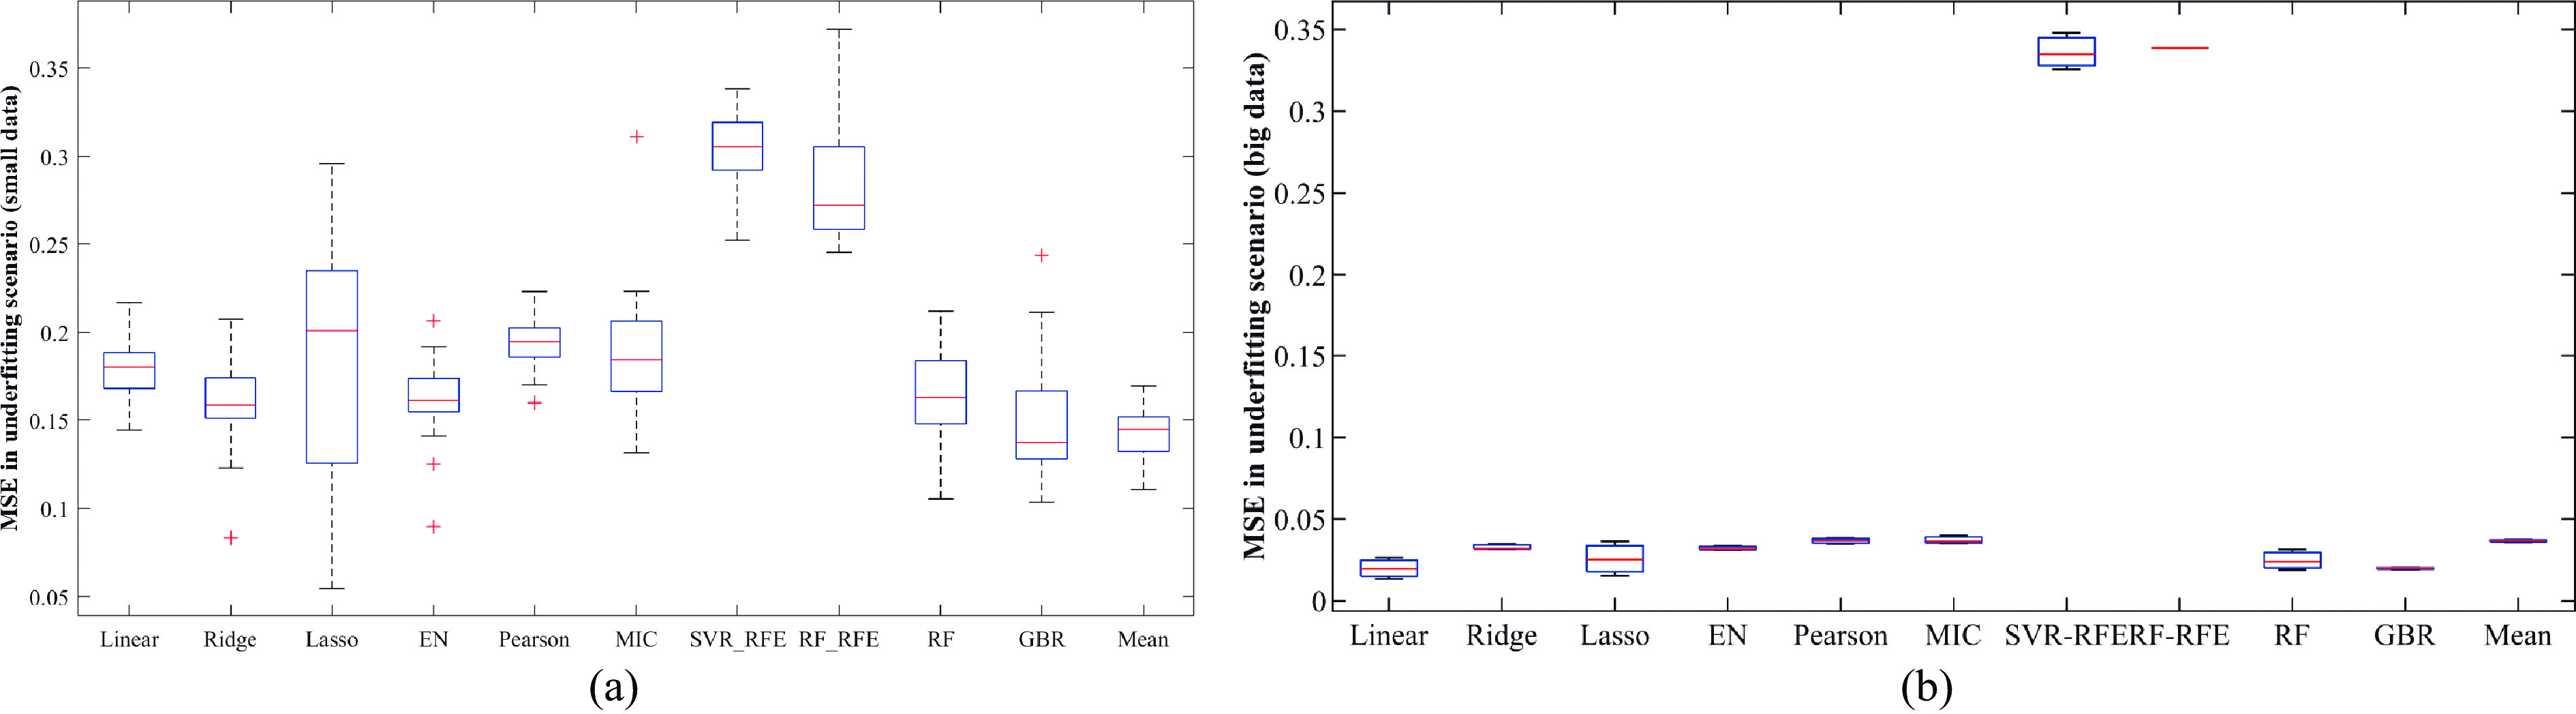
![]() Comparison of indicator identification ability of methods in underfitting scenarios.
Comparison of indicator identification ability of methods in underfitting scenarios.
-
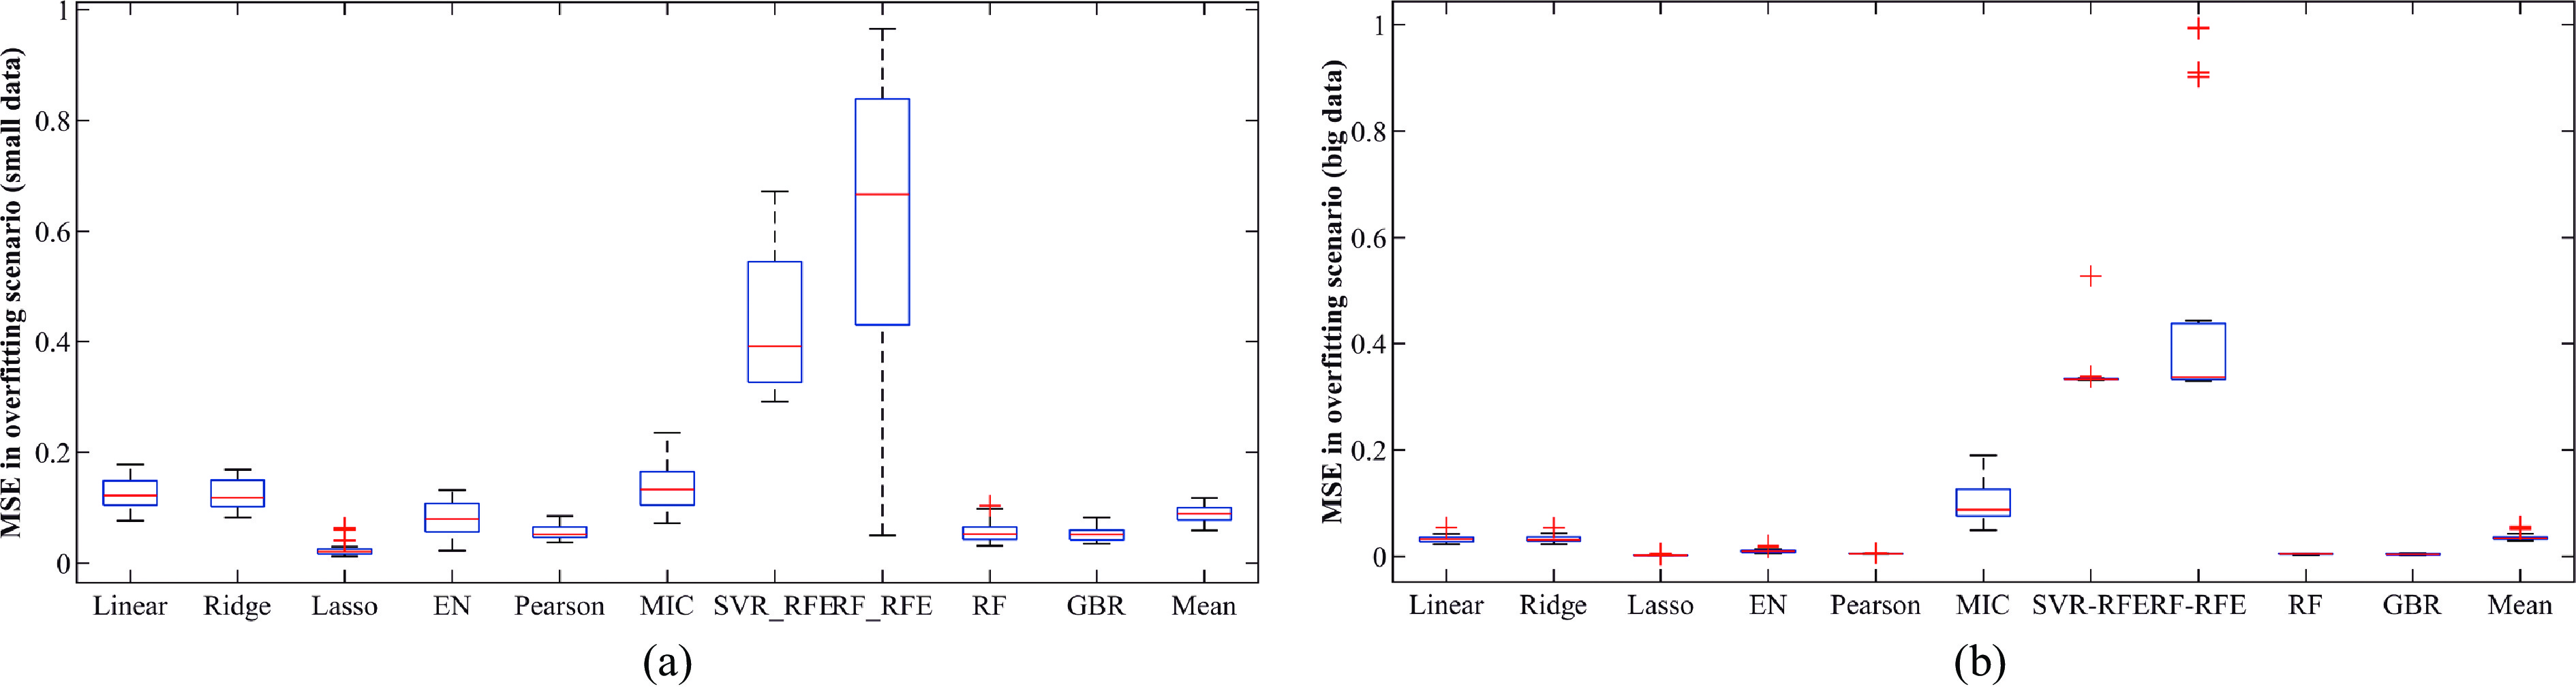
![]() Comparison of indicator identification ability of methods in overfitting scenarios.
Comparison of indicator identification ability of methods in overfitting scenarios.
-
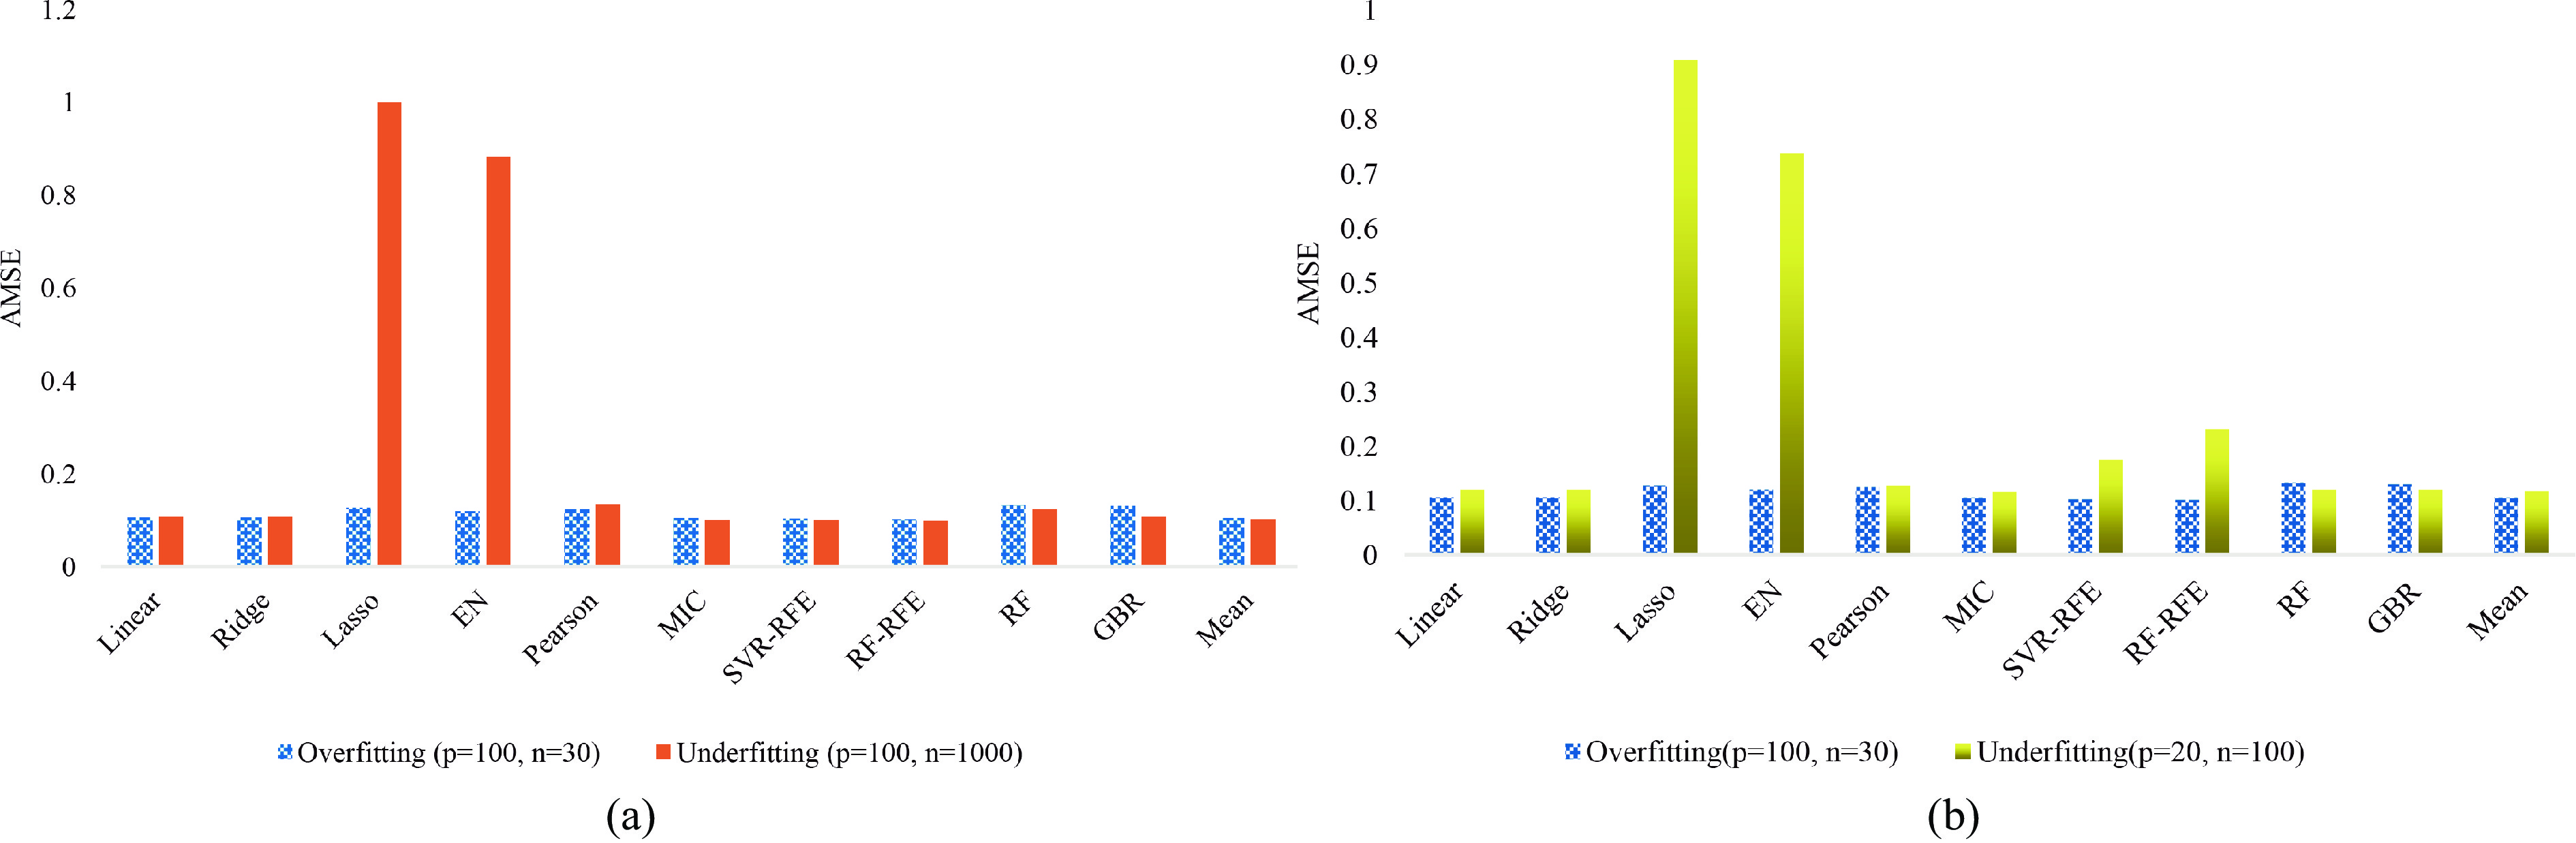
![]() AMSE of methods between the overfitting and underfitting scenarios.
AMSE of methods between the overfitting and underfitting scenarios.
-
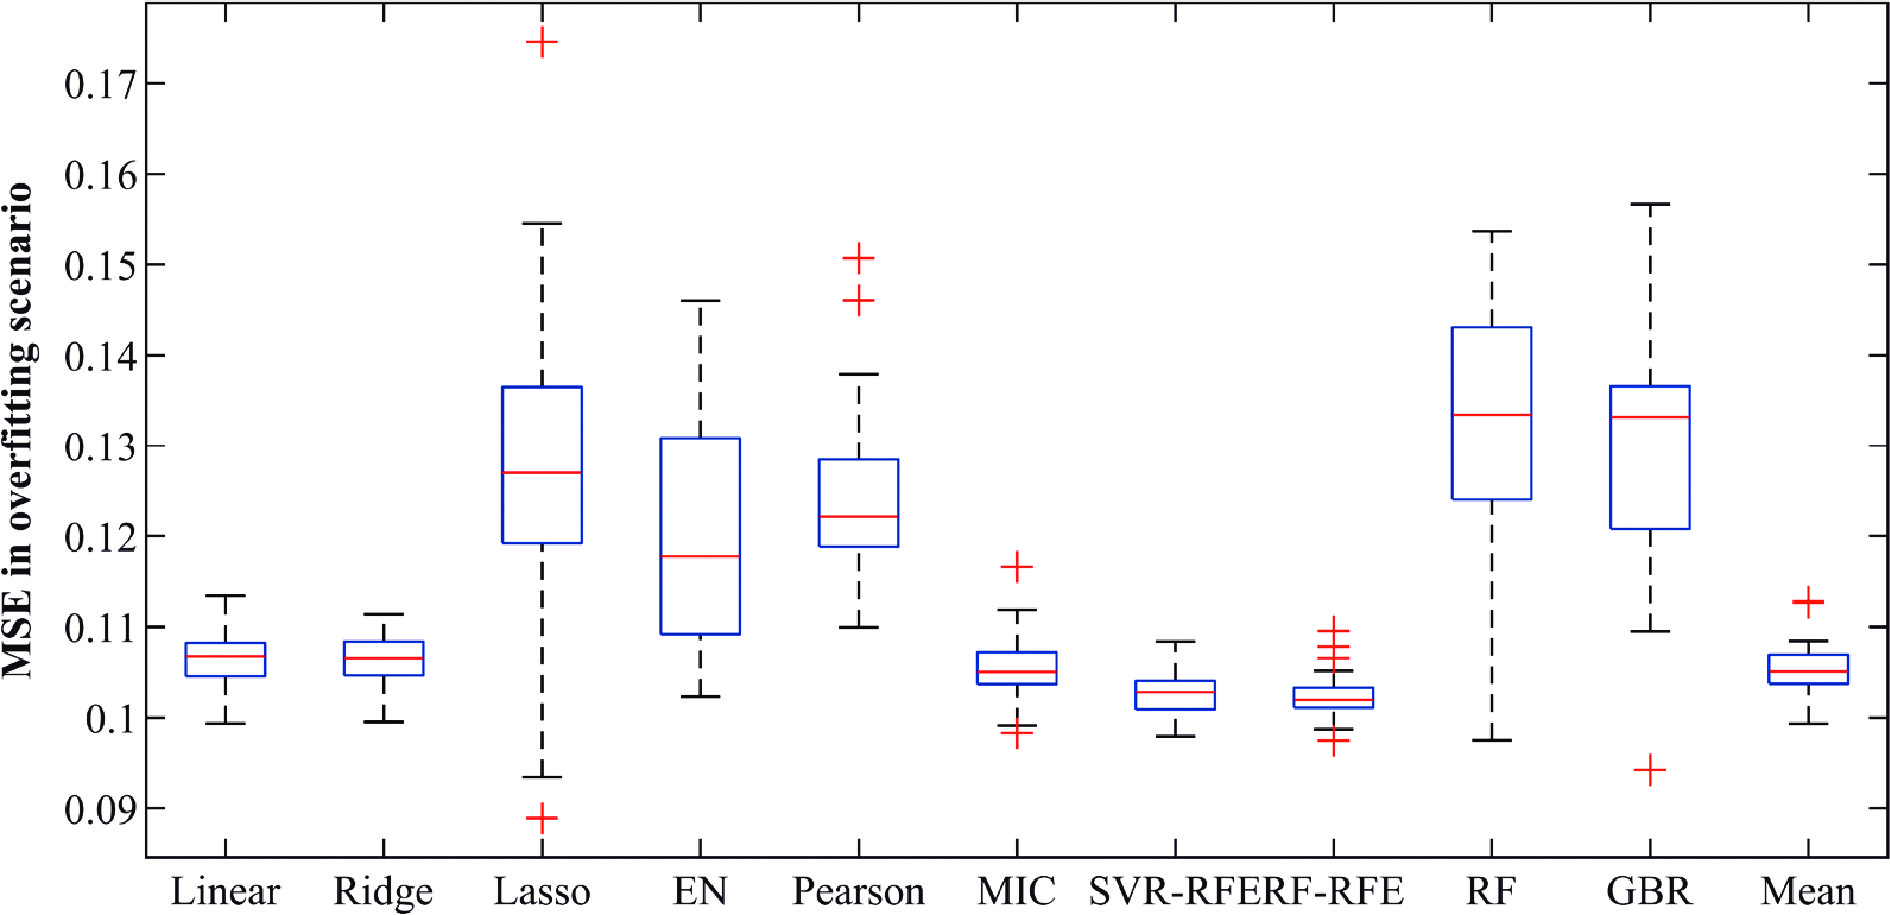
![]() MSE of methods in the overfitting scenario with 30 replications.
MSE of methods in the overfitting scenario with 30 replications.
-
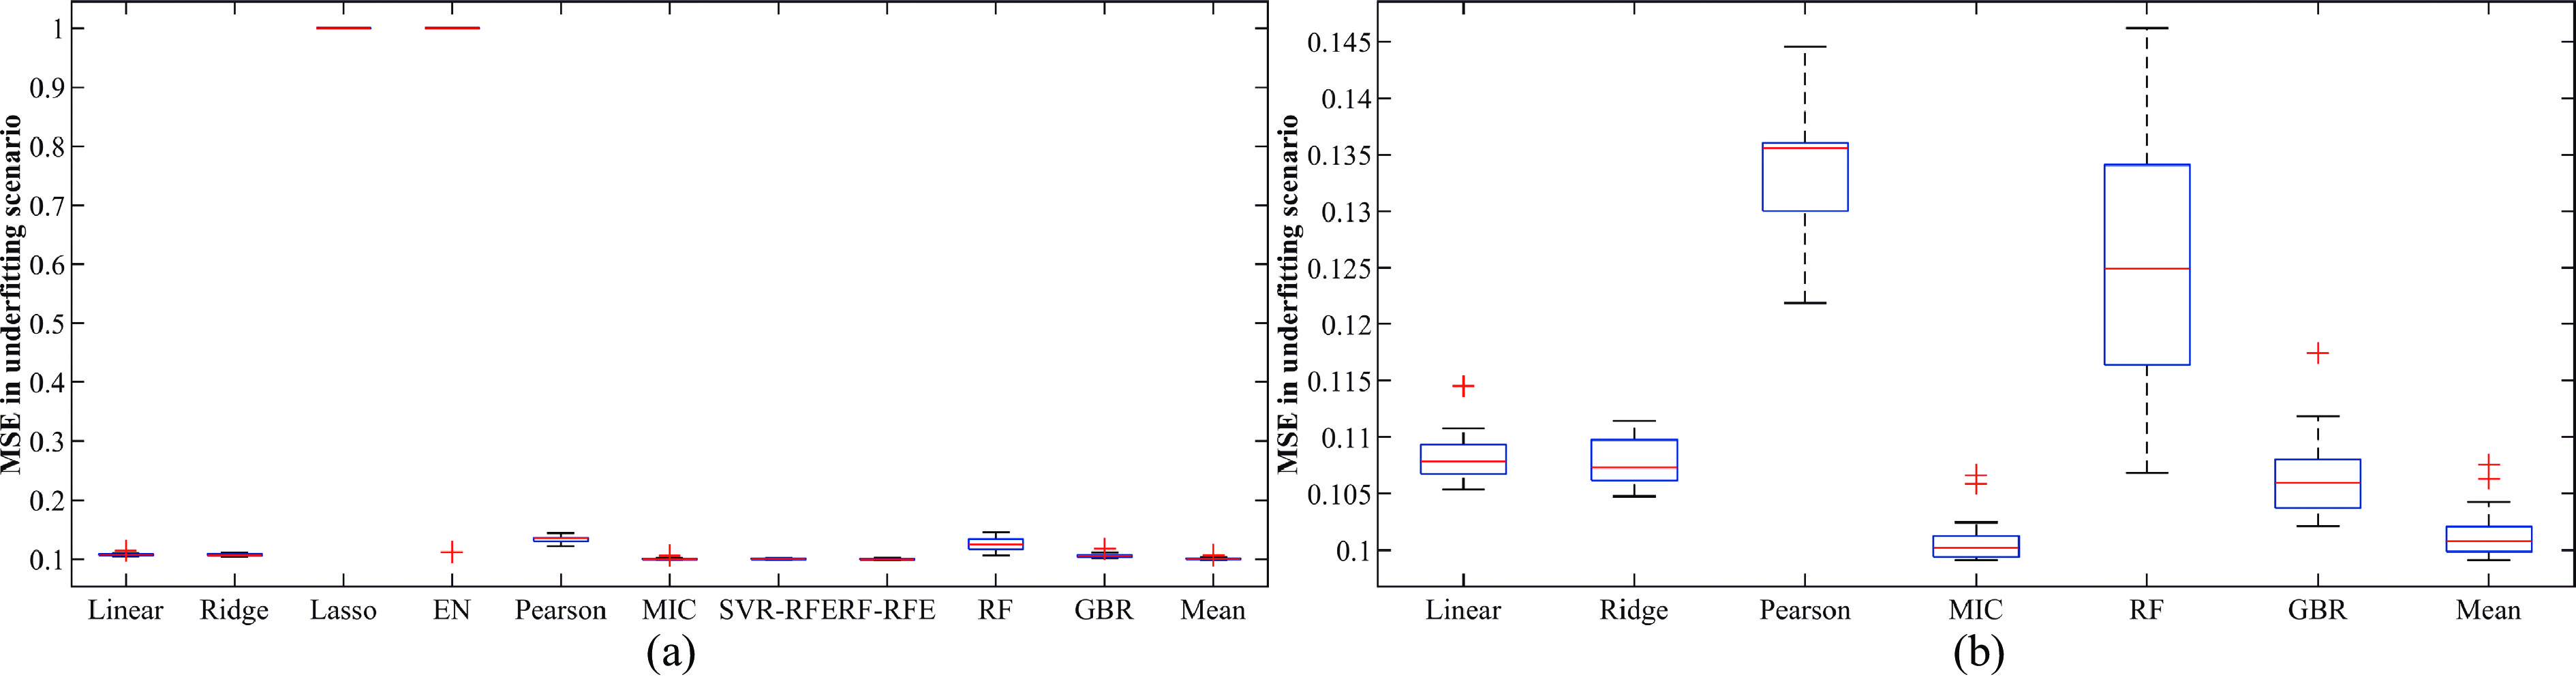
![]() MSE of methods in underfitting scenario I with 30 replications.
MSE of methods in underfitting scenario I with 30 replications.
-
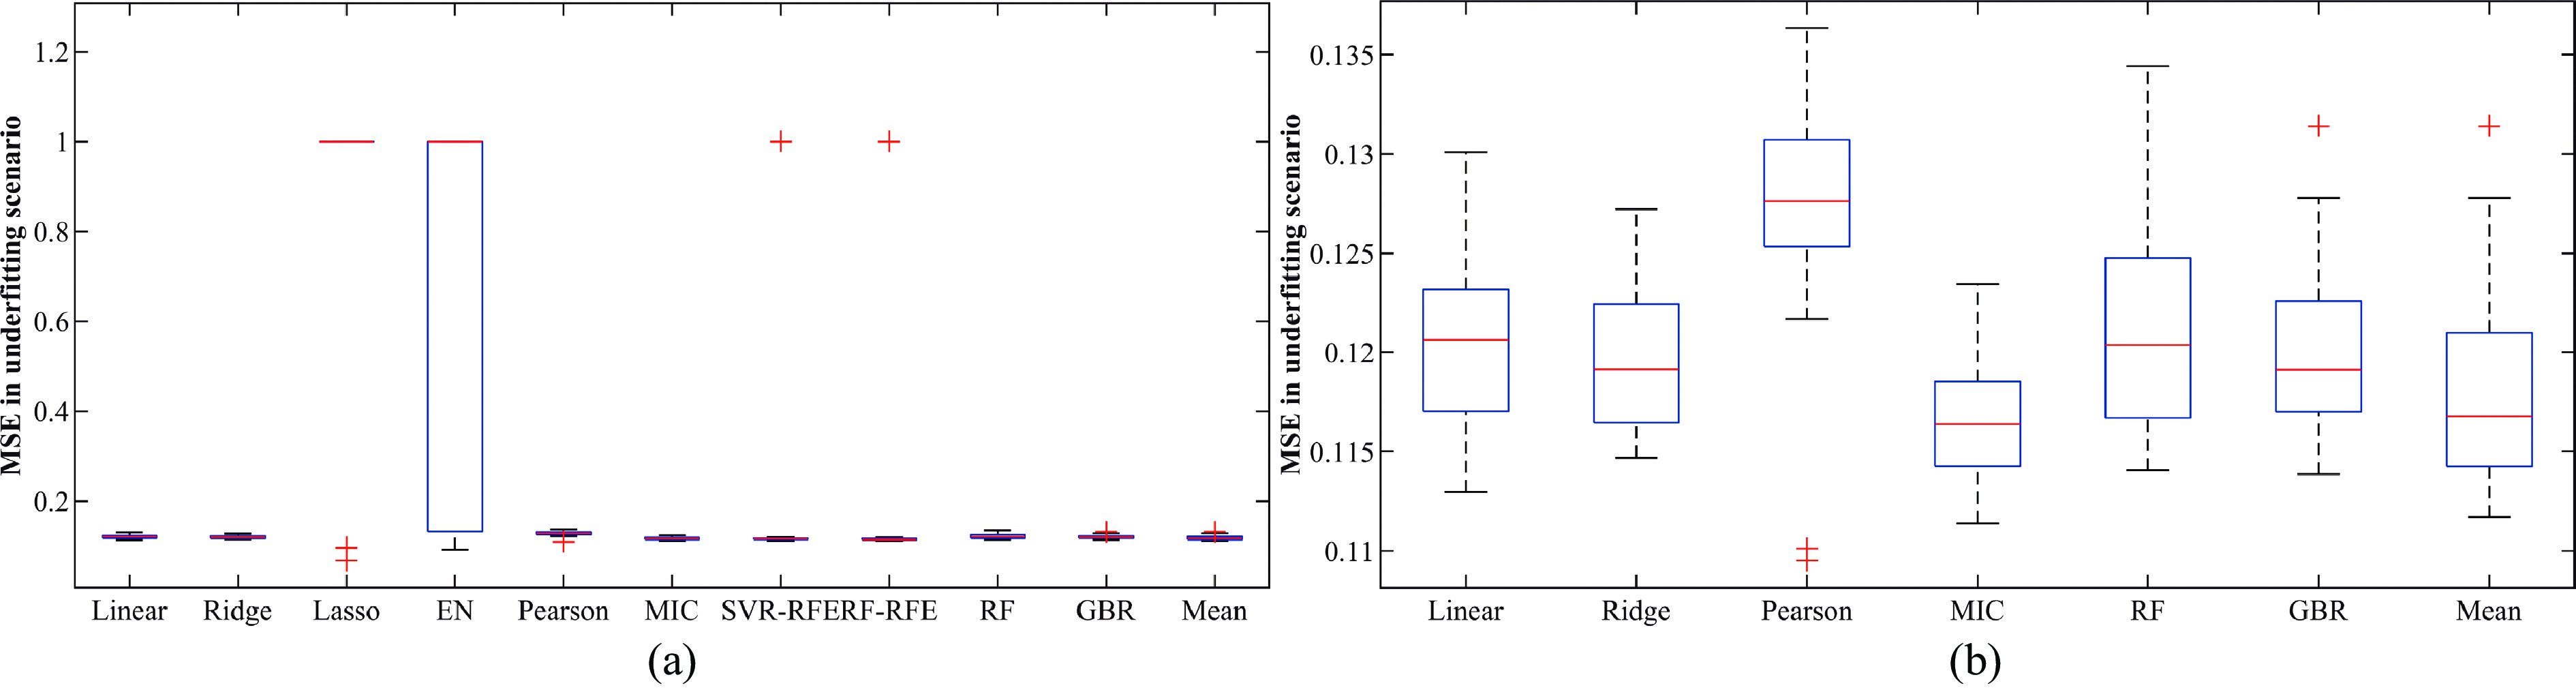
![]() MSE of methods in underfitting scenario II with 30 replications.
MSE of methods in underfitting scenario II with 30 replications.
-
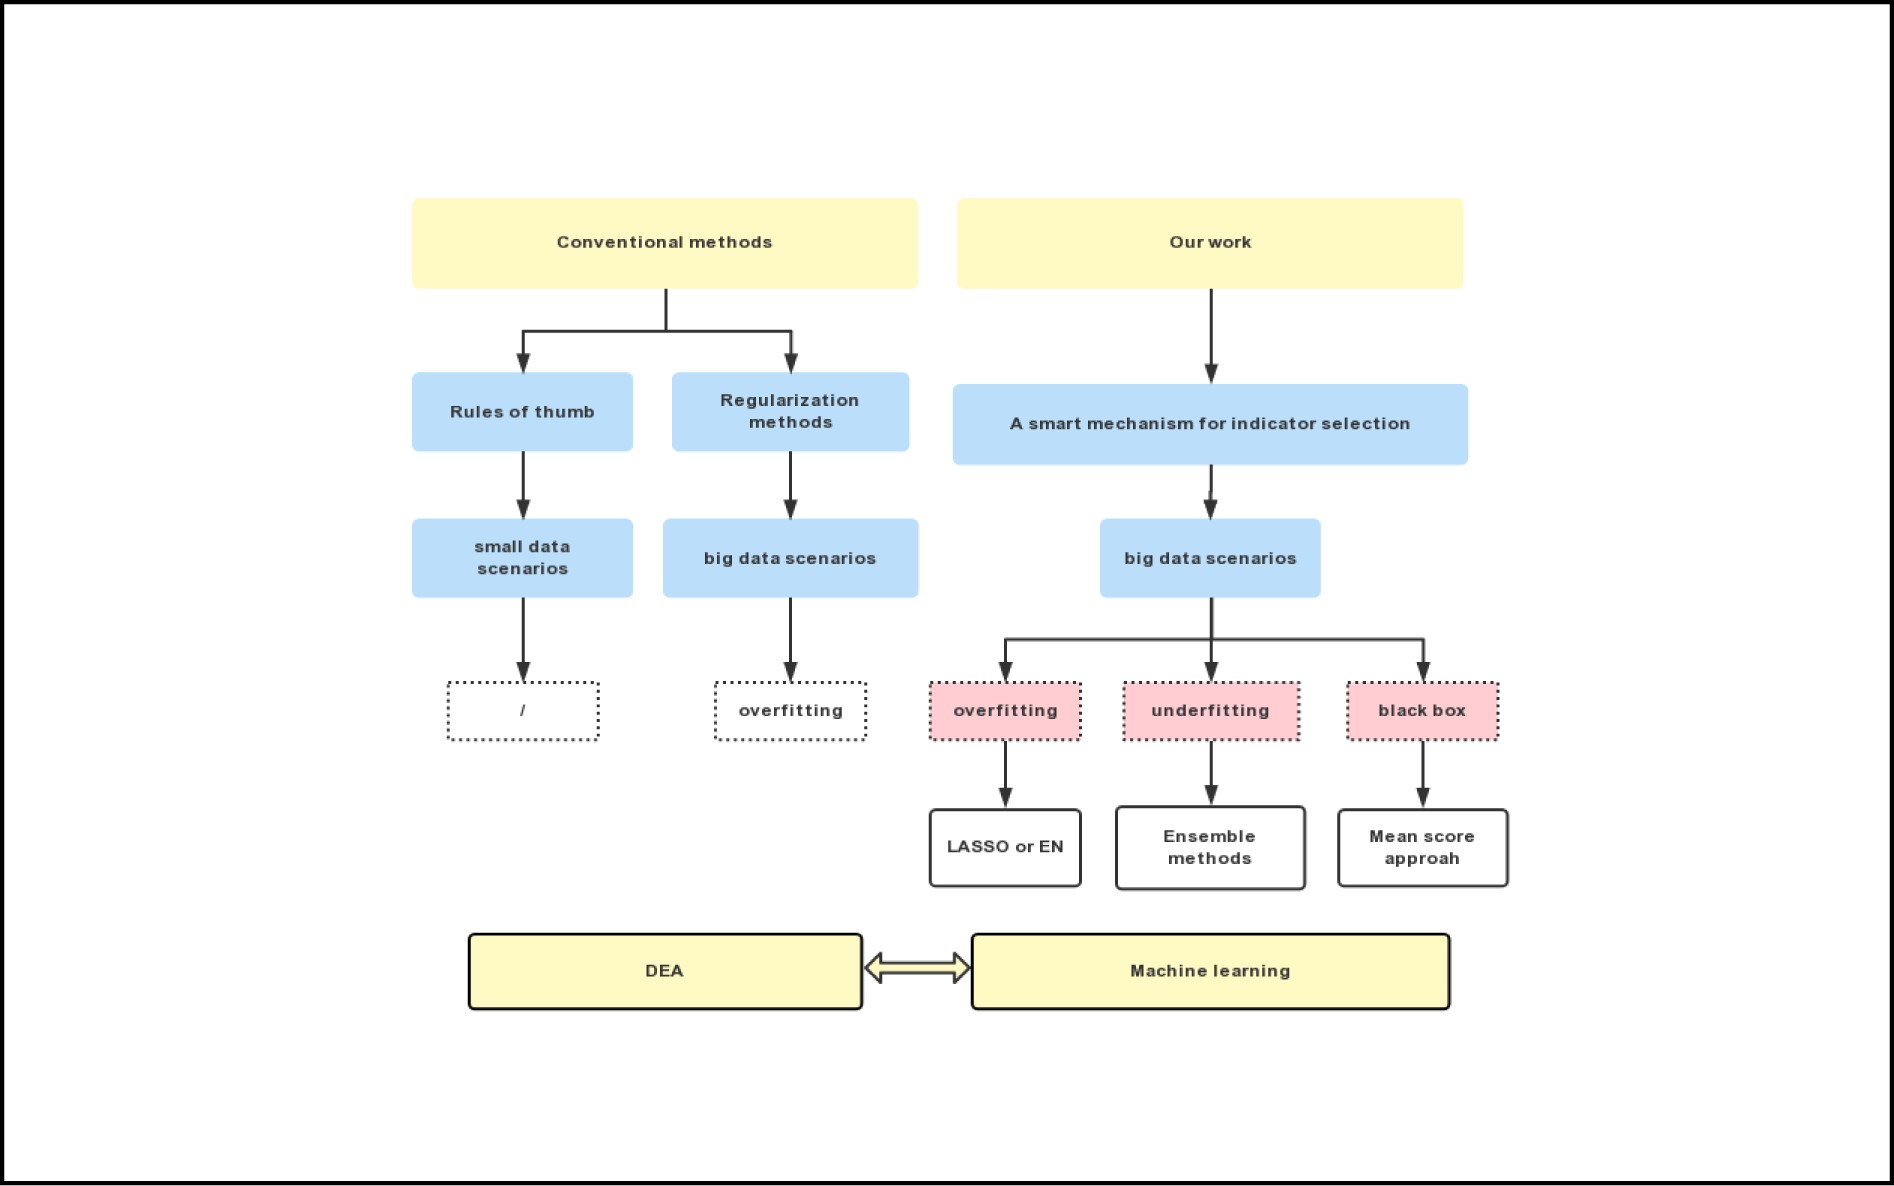
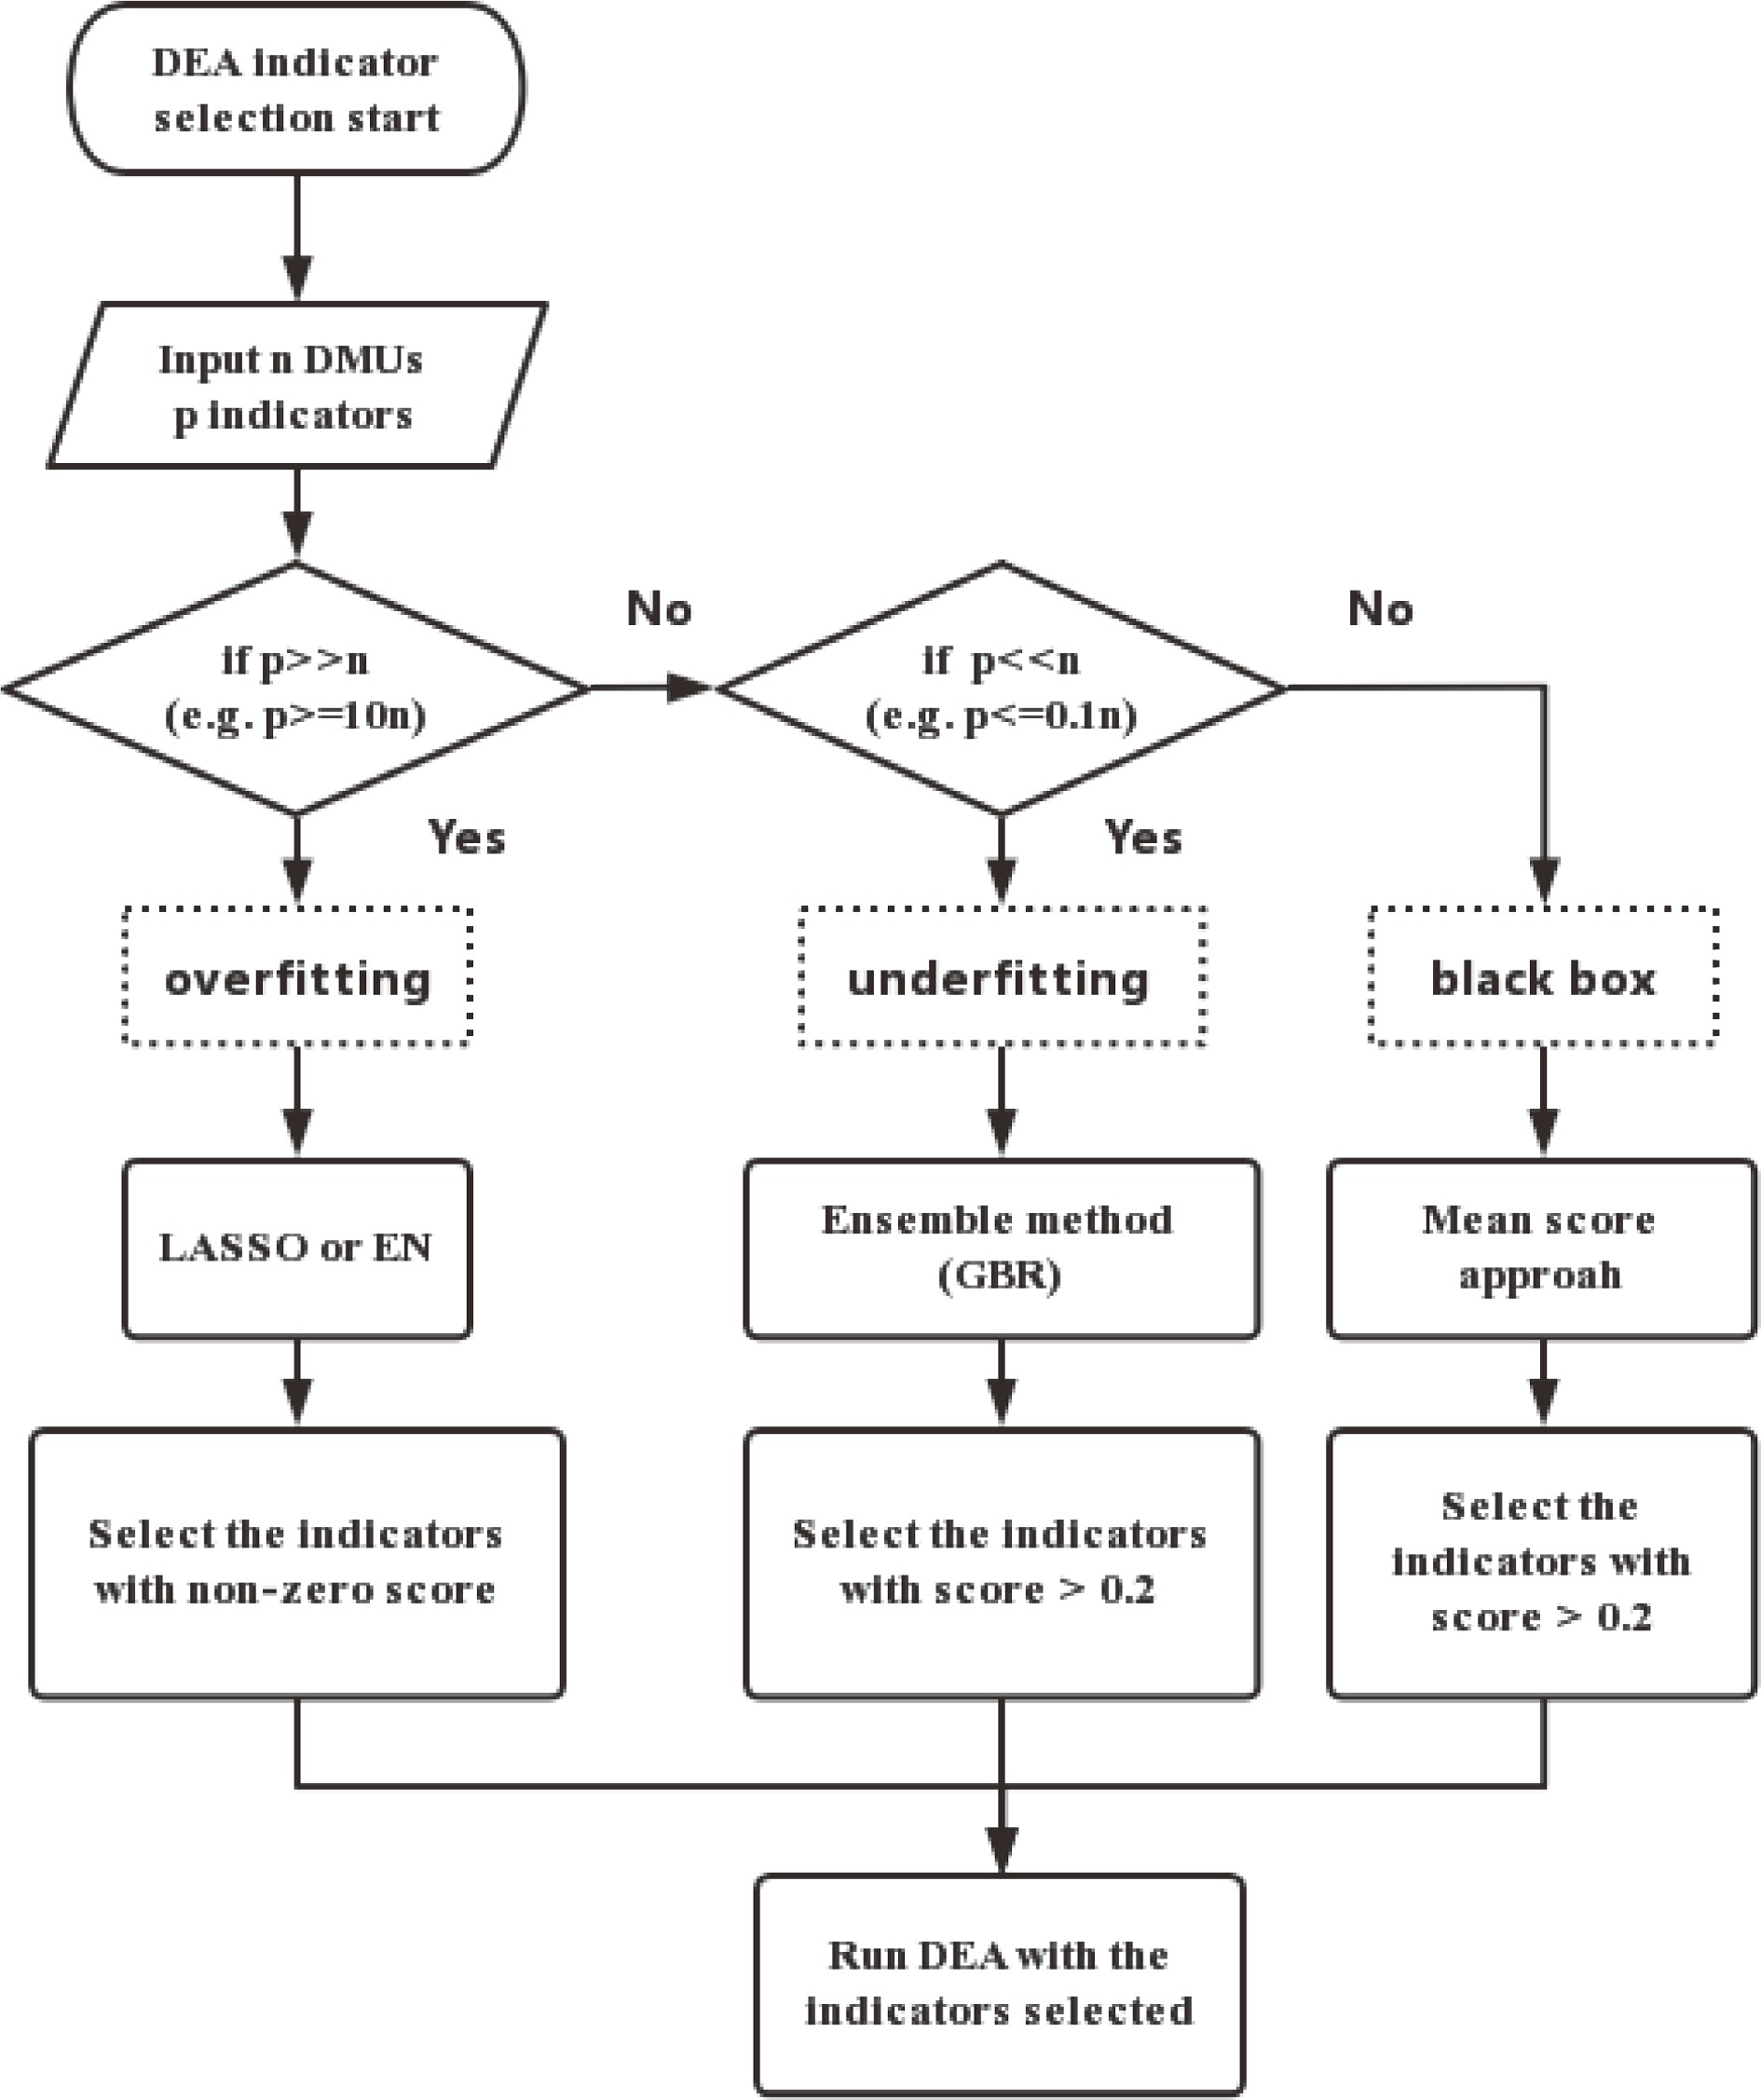
![]() A smart indicator selection mechanism for DEA.
A smart indicator selection mechanism for DEA.
Related articles
-
2024, 54(6): 0603. DOI: 10.52396/JUSTC-2024-0031
-
2023, 53(12): 1205. DOI: 10.52396/JUSTC-2023-0089
-
2023, 53(12): 1204. DOI: 10.52396/JUSTC-2023-0067
-
2021, 51(7): 521-541. DOI: 10.52396/JUST-2021-0092
-
2020, 50(1): 18-28. DOI: 10.3969/j.issn.0253-2778.2020.01.003
-
2018, 48(8): 683-690. DOI: 10.3969/j.issn.0253-2778.2018.08.011
-
2018, 48(2): 154-160. DOI: 10.3969/j.issn.0253-2778.2018.02.010
-
2017, 47(4): 283-289. DOI: 10.3969/j.issn.0253-2778.2017.04.001
-
2017, 47(1): 1-9. DOI: 10.3969/j.issn.0253-2778.2017.01.001
-
2009, 39(7): 673-682.
