
 Download:
Figures of the Article
-
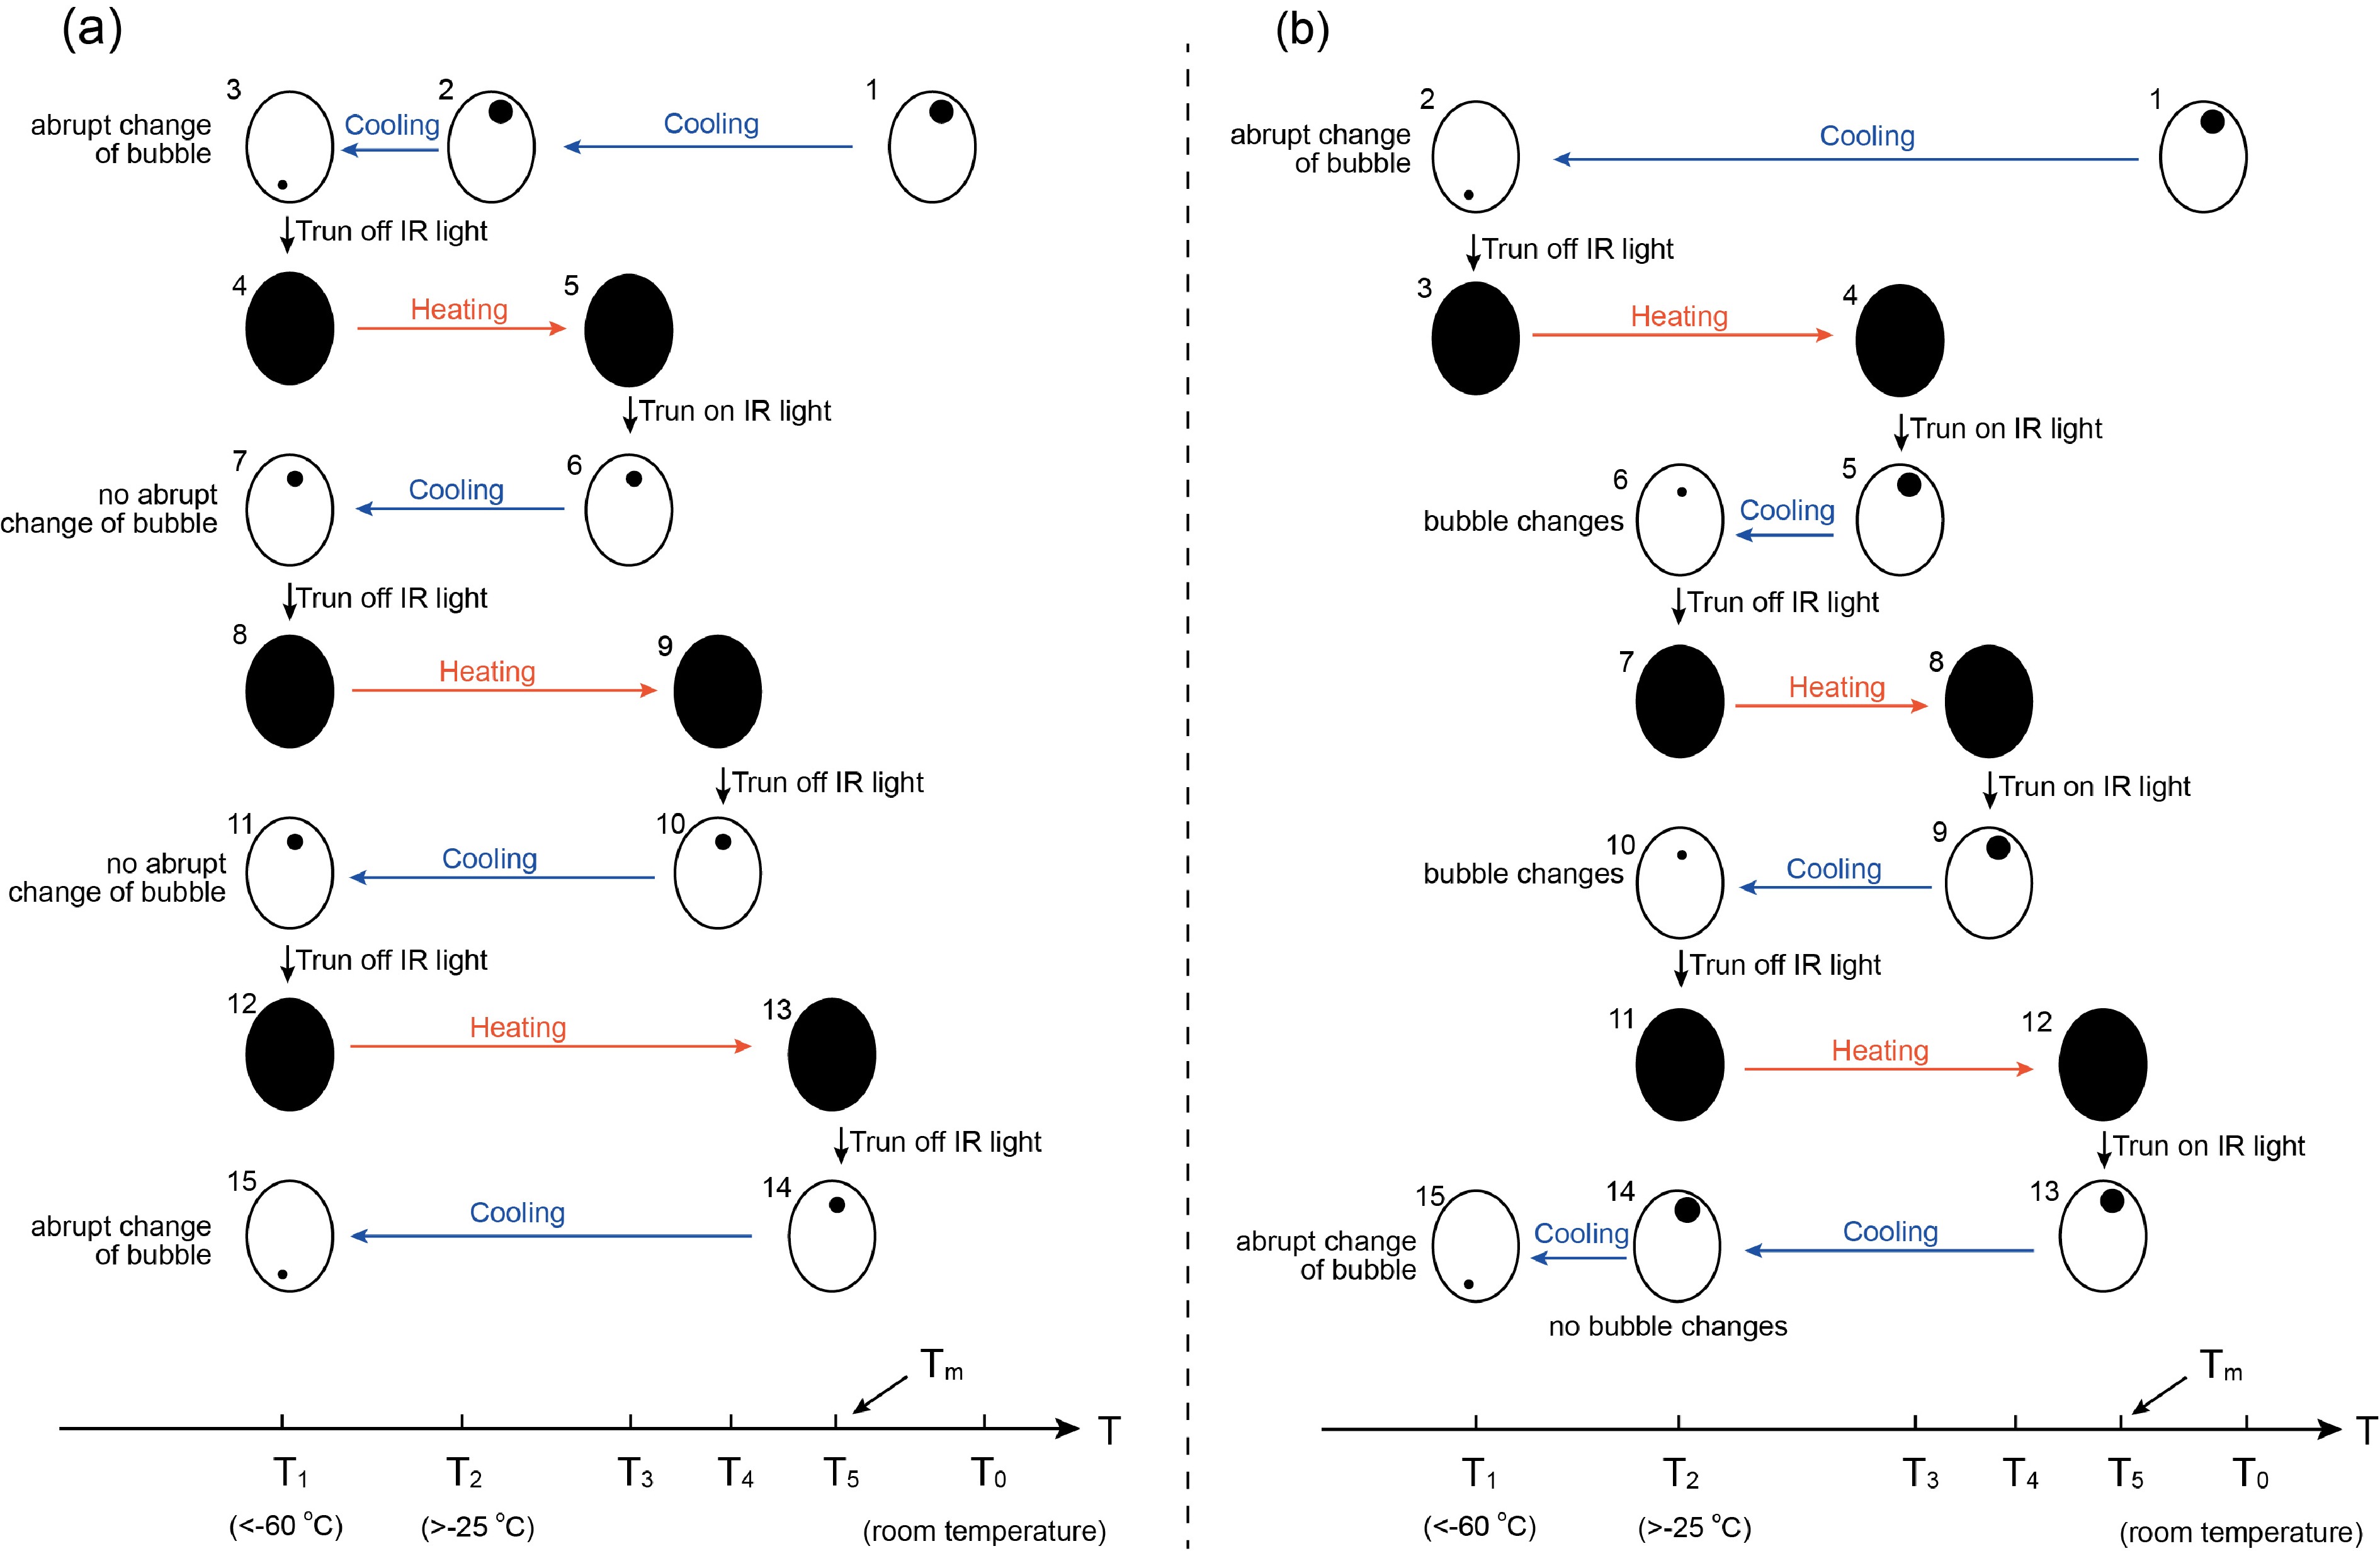
![]() Cycling method for infrared microthermometry to measure final ice melting temperature (Tm) of opaque minerals (modified after Goldstein and Reynolds[46] and Peng et al. [45]). T0, T1, and T2 represent room temperature, a temperature low enough for freezing (generally < –60 oC), and estimated eutectic temperature of the target inclusion system, respectively. (a) The inclusion is cooled to T1 to ensure freezing during every cooling step with infrared (IR) light on. During every heating step, the IR light is turned off and the final temperature for heating is set to be a little higher than the front heating step (T5>T4>T3). The final temperature for heating is regarded as Tm once abrupt change of bubble is observed during the subsequent cooling step. (b) After the first cooling to freeze the inclusion, the final temperature for every cooling step is set to be around estimated eutectic temperature of the target inclusion system. Tm could be recorded when no bubble change is observed during the cooling step.
Cycling method for infrared microthermometry to measure final ice melting temperature (Tm) of opaque minerals (modified after Goldstein and Reynolds[46] and Peng et al. [45]). T0, T1, and T2 represent room temperature, a temperature low enough for freezing (generally < –60 oC), and estimated eutectic temperature of the target inclusion system, respectively. (a) The inclusion is cooled to T1 to ensure freezing during every cooling step with infrared (IR) light on. During every heating step, the IR light is turned off and the final temperature for heating is set to be a little higher than the front heating step (T5>T4>T3). The final temperature for heating is regarded as Tm once abrupt change of bubble is observed during the subsequent cooling step. (b) After the first cooling to freeze the inclusion, the final temperature for every cooling step is set to be around estimated eutectic temperature of the target inclusion system. Tm could be recorded when no bubble change is observed during the cooling step.
-
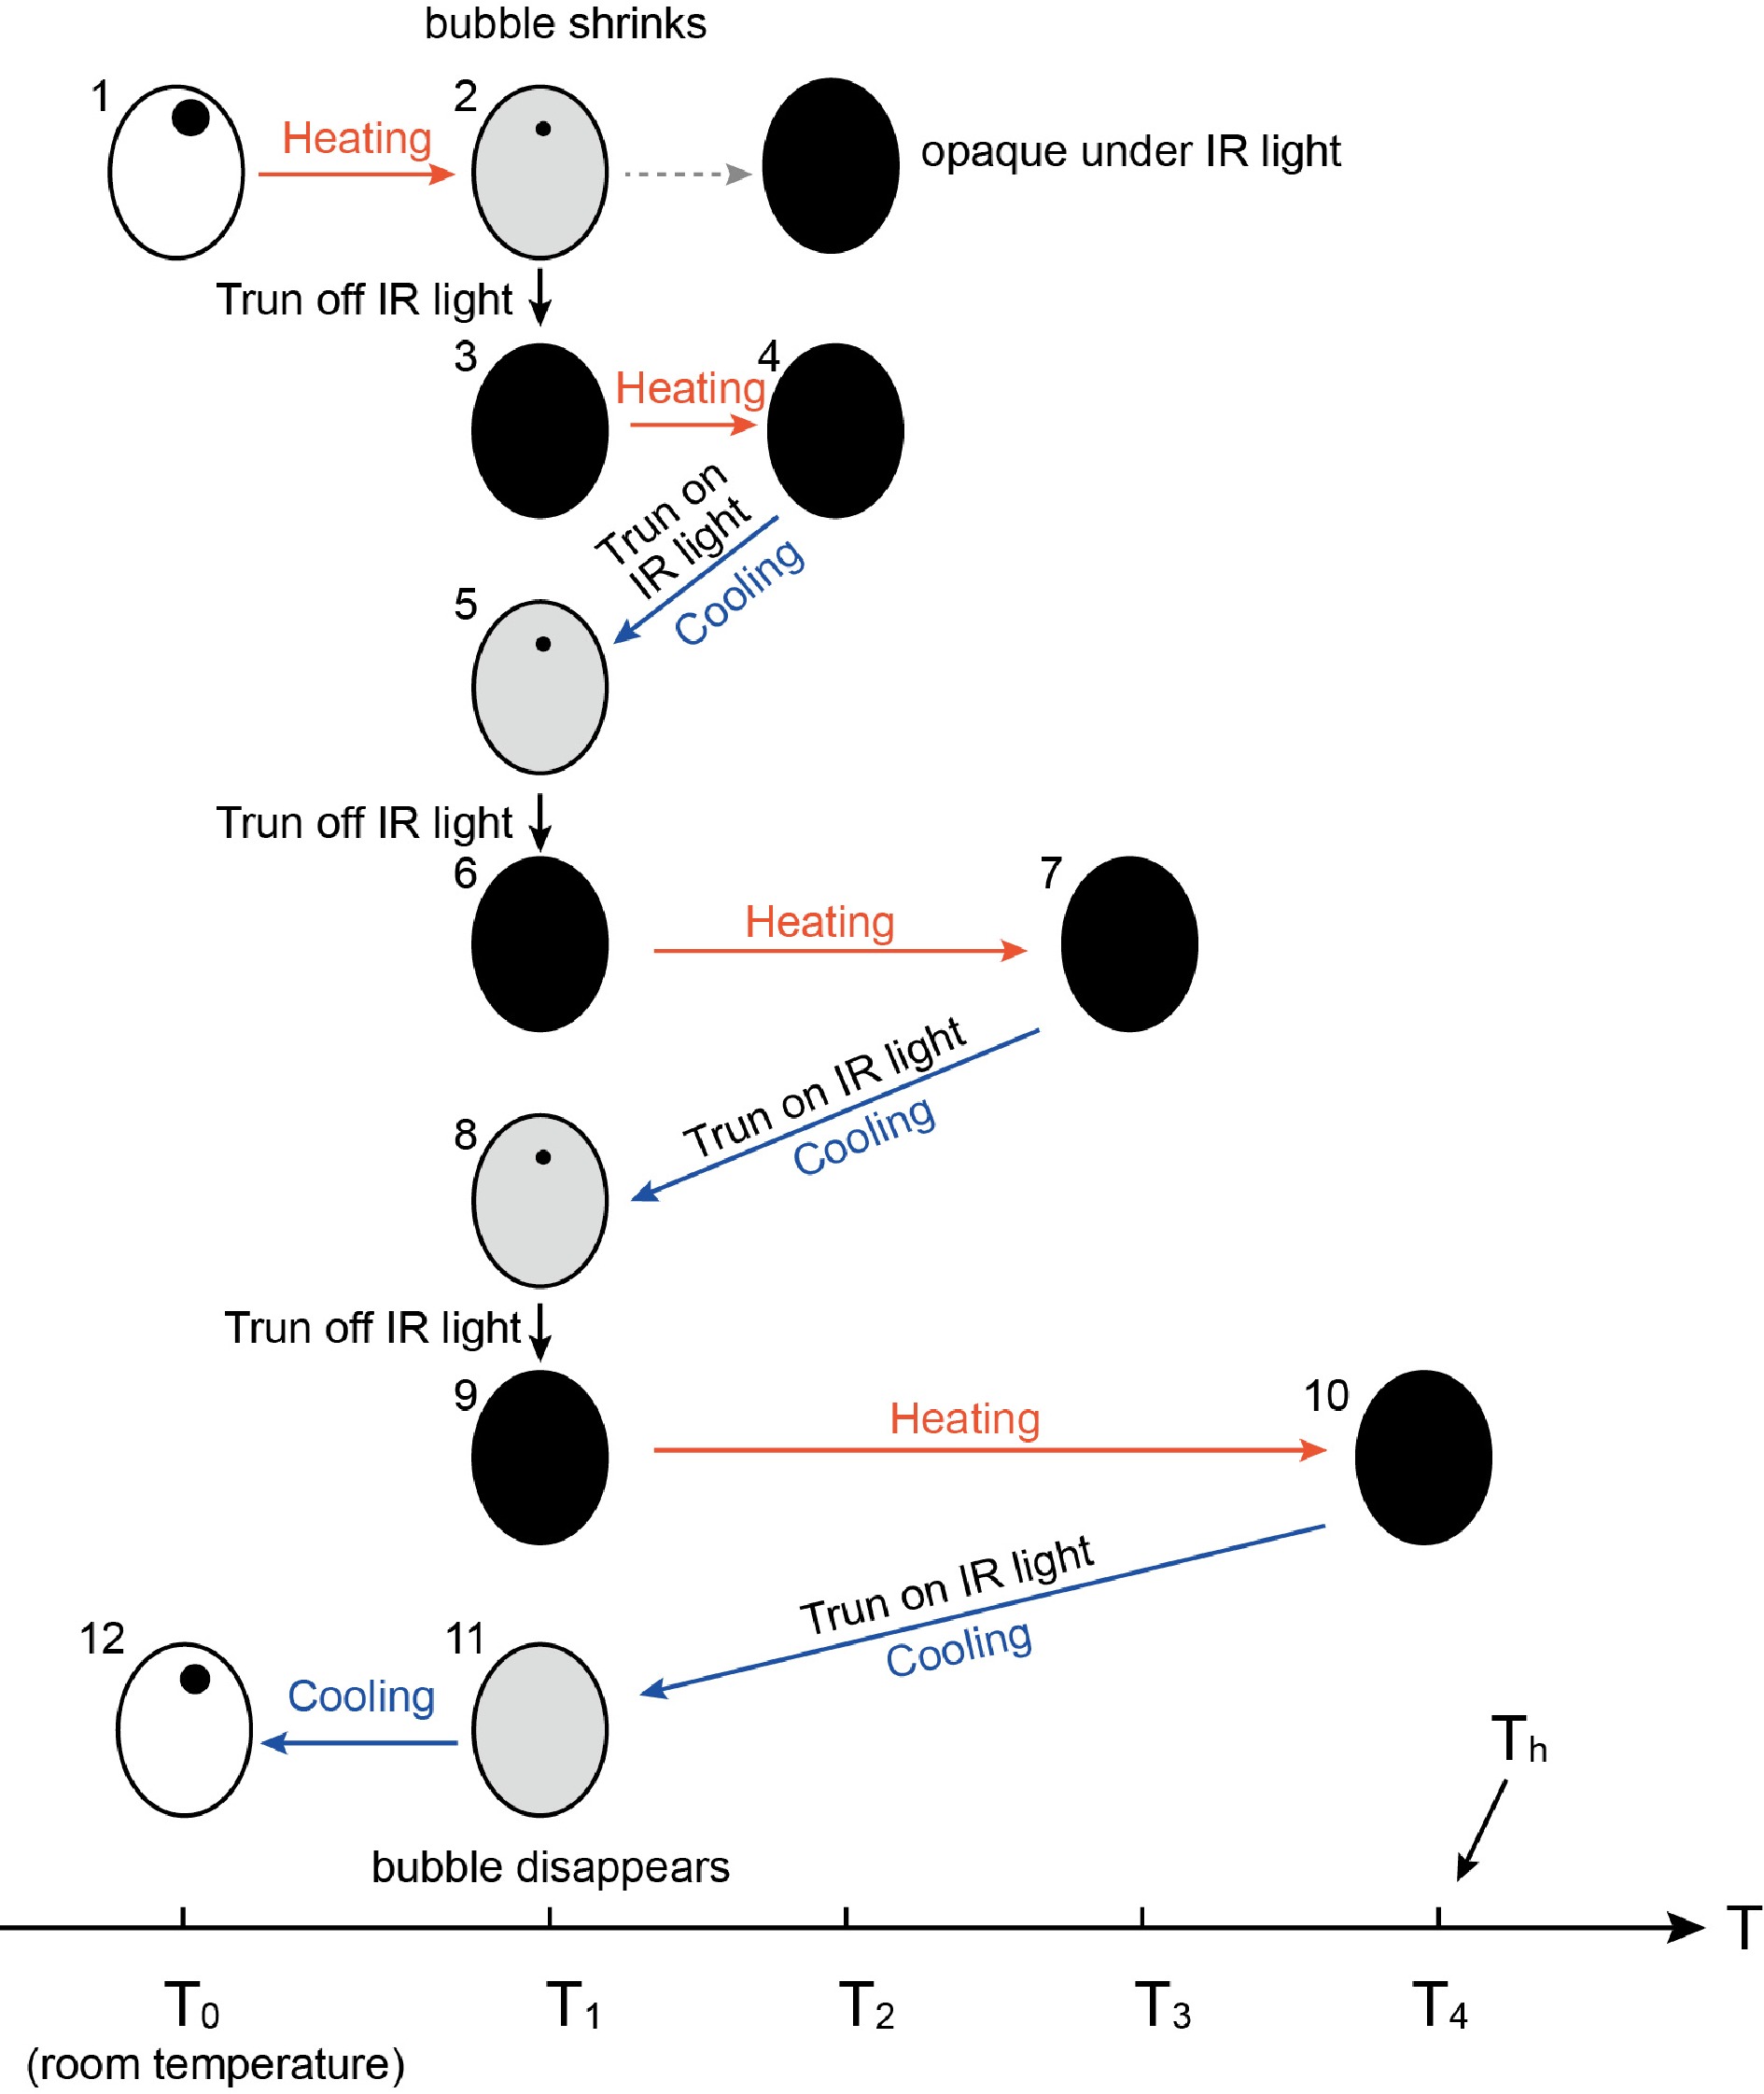
![]() Cycling method for infrared microthermometry to measure homogenization temperature (Th) of opaque minerals (modified after Goldstein and Reynolds[46] and Peng et al. [45]). T0 represents room temperature. T1 is the temperature slightly lower than the estimated Th or lower than the transition temperature for the host mineral to become opaque. For every heating step the infrared (IR) light is turned off and the final temperature is set to increase step by step. The IR light is turned on during the cooling steps in order to observe whether there is a bubble in the inclusion. The final temperature for heating during the cycles could be regarded as Th when the bubble disappears after the subsequent cooling step.
Cycling method for infrared microthermometry to measure homogenization temperature (Th) of opaque minerals (modified after Goldstein and Reynolds[46] and Peng et al. [45]). T0 represents room temperature. T1 is the temperature slightly lower than the estimated Th or lower than the transition temperature for the host mineral to become opaque. For every heating step the infrared (IR) light is turned off and the final temperature is set to increase step by step. The IR light is turned on during the cooling steps in order to observe whether there is a bubble in the inclusion. The final temperature for heating during the cycles could be regarded as Th when the bubble disappears after the subsequent cooling step.
-
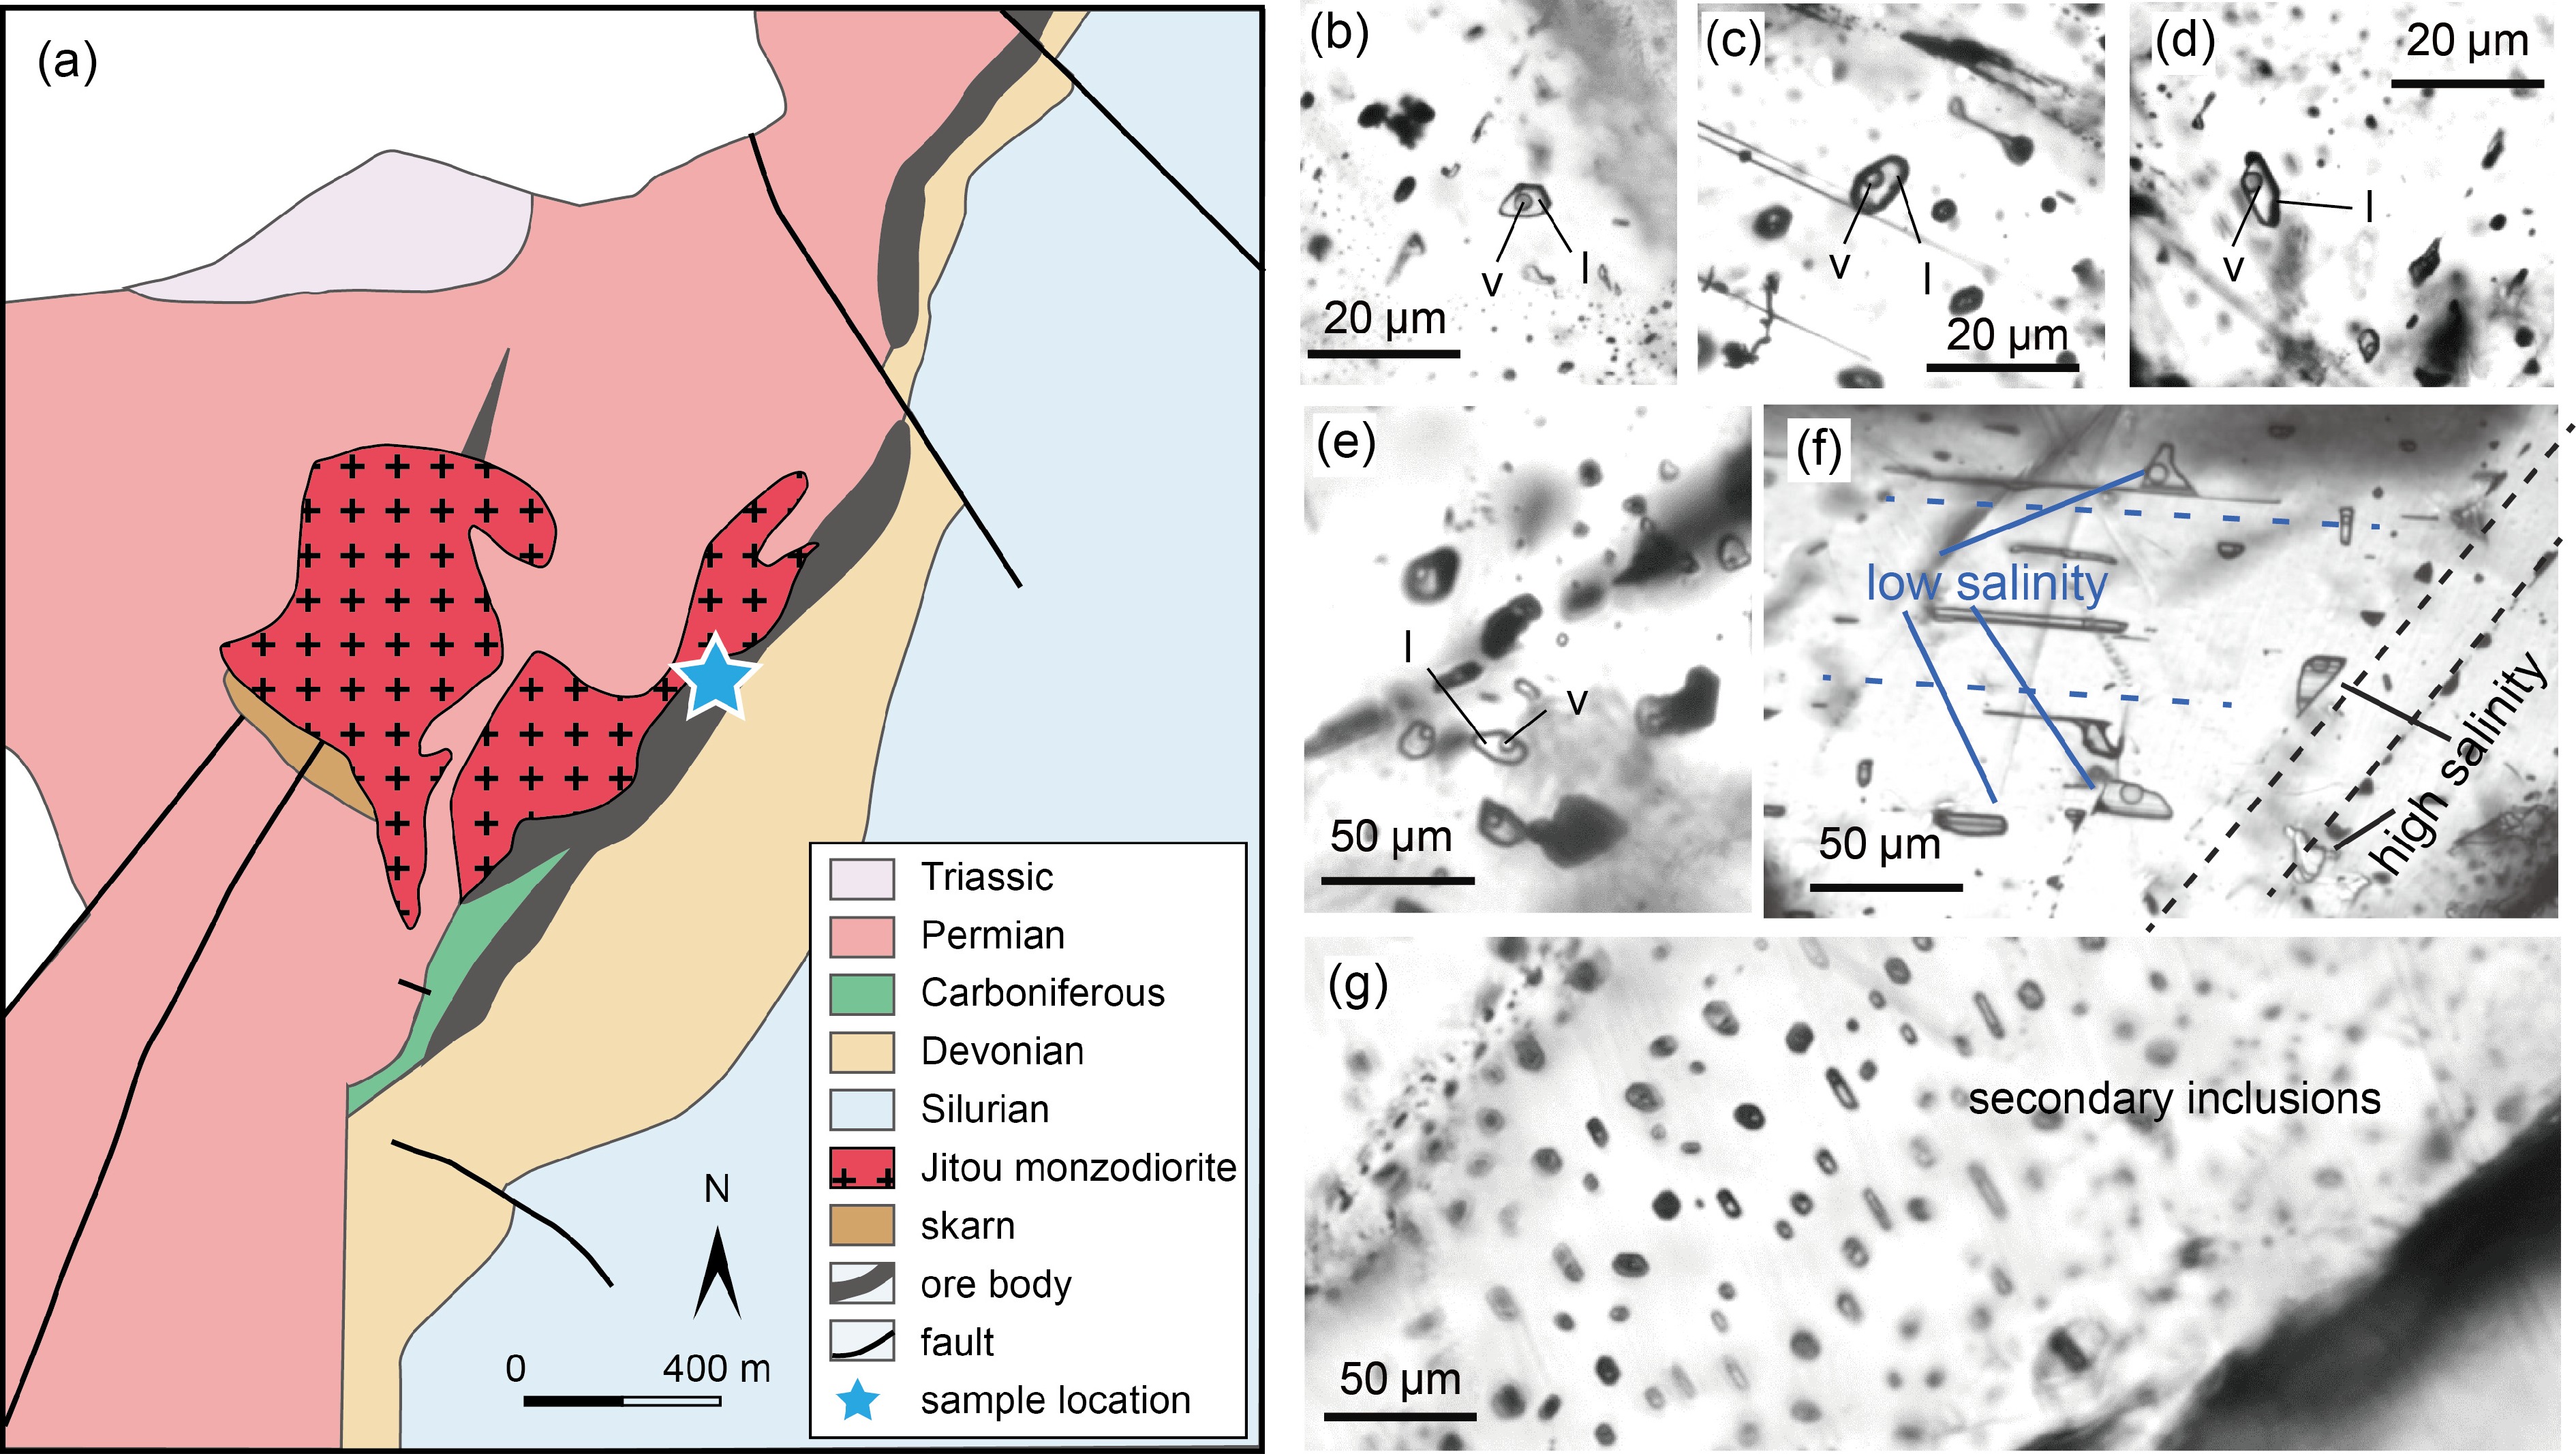
![]() Simplified geological map for the Xinqiao deposit (a) and fluid inclusions in sphalerite (b–g). The sample location is marked as blue star. All the fluid inclusions show primary signature except for the right bottom photo (g) in which the fluid inclusions are of secondary origin. (f) shows the relative age of different groups (low salinity versus high salinity) of fluid inclusions. l: liquid; v: vapor.
Simplified geological map for the Xinqiao deposit (a) and fluid inclusions in sphalerite (b–g). The sample location is marked as blue star. All the fluid inclusions show primary signature except for the right bottom photo (g) in which the fluid inclusions are of secondary origin. (f) shows the relative age of different groups (low salinity versus high salinity) of fluid inclusions. l: liquid; v: vapor.
-
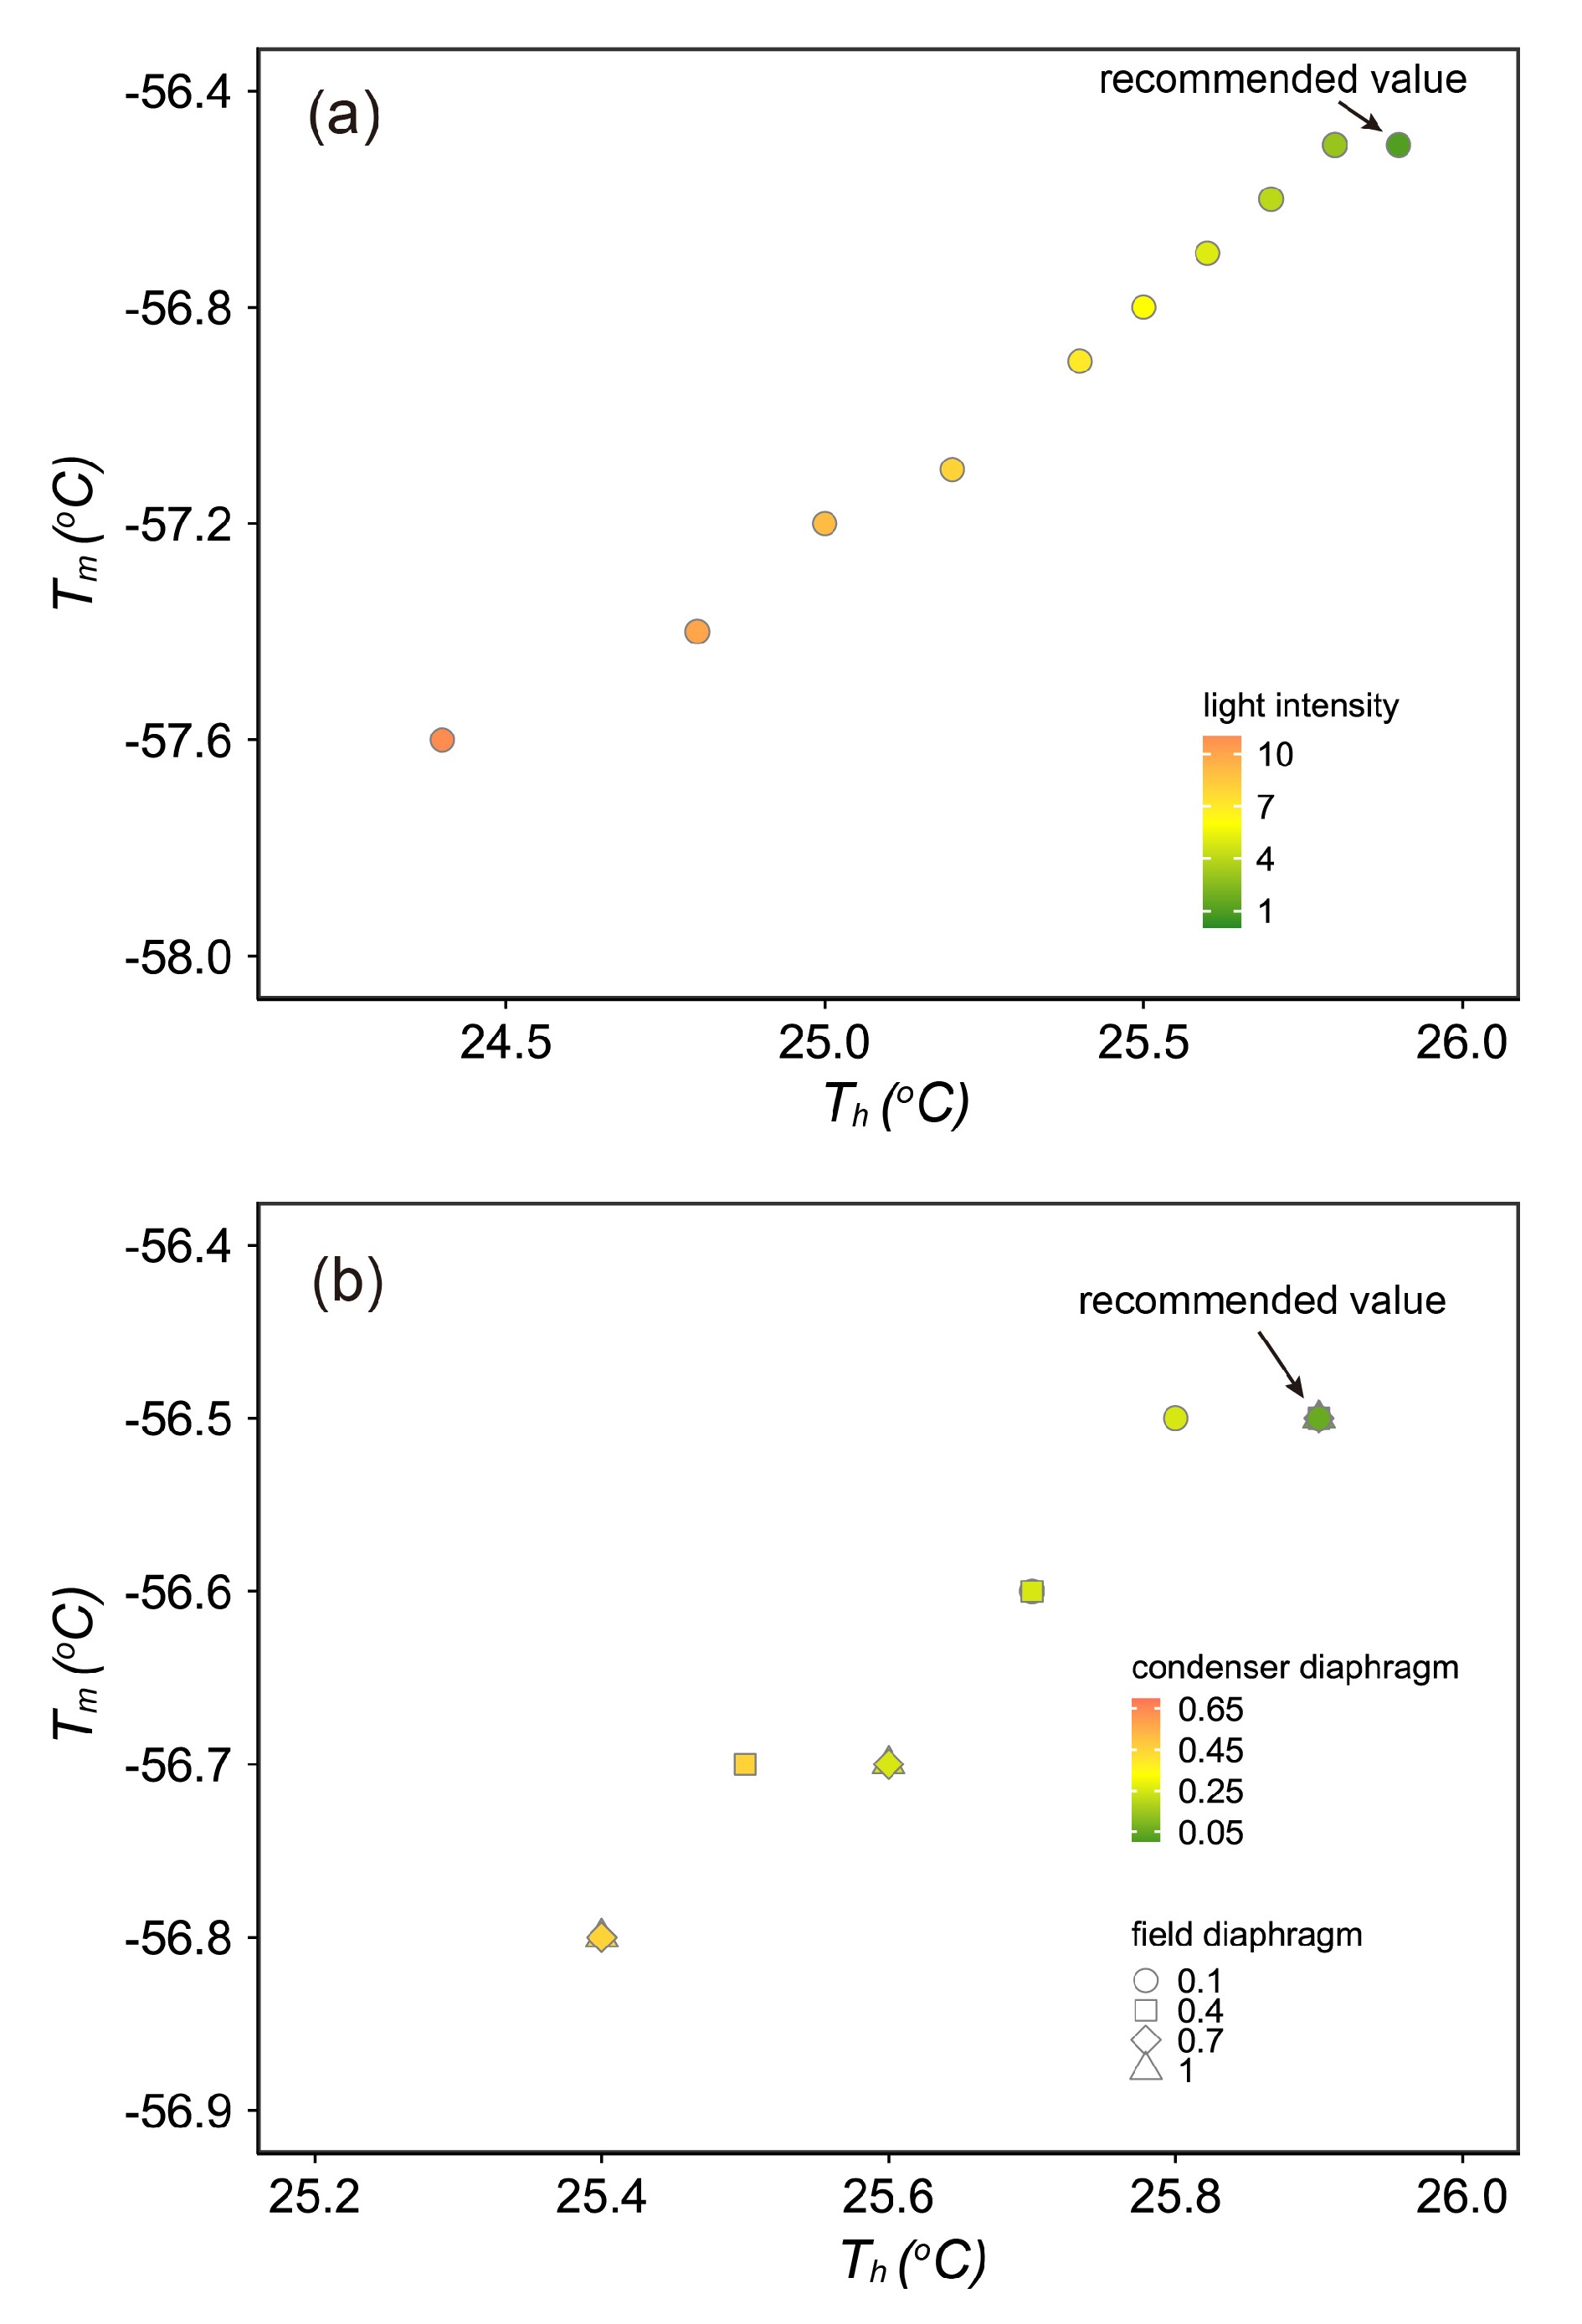
![]() Effects from infrared light intensity (a) and condenser and field diaphragms (b) on the temperature deviations during infrared microthermometry on the standard quartz-hosted CO2 inclusion (USGS). (a) The colors inside the symbols represent different light intensities used during microthermometry. The light intensity number is proportional to the light powder but not real powder value in Watt. (b) The colors inside the symbols represent different condenser diaphragms whereas symbol styles represent different field diaphragms. The light intensity of Degree 6 is used during these measurements.
Effects from infrared light intensity (a) and condenser and field diaphragms (b) on the temperature deviations during infrared microthermometry on the standard quartz-hosted CO2 inclusion (USGS). (a) The colors inside the symbols represent different light intensities used during microthermometry. The light intensity number is proportional to the light powder but not real powder value in Watt. (b) The colors inside the symbols represent different condenser diaphragms whereas symbol styles represent different field diaphragms. The light intensity of Degree 6 is used during these measurements.
-
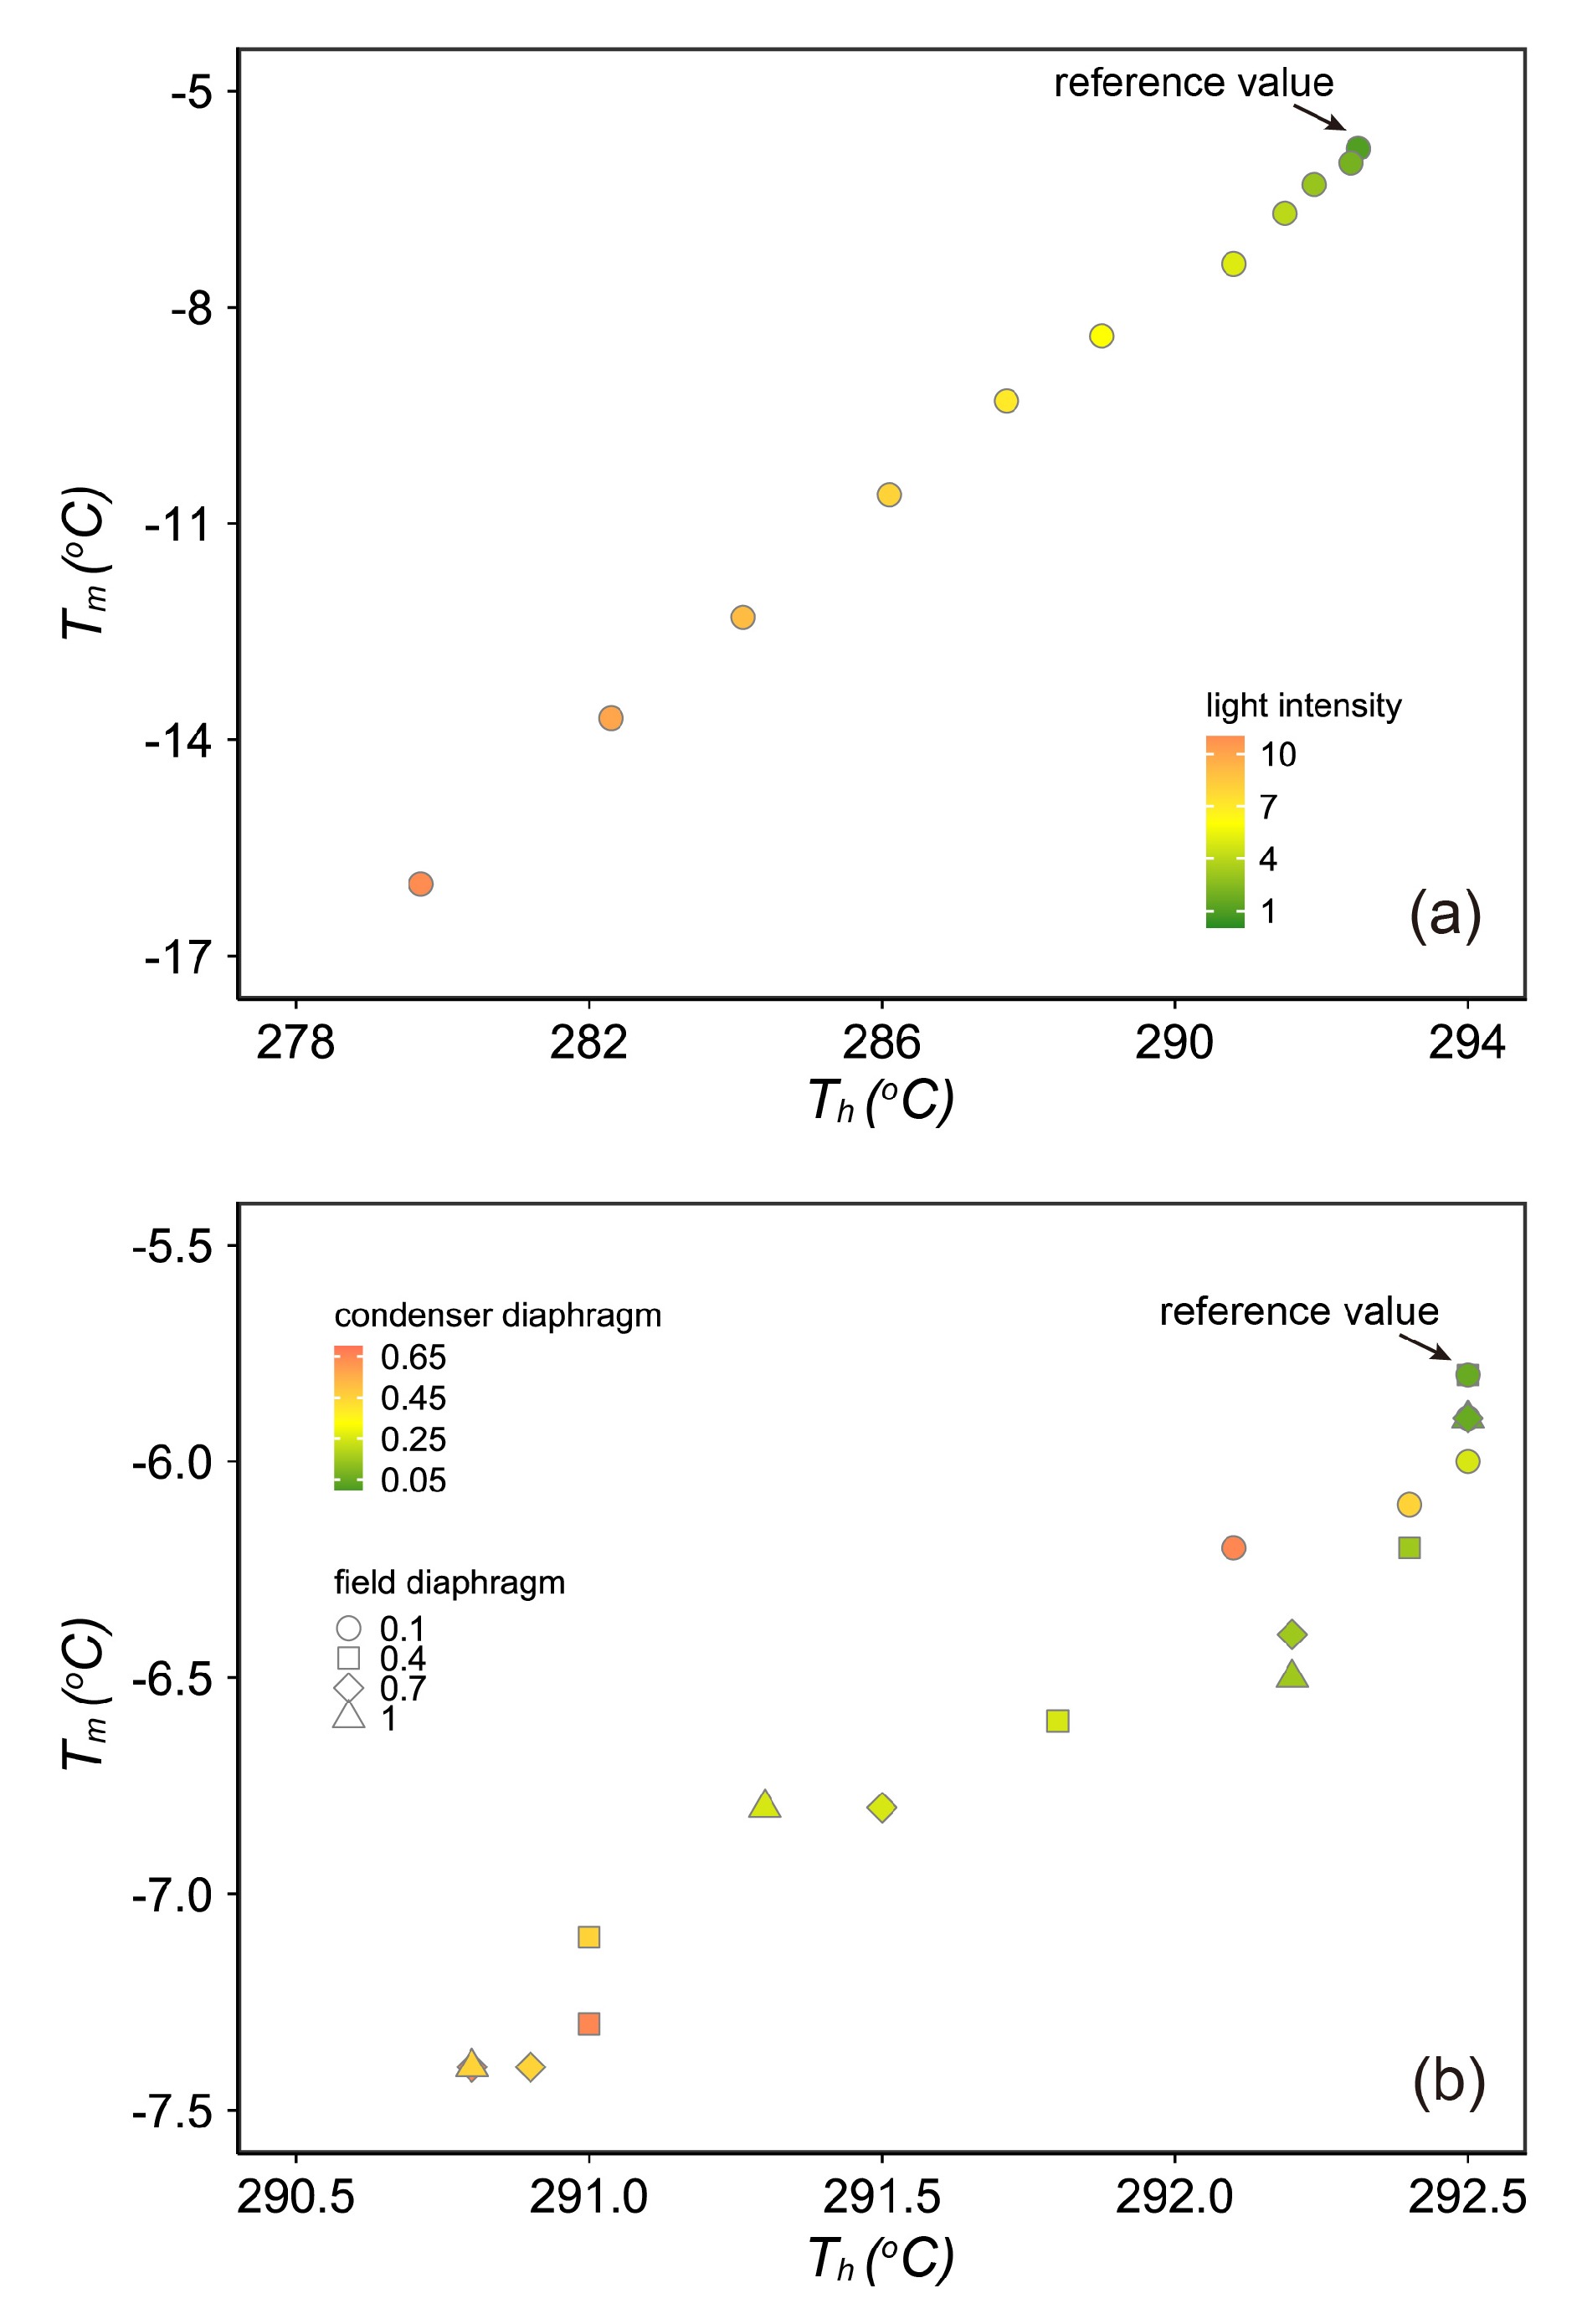
![]() Effects from infrared light intensity (a) and condenser and field diaphragms (b) on the temperature deviations during infrared microthermometry on a sphalerite-hosted saline inclusion. (a): The colors inside the symbols represent different light intensities used during microthermometry. The light intensity number is proportional to the light powder but not real powder value. (b): The colors inside the symbols represent different condenser diaphragms whereas symbol styles represent different field diaphragms. The light intensity of Degree 5 is used during these measurements.
Effects from infrared light intensity (a) and condenser and field diaphragms (b) on the temperature deviations during infrared microthermometry on a sphalerite-hosted saline inclusion. (a): The colors inside the symbols represent different light intensities used during microthermometry. The light intensity number is proportional to the light powder but not real powder value. (b): The colors inside the symbols represent different condenser diaphragms whereas symbol styles represent different field diaphragms. The light intensity of Degree 5 is used during these measurements.
-
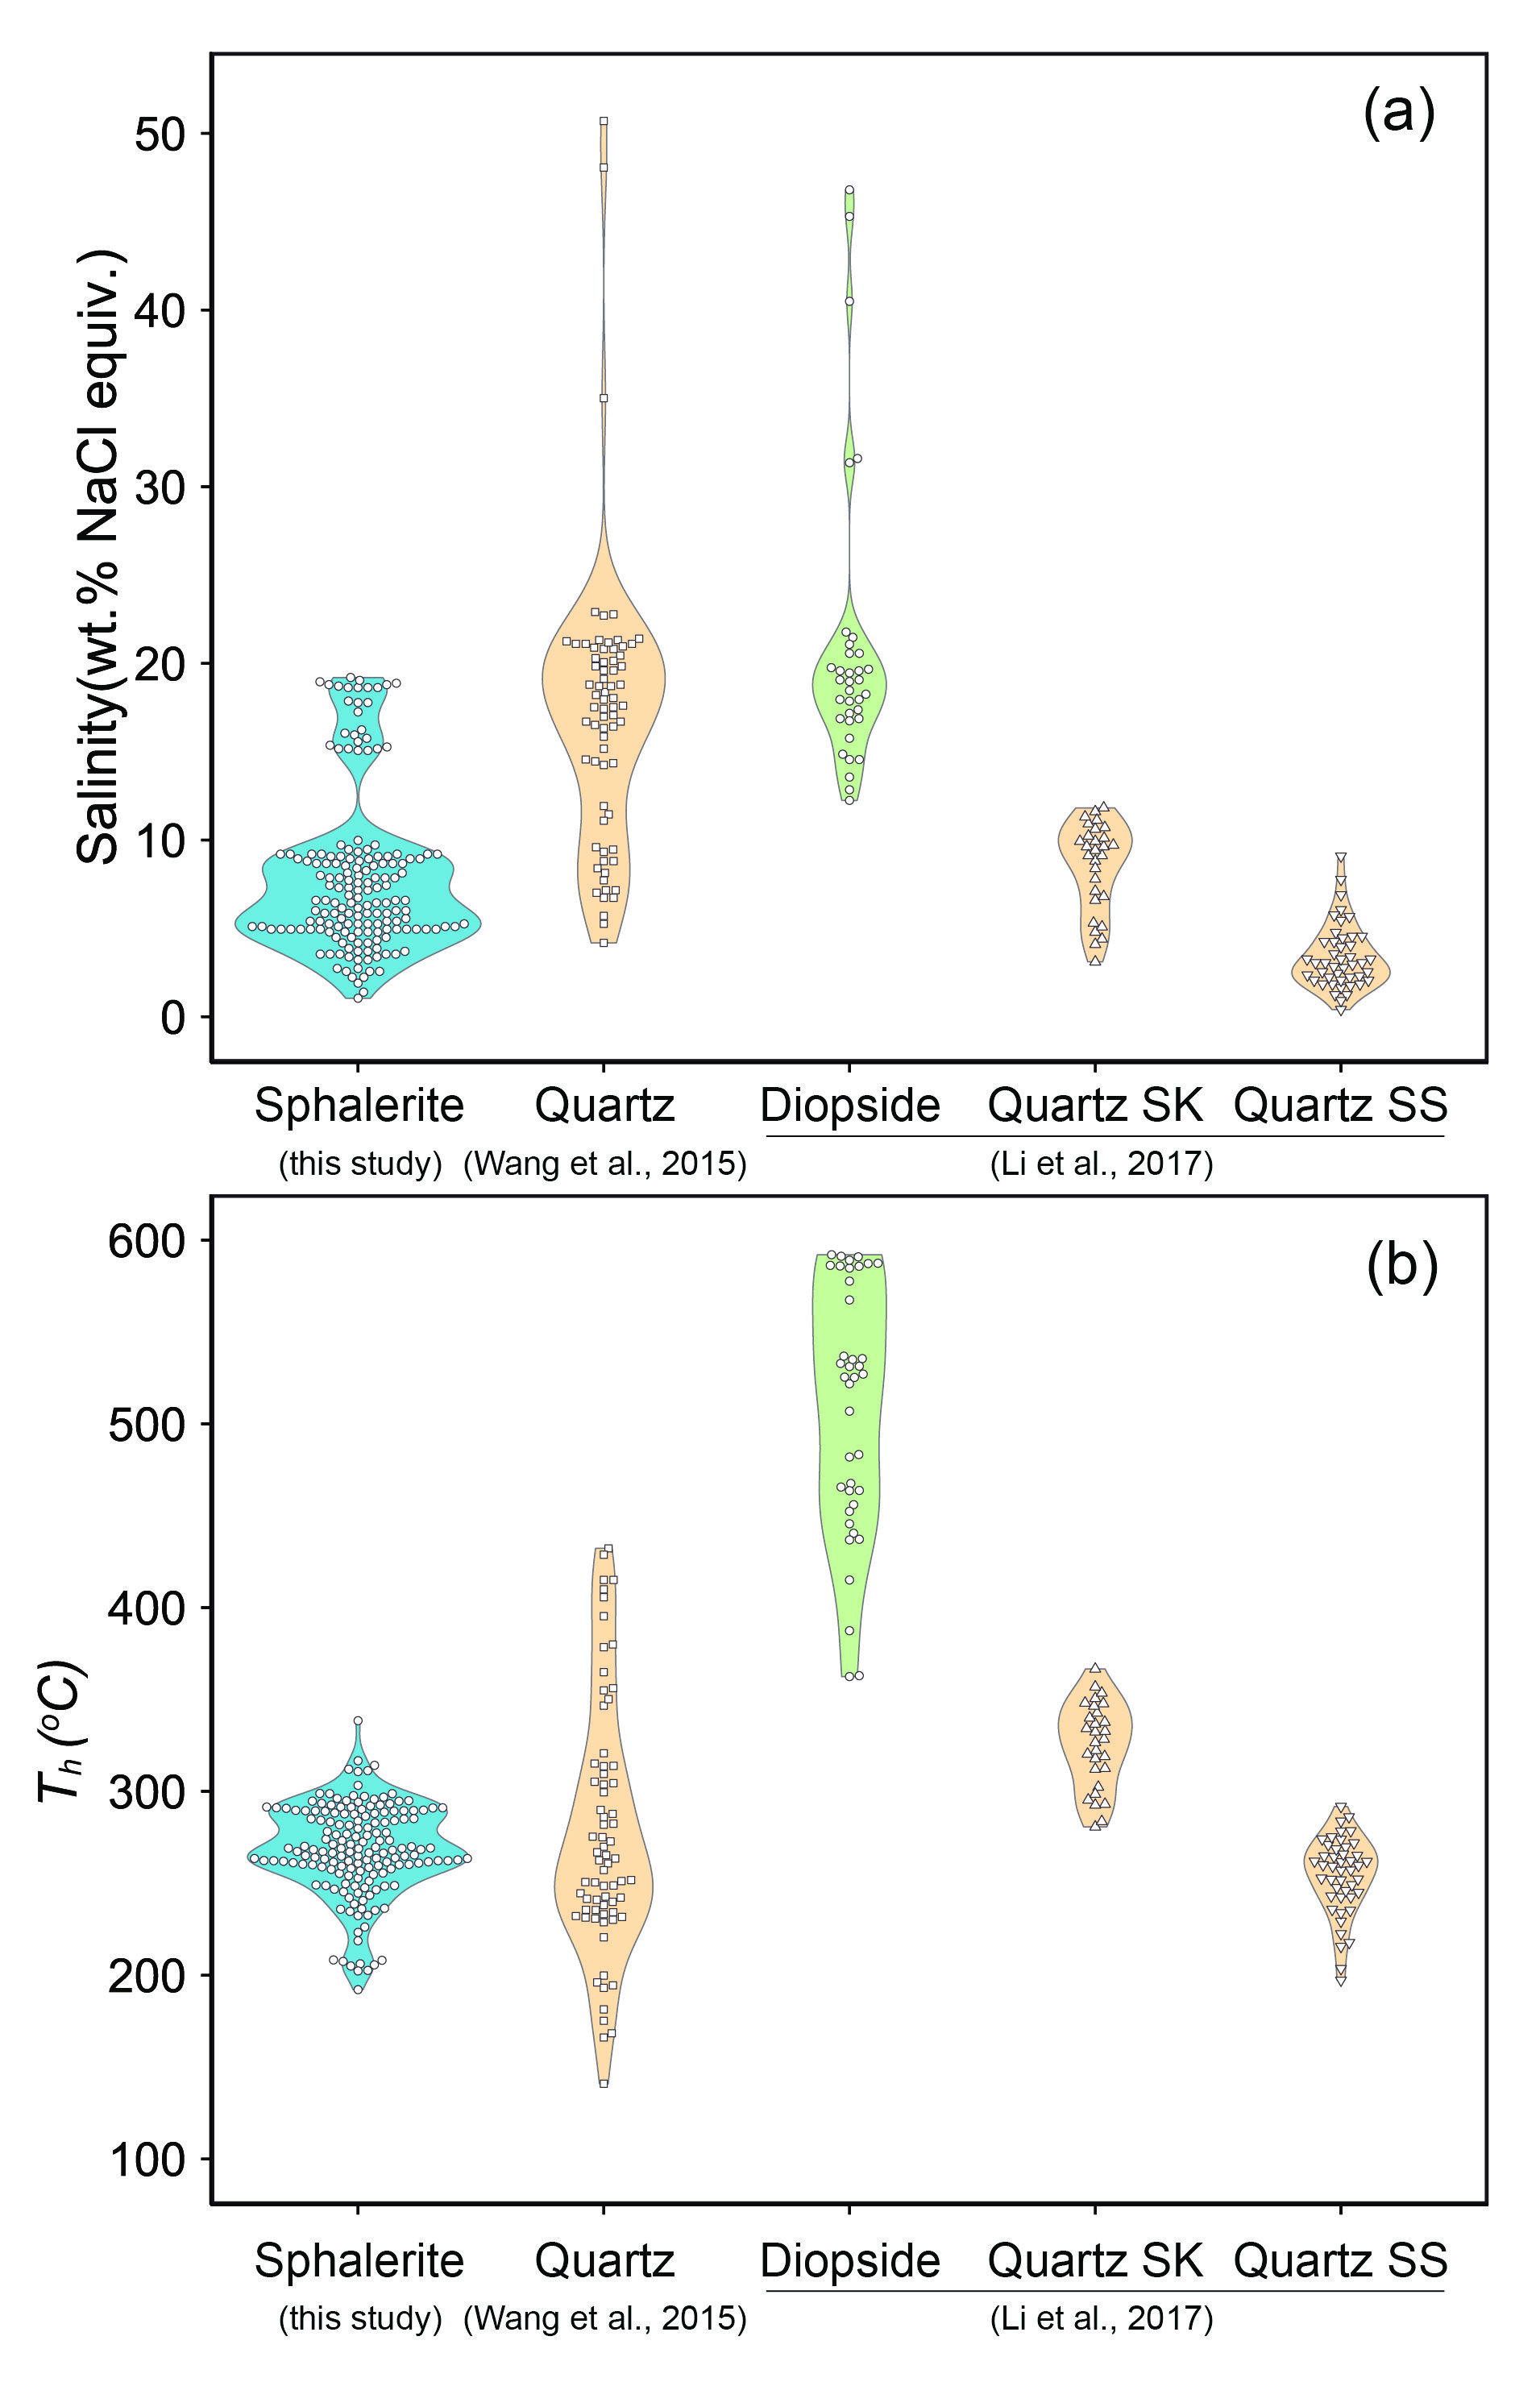
![]() Violin statistics diagrams for salinity (a) and homogenization temperature (b) of inclusions in different host minerals from the Xinqiao deposit. Data of sphalerite-hosted inclusions are from this study, where the other data sources are listed in the abscissa labels. Quartz SK: quartz in skarn. Quartz SS: quartz in sand stone.
Violin statistics diagrams for salinity (a) and homogenization temperature (b) of inclusions in different host minerals from the Xinqiao deposit. Data of sphalerite-hosted inclusions are from this study, where the other data sources are listed in the abscissa labels. Quartz SK: quartz in skarn. Quartz SS: quartz in sand stone.
-
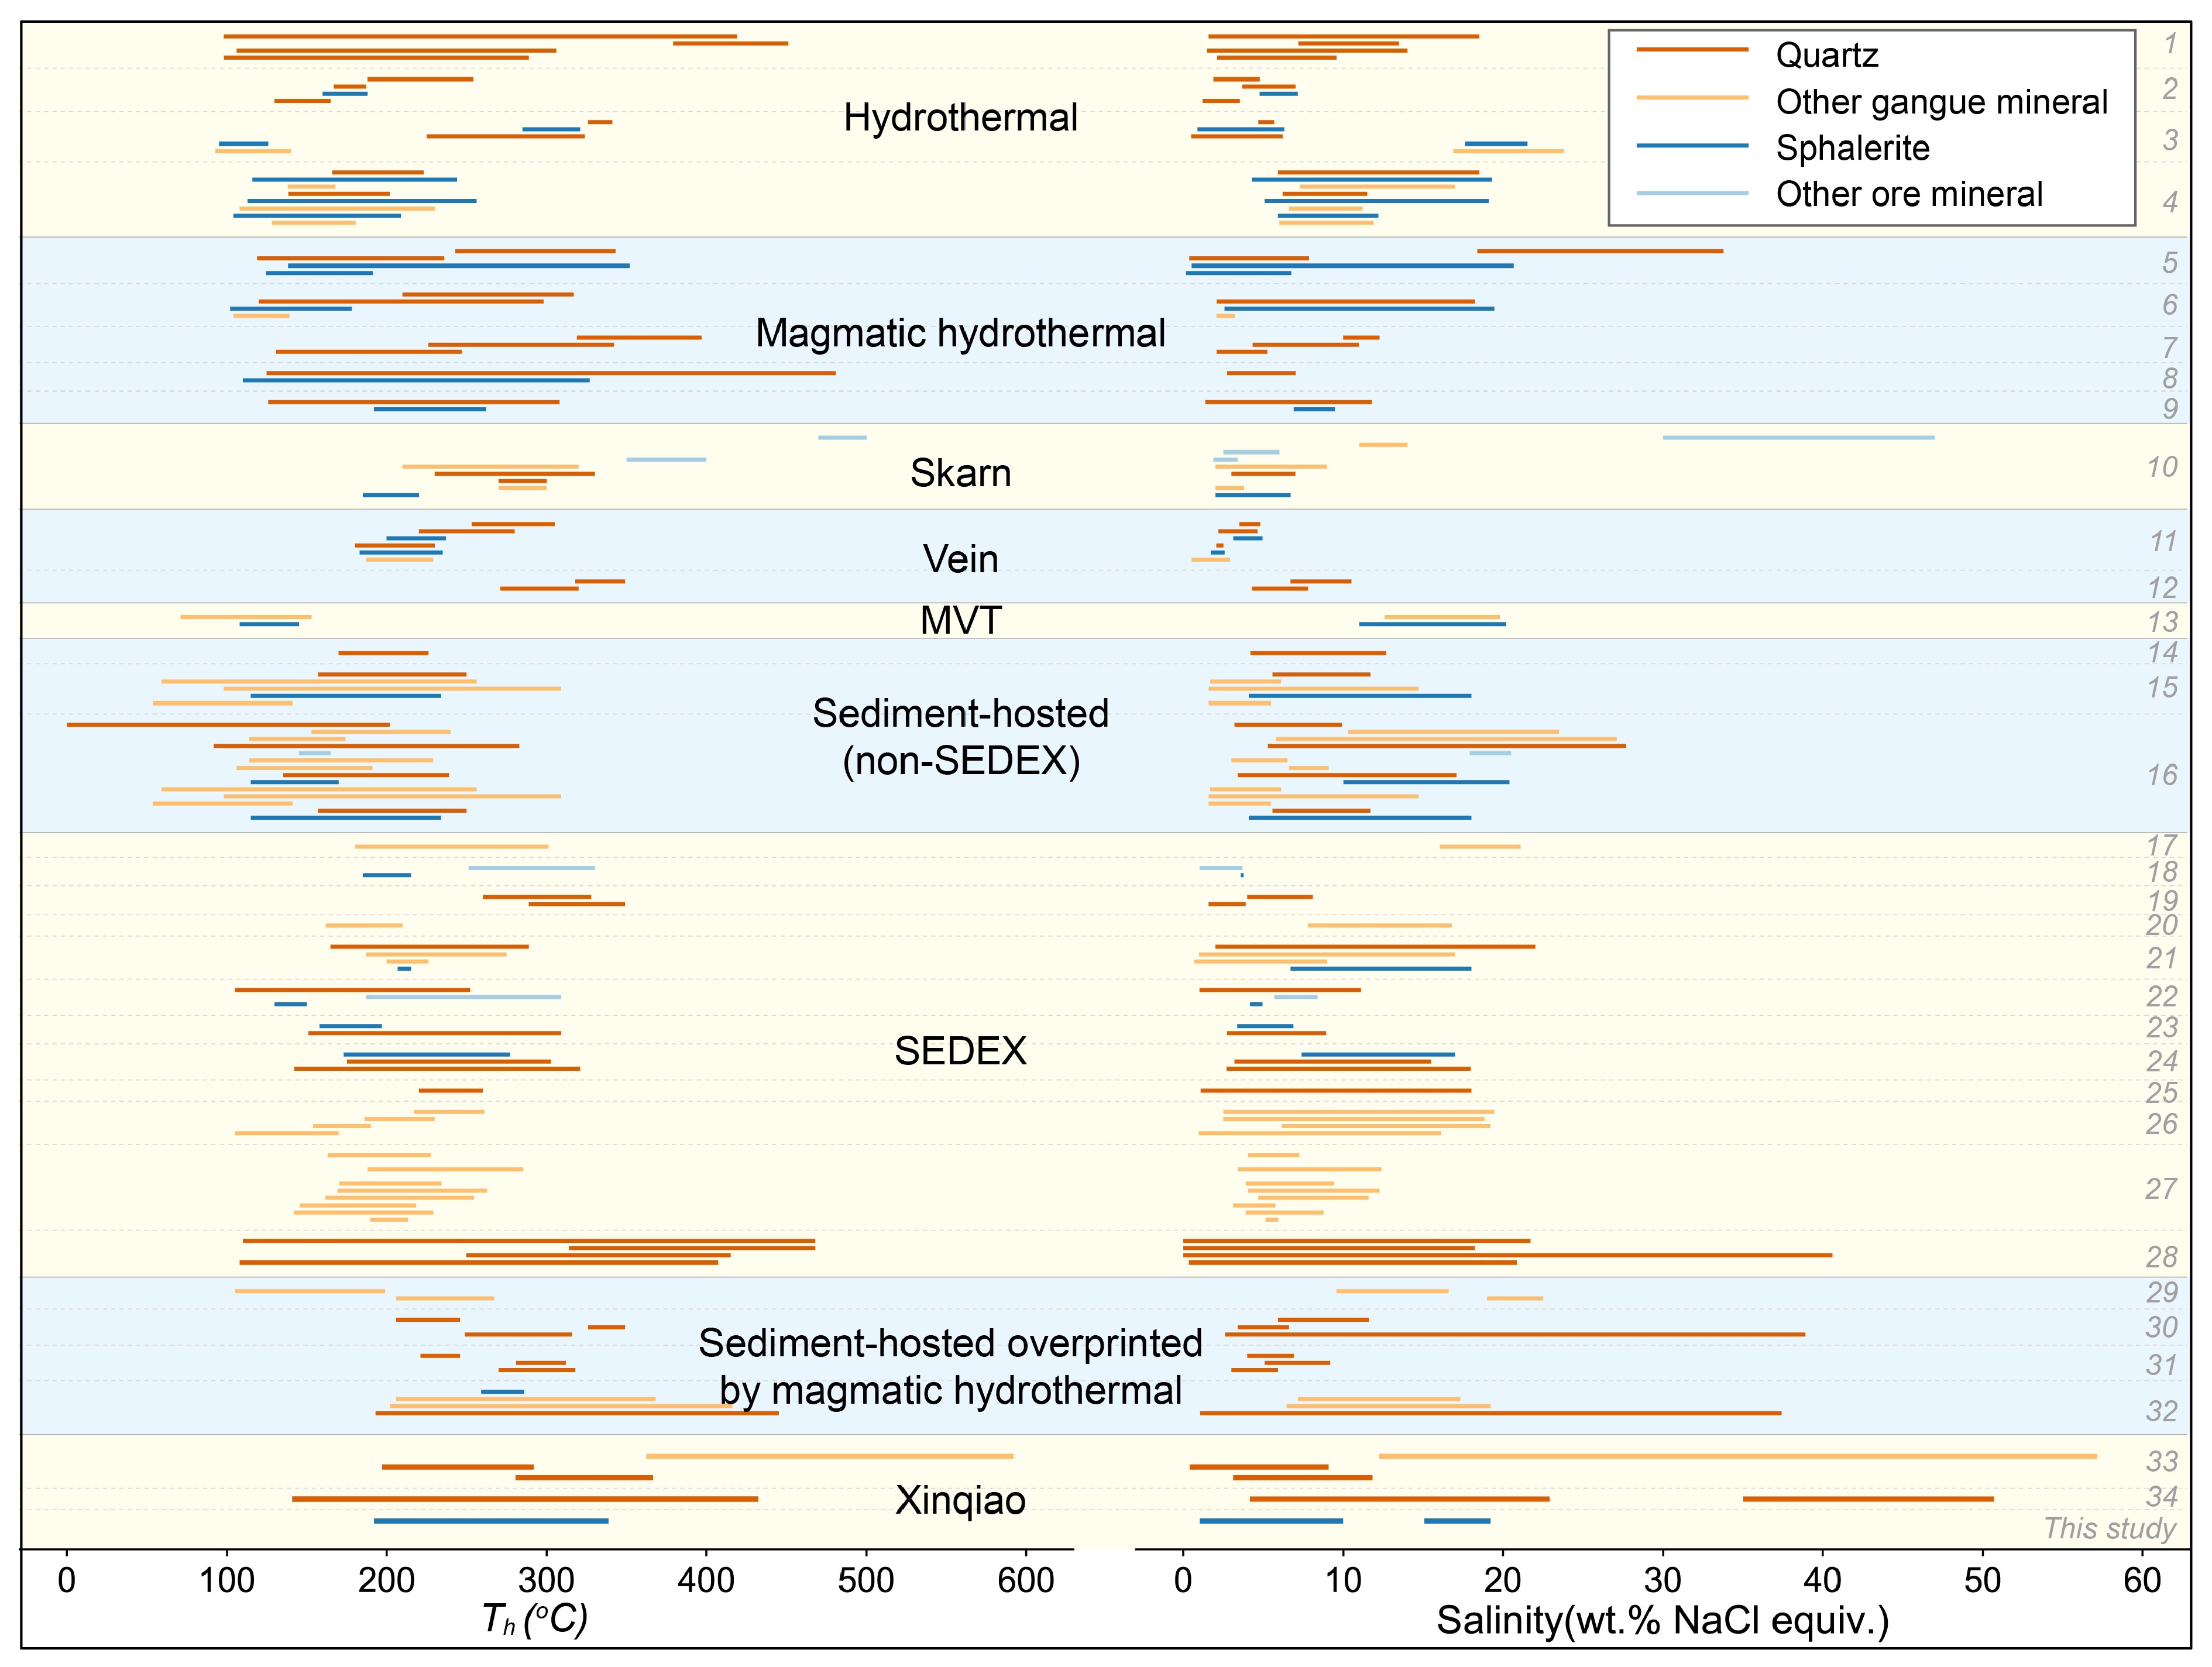
![]() Fluid inclusion microthermometric data of global sphalerite-bearing deposits. Every colorful line represents data of a particular inclusion series that are hosted in the same mineral type or formed during the same stage. The left and right endpoints of the colorful lines are minimum and maximum values (homogenization temperature and salinity) for the particular inclusion series. The alternative color regions between solid horizontal lines represent different deposit types, whereas the region between dashed horizontal line represents the individual deposit as is numbered in the right boundary. The data source could be referred in Table S1 of Supporting Information. MVT: Mississippi valley type. SEDEX: sedimentary exhalative deposit.
Fluid inclusion microthermometric data of global sphalerite-bearing deposits. Every colorful line represents data of a particular inclusion series that are hosted in the same mineral type or formed during the same stage. The left and right endpoints of the colorful lines are minimum and maximum values (homogenization temperature and salinity) for the particular inclusion series. The alternative color regions between solid horizontal lines represent different deposit types, whereas the region between dashed horizontal line represents the individual deposit as is numbered in the right boundary. The data source could be referred in Table S1 of Supporting Information. MVT: Mississippi valley type. SEDEX: sedimentary exhalative deposit.
-
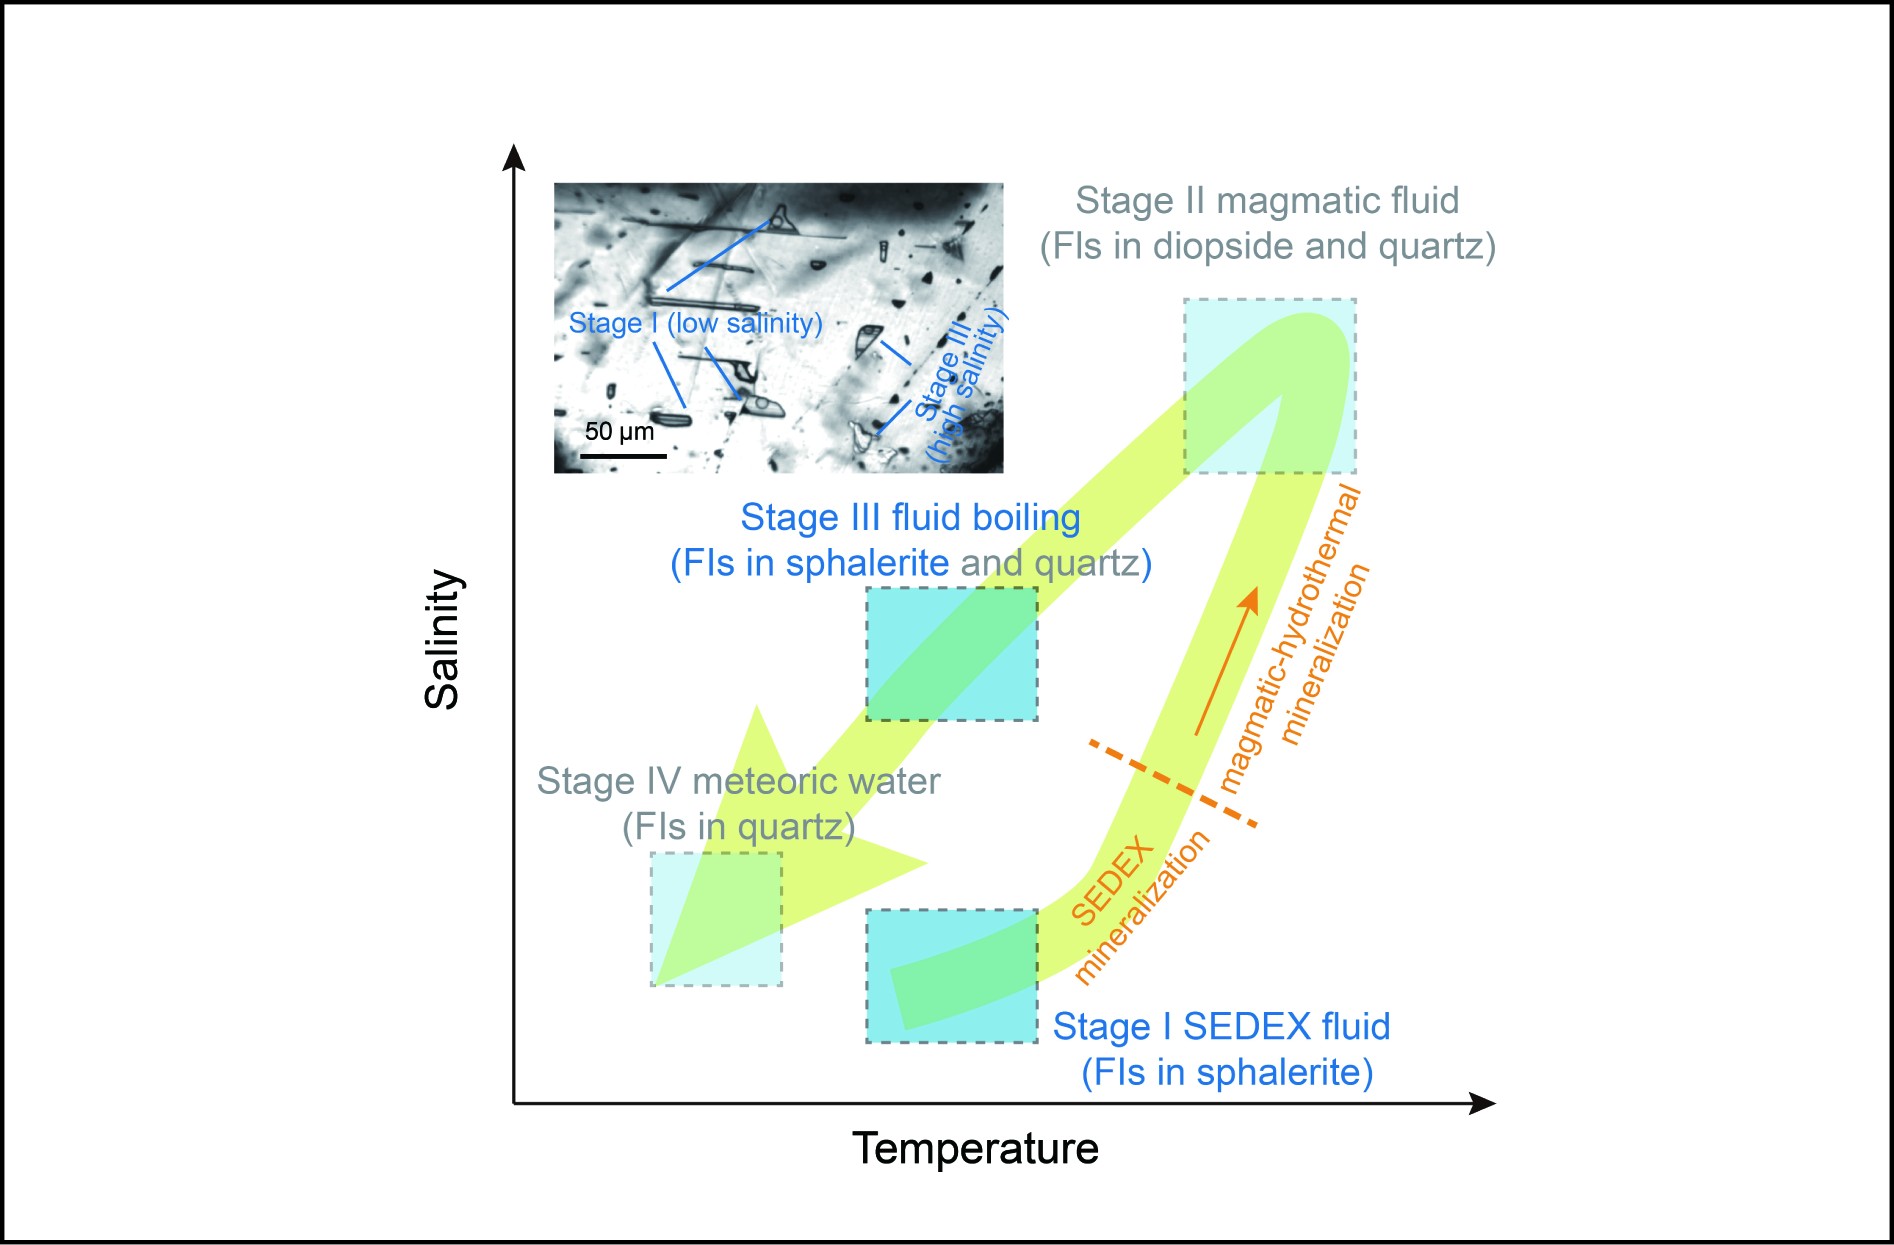
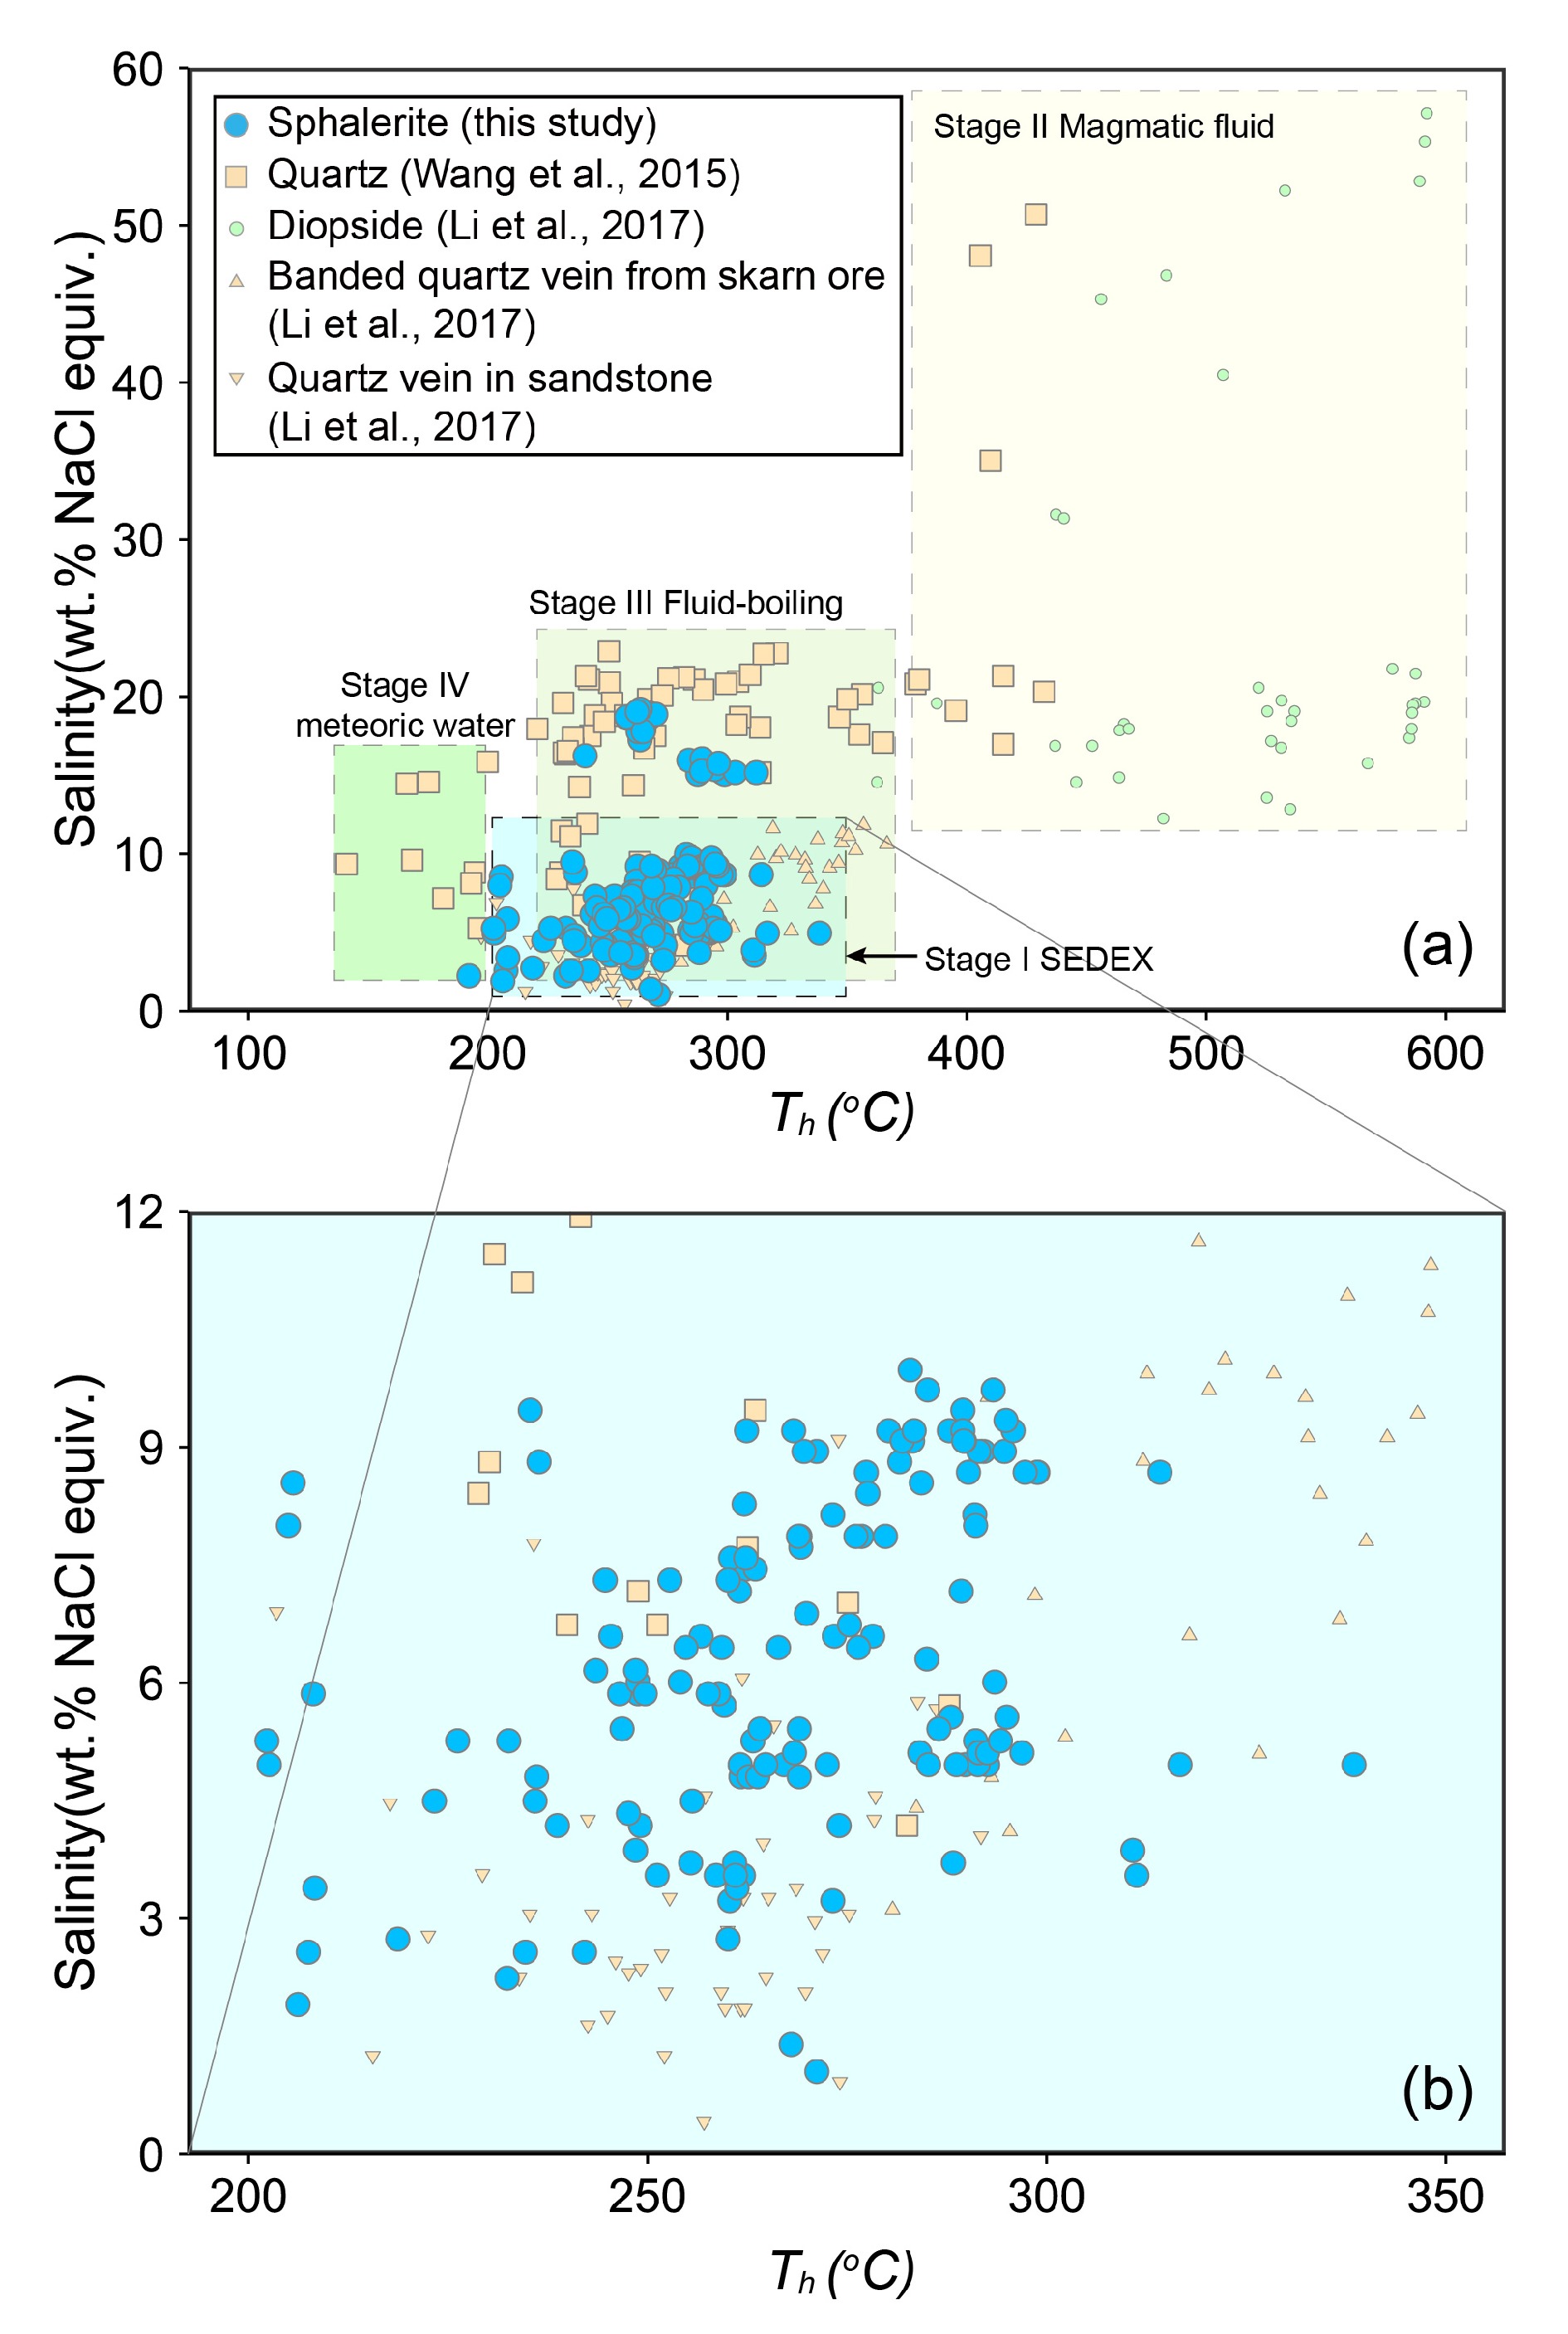
![]() Salinity versus homogenization temperature diagram of the inclusions in the Xinqiao deposit. The four-stage ore-forming fluid evolution is illustrated as four different dashed boxes. (b) is the amplifying diagram of the data in Stage Ⅰ box. SEDEX: sedimentary exhalative deposit.
Salinity versus homogenization temperature diagram of the inclusions in the Xinqiao deposit. The four-stage ore-forming fluid evolution is illustrated as four different dashed boxes. (b) is the amplifying diagram of the data in Stage Ⅰ box. SEDEX: sedimentary exhalative deposit.
Related articles
-
2022, 52(12): 3-1-3-8. DOI: 10.52396/JUSTC-2022-0105
-
2021, 51(6): 459-467. DOI: 10.52396/JUST-2021-0128
-
2020, 50(6): 733-737. DOI: 10.3969/j.issn.0253-2778.2020.06.003
-
2020, 50(2): 185-196. DOI: 10.3969/j.issn.0253-2778.2020.02.014
-
2017, 47(11): 912-918. DOI: 10.3969/j.issn.0253-2778.2017.11.005
-
2016, 46(6): 470-475. DOI: 10.3969/j.issn.0253-2778.2016.06.004
-
2015, 45(5): 388-396. DOI: 10.3969/j.issn.0253-2778.2015.05.007
-
2014, 44(2): 119-127. DOI: 10.3969/j.issn.0253-2778.2014.02.007
-
2013, 43(8): 661-670. DOI: 10.3969/j.issn.0253-2778.2013.08.009
-
2013, 43(5): 355-362. DOI: 10.3969/j.issn.0253-2778.2013.05.002
