Figures of the Article
-
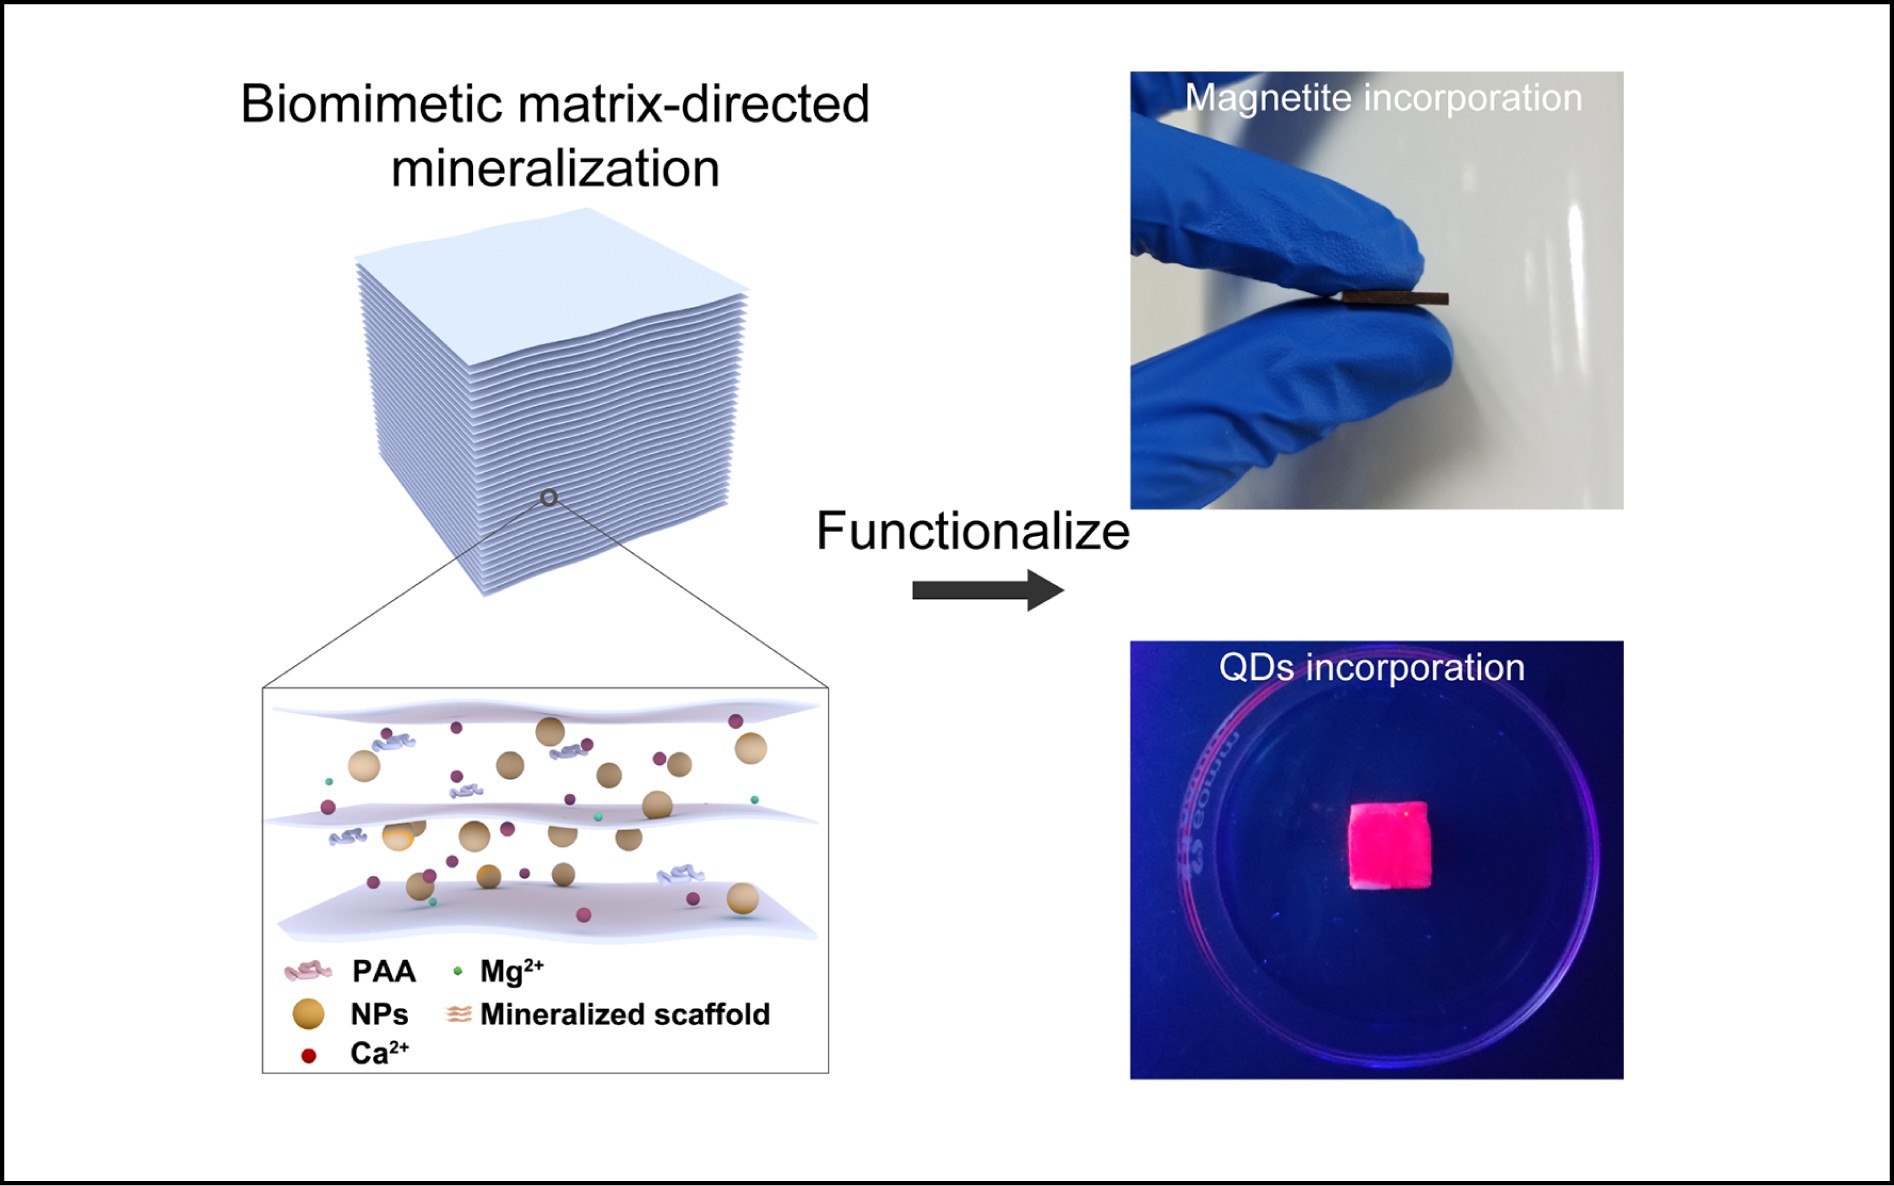
![]() Fabrication scheme of the artificial nacre.
Fabrication scheme of the artificial nacre.
-
![]() Microstructure comparison between natural nacre and artificial nacre. (a) Abalone nacre. (b, c) Artificial nacre: (b) QDN and (c) FeN. The inset in (b) shows the PL of the original QDs. (d–f) Fracture surface of the (d) abalone nacre, (e) QDN, and (f) FeN. (g–i) Aragonitic layer of the (g) abalone nacre, (h) the QDN, and (i) FeN. (j–l) Enlarged micrographs of the aragonite platelets of the (j) abalone nacre, (k) QDN, and (l) FeN.
Microstructure comparison between natural nacre and artificial nacre. (a) Abalone nacre. (b, c) Artificial nacre: (b) QDN and (c) FeN. The inset in (b) shows the PL of the original QDs. (d–f) Fracture surface of the (d) abalone nacre, (e) QDN, and (f) FeN. (g–i) Aragonitic layer of the (g) abalone nacre, (h) the QDN, and (i) FeN. (j–l) Enlarged micrographs of the aragonite platelets of the (j) abalone nacre, (k) QDN, and (l) FeN.
-
![]() Characteristics of the artificial nacre. (a) XRD patterns for the QDN and FeN. (b) Photoluminescence spectra of the QDN. (c) Magnetic hysteresis loops of the FeN.
Characteristics of the artificial nacre. (a) XRD patterns for the QDN and FeN. (b) Photoluminescence spectra of the QDN. (c) Magnetic hysteresis loops of the FeN.
-
![]() Composition analysis of the artificial nacre with different NPs.
Composition analysis of the artificial nacre with different NPs.
-
![]() Influence of the sizes and surface charges of the NPs on the microstructures of the artificial nacre. (a–h) Fracture surface of the artificial nacre: (a) FeN10−, (b) FeN10+, (c) FeN25−, (d) FeN25+, (e) FeN80−, (f) FeN80+, (g) FeN150−, and (h) FeN350−. FeN10− is the artificial nacre incorporated with ~ 10 nm negatively charged NPs.
Influence of the sizes and surface charges of the NPs on the microstructures of the artificial nacre. (a–h) Fracture surface of the artificial nacre: (a) FeN10−, (b) FeN10+, (c) FeN25−, (d) FeN25+, (e) FeN80−, (f) FeN80+, (g) FeN150−, and (h) FeN350−. FeN10− is the artificial nacre incorporated with ~ 10 nm negatively charged NPs.
-
![]() Morphology of the NPs with different surface properties in the solution. (a–h) SEM images of the dried mineralizing solution samples with (a) Fe3O4[10]− NPs, (b) Fe3O4[25]− NPs, (c) Fe3O4[80]− NPs, (d) Fe3O4[150]− NPs, (e) Fe3O4[350]− NPs, (f) Fe3O4[10]+ NPs, (g) Fe3O4[25]+ NPs, and (h) Fe3O4[80]+ NPs. Fe3O4[10]− denotes the negatively charged Fe3O4 NPs with approximately 10 nm diameter.
Morphology of the NPs with different surface properties in the solution. (a–h) SEM images of the dried mineralizing solution samples with (a) Fe3O4[10]− NPs, (b) Fe3O4[25]− NPs, (c) Fe3O4[80]− NPs, (d) Fe3O4[150]− NPs, (e) Fe3O4[350]− NPs, (f) Fe3O4[10]+ NPs, (g) Fe3O4[25]+ NPs, and (h) Fe3O4[80]+ NPs. Fe3O4[10]− denotes the negatively charged Fe3O4 NPs with approximately 10 nm diameter.
-
![]() Mechanical performance of artificial nacre: (a) Vickers hardness (at a load of HV0.3) and (b) flexural strength of different artificial nacre samples.
Mechanical performance of artificial nacre: (a) Vickers hardness (at a load of HV0.3) and (b) flexural strength of different artificial nacre samples.


 Download:


