CAS Key Laboratory of Geospace Environment, School of Earth and Space Sciences, University of Science and Technology of China, Hefei 230026, China
2.
Hefei National Laboratory, University of Science and Technology of China, Hefei 230026, China
3.
Hefei National Research Center for Physical Sciences at the Microscale and School of Physical Sciences, University of Science and Technology of China, Hefei 230026, China
4.
Anhui Mengcheng Geophysics National Observation and Research Station, University of Science and Technology of China, Hefei 230026, China
Wei Zhong is a Post-doctor Researcher at the University of Science and Technology of China (USTC). He received his Ph.D. degree from USTC in 2024. His research mainly focuses on dual-comb spectroscopy and trace-gases remote sensing
Xianghui Xue is a Professor at the University of Science and Technology of China (USTC). He received his Ph.D. degree in Space Physics from USTC in 2007. His research mainly focuses on middle and upper atmosphere (MLT) and lidar sensing
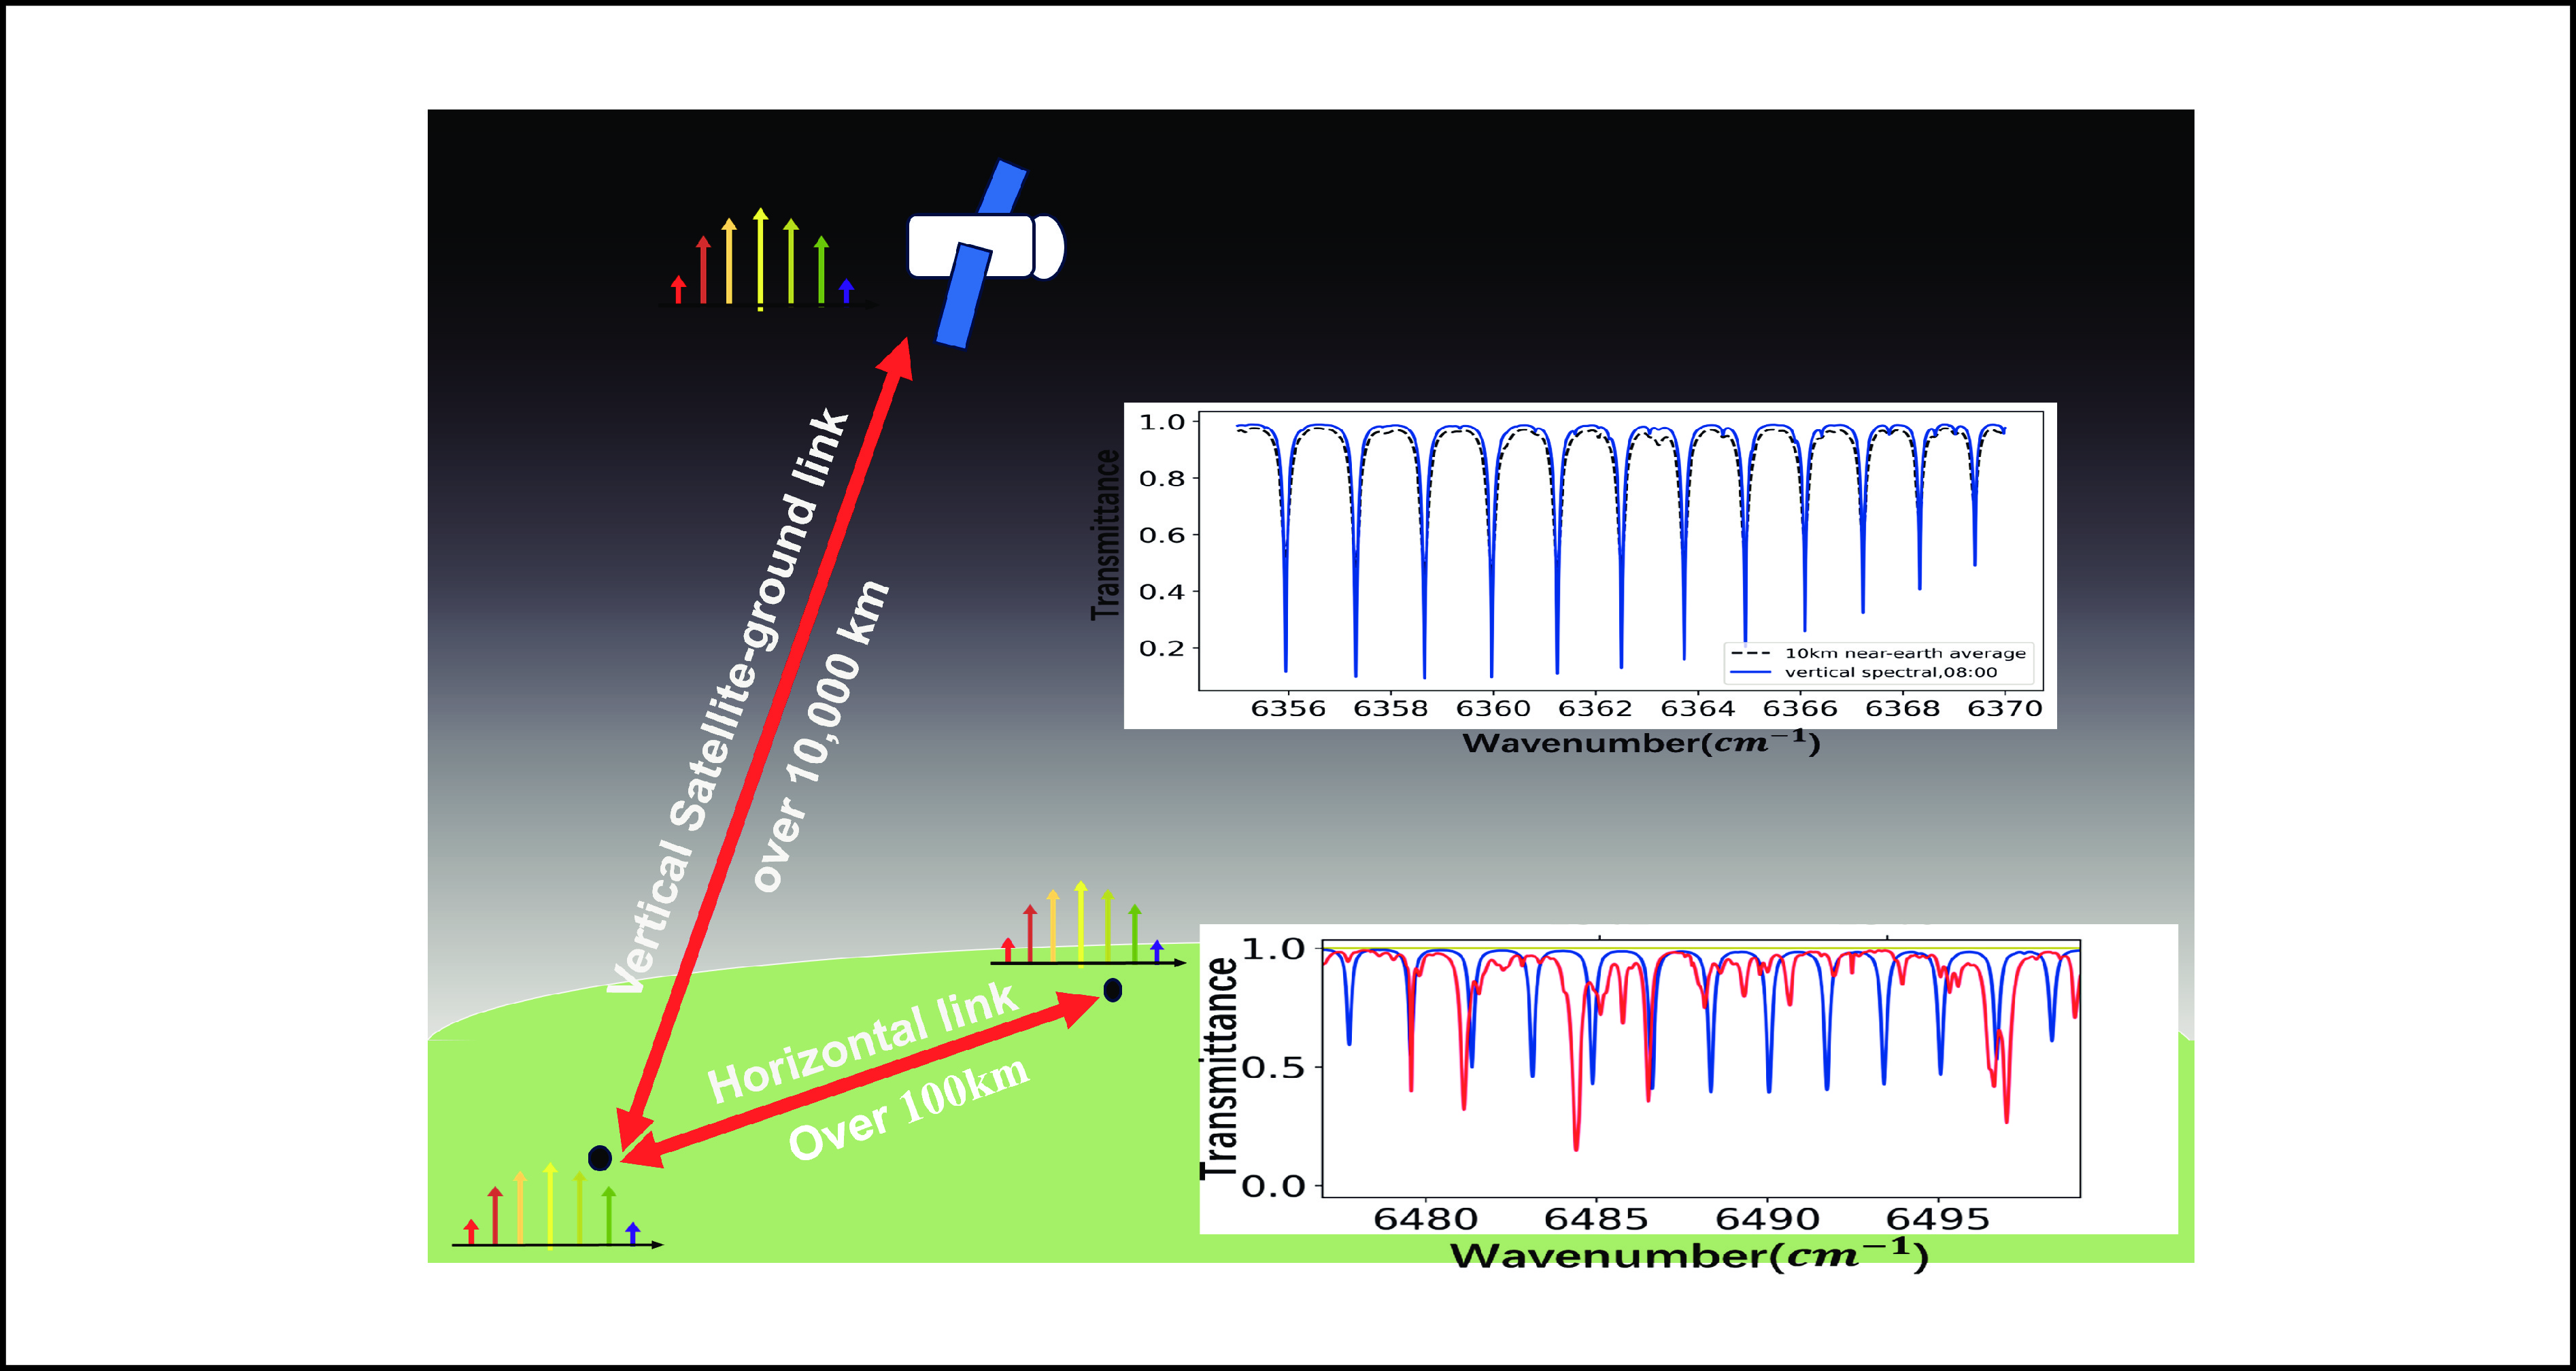
Dual-comb spectroscopy (DCS) is one of the most promising technologies for ultra-long open-path multiple greenhouse gas detection. Ultra-long open-path DCS has the potential to realize detection configurations, such as horizontal open-path links over hundreds of kilometers and vertical open-path links between satellites and the ground base. Under these extreme detection conditions, identifying an appropriate wavelength band that ensures both technical feasibility and a reasonable absorbance for target components is critical but currently lacks studies. In this work, we simulate transmission spectra under different detection configurations to identify optimal wavelength bands for CO2 and CH4 measurement. The simulation results show that the 1540 nm Watt-level high-power frequency combs developed are suitable for CO2 measurement in both horizontal and vertical ultra-long detection configurations. The results also suggest that developing high-power fiber amplifiers for combs at 1630 nm and 1636 nm will facilitate CH4 measurement in horizontal and vertical ultra-long detection configurations, respectively. The amplification at 1636 nm will be a future research focus, as it is expected to enable simultaneous measurements of CH4, CO2, and water vapor in the vertical detection configuration.
Graphical Abstract
Selecting suitable wavelength bands for ultra-long open-path dual-comb spectroscopy, is necessary for building a future GHGs global monitoring network.
Abstract
Dual-comb spectroscopy (DCS) is one of the most promising technologies for ultra-long open-path multiple greenhouse gas detection. Ultra-long open-path DCS has the potential to realize detection configurations, such as horizontal open-path links over hundreds of kilometers and vertical open-path links between satellites and the ground base. Under these extreme detection conditions, identifying an appropriate wavelength band that ensures both technical feasibility and a reasonable absorbance for target components is critical but currently lacks studies. In this work, we simulate transmission spectra under different detection configurations to identify optimal wavelength bands for CO2 and CH4 measurement. The simulation results show that the 1540 nm Watt-level high-power frequency combs developed are suitable for CO2 measurement in both horizontal and vertical ultra-long detection configurations. The results also suggest that developing high-power fiber amplifiers for combs at 1630 nm and 1636 nm will facilitate CH4 measurement in horizontal and vertical ultra-long detection configurations, respectively. The amplification at 1636 nm will be a future research focus, as it is expected to enable simultaneous measurements of CH4, CO2, and water vapor in the vertical detection configuration.
Public Summary
Conduct the wavelength bands selection studied for ultra-long open-path dual-comb spectroscopy for the first time.
Based on stimulated transmission spectral results, discuss the feasibility and suitable wavelength band for ultra-long open-path dual-comb spectroscopy in both horizontal and vertical configuration. The discussion provides a guidance for future GHGs global monitoring network development, especially for the part of high-power fiber amplifier.
According to the results, high-power frequency combs between 1634 and 1639 nm allow for simultaneous measurements of methane, CO2, and water vapor in the vertical open-path direction. The amplifier in this wavelength bandwidth will be a hotspot and key technique for development of satellite-to-ground link.
Since the Industrial Revolution, human activities have intensified, leading to climate change issues that threaten human survival. Understanding the mechanisms of human-induced climate change is crucial for addressing this existential crisis. Accurate monitoring of greenhouse gases (GHGs) across multiple time and space scales is essential for such studies[1, 2]. Broadband molecular spectroscopy offers a powerful tool for analyzing components and quantifying the concentration of multiple gas-phase species simultaneously, making it suitable for GHGs research[3]. Open-path measurement is averaged over small-scale turbulent eddies, offering a more representative atmospheric composition for a given area. Additionally, open-path measurement avoids biases caused by sample handling, such as reactions or losses[4]. However, broadband coherent laser sources are difficult to obtain. Broadband spectroscopy techniques for atmospheric components detection rely mainly on passive detection [5] or active detection with incoherent sources[6, 7]. Both techniques, however, face limitations in open-path measurements, including short detection distances, low precision, and observation time restrictions. For example, passive solar-based detection cannot operate at night, and Fourier transform infrared spectroscopy (FTIR) techniques with incoherent sources are typically limited to a few hundred meters and are vulnerable to atmospheric turbulence.
The invention of the optical frequency comb in 2000 provided a highly coherent broadband light source, a game changer for precision spectroscopy[8, 9]. Because the optical frequency comb operates at a carrier oscillation frequency of hundreds of THz in the time domain and features evenly spaced comb teeth at the hundred MHz scale in the frequency domain, state-of-the-art direct optical detection technologies are unable to analyze the spectral information of the comb effectively, regardless of in the time or frequency domain[10]. To address this issue effectively, dual-comb spectroscopy (DCS) was proposed[11–14]. DCS utilizes optical linear sampling between two frequency combs with a slight repetition difference to obtain precise spectral information from the interaction between the comb light and the materials. Essentially, it is a type of time-domain Fourier spectroscopy that has the ability to detect broadband spectra in parallel by using one photon detector[15, 16]. While in the frequency domain, it downcoverts the spectral information from the optical frequency into the radio frequency through multiheterodyne interference between hundreds and thousands of comb modes from two combs[17].
DCS does not require any mechanical scanning structures; its precision, accuracy and ultimate signal-to-noise ratio (SNR) primarily depend on the stability and coherence of the two comb sources[18–20]. More importantly, compared with techniques such as Fourier transform spectroscopy (FTIS)[21], DCS offers much faster spectral scanning, allowing for rapid atmospheric monitoring, where atmospheric turbulence is effectively frozen[22]. The optical scanning characteristic makes DCS highly suitable for integration into portable, field-deployable platforms. The fast spectral scanning capability of DCS allows it to resist interference from atmospheric turbulence and even capture the dispersive phase spectra of atmospheric molecules [23], which cannot be achieved by other techniques. After the vertification of precision and accuracy, the technology has evolved toward practical daily applications[24]. The maturity of polarization-maintaining fiber combs[25] and a “bootstrapped” scheme with a narrow-linewidth fiber laser[26] has enabled the development of highly coherent, integrated DCS systems. These systems are well suited for vehicle-mounted or airborne deployment, providing high-precision multicomponent gas monitoring in various field environments. It has already demonstrated remarkable advantages in regional monitoring applications, such as oil and gas leakage detection[27] and vehicle exhaust emission detection[28].
While open-path DCS has shown enormous potential for long-range measurements, current systems are limited to few-kilometer regional monitoring, restricting its use to large-scale high-precision multicomponent measurements. To achieve coverage of emissions from medium- to large-sized cities and even vertical link measurements between satellites and ground bases, DCS that has the ability to remote over a hundred-kilometer horizontal open path is necessary[29]. This large-scale, high-precision monitoring ability, including long-range open-path atmospheric measurements, is critical for establishing a comprehensive global GHGs monitoring network. However, achieving ultra-long DCS requires overcoming several great technical challenges. Notably, a 113 km open-path DCS has been demonstrated recently by using a proposed two-way DCS configuration that uses high-power combs and synchronizes the frequency standard between the two stations[30].
The 113 km open-path DCS overcomes the significant challenge of link attenuation as a proof of principle. After solving the issues of attenuation and frequency accuracy for long-range dual-comb absorption spectra, the next critical step is identifying and developing suitable detection wavelength bands for practical ultra-long open-path scenarios in both horizontal and vertical links. Therefore, a theoretical study on the selection of wavelength bands is necessary to guide future designs and technological developments. Here, we use the high-resolution transmission molecular absorption database (Hitran2024) and the atmosphere community climate model (MERRA-2) to conduct ultra-long open-path spectral simulations. On the basis of the simulation results, we discuss and identify suitable wavelength bands for different conditions, providing guidance for establishing a standardized, all-day GHGs global monitoring network in the future.
2.
Principle of open-path DCS
For open-path dual-comb spectroscopy, we focus on the atmospheric transmission spectrum obtained via Fourier analysis of the original detected time-domain interferograms. The atmospheric transmission spectrum includes the spectral background (or baseline) with a gently sloping spectral profile and the spectral absorption or dispersion information with deep and narrow spectral profiles.
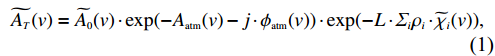
The atmospheric transmission spectrum satisfies Beer–Lambert’s law. The emitted broadband light source can be represented by the complex spectrum ~A0(v). After the light passes through a certain atmospheric path length, the transmitted spectrum ~AT(v) detected can be expressed as:
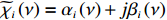
where L represents the total absorption path length and where the subscript i denotes different trace gases, such as carbon dioxide, methane, or water molecules, in our studies. ˜χi(ν)=αi(ν)+jβi(ν) is the complex scattering cross-section of each molecule, with the real part αi(ν) corresponding to the absorption effect and the imaginary part βi(ν)corresponding to the dispersion effect of the interaction between the molecule and the light. The second term in Eq. (1), Aatm(ν) and ϕatm(ν), describes the energy attenuation and dispersion effects caused by the atmosphere. The third term in Eq. (1) describes the interaction between comb light and target trace gas molecules. This term is what we are interested in and is used to retrieve the concentrations of multiple substances in the atmosphere. The first two terms on the right side of Eq. (1) represent a relatively smooth variation in the spectrum compared with the third term. By using pre-calibration methods or spectral baseline fitting algorithms[20, 22, 23], the baseline can be removed to obtain the atmospheric absorption or dispersion spectrum. Then, the real-time concentration can be retrieved from the absorption or dispersion spectrum by using an inversion algorithm along with a molecular absorption database such as HITRAN[31].
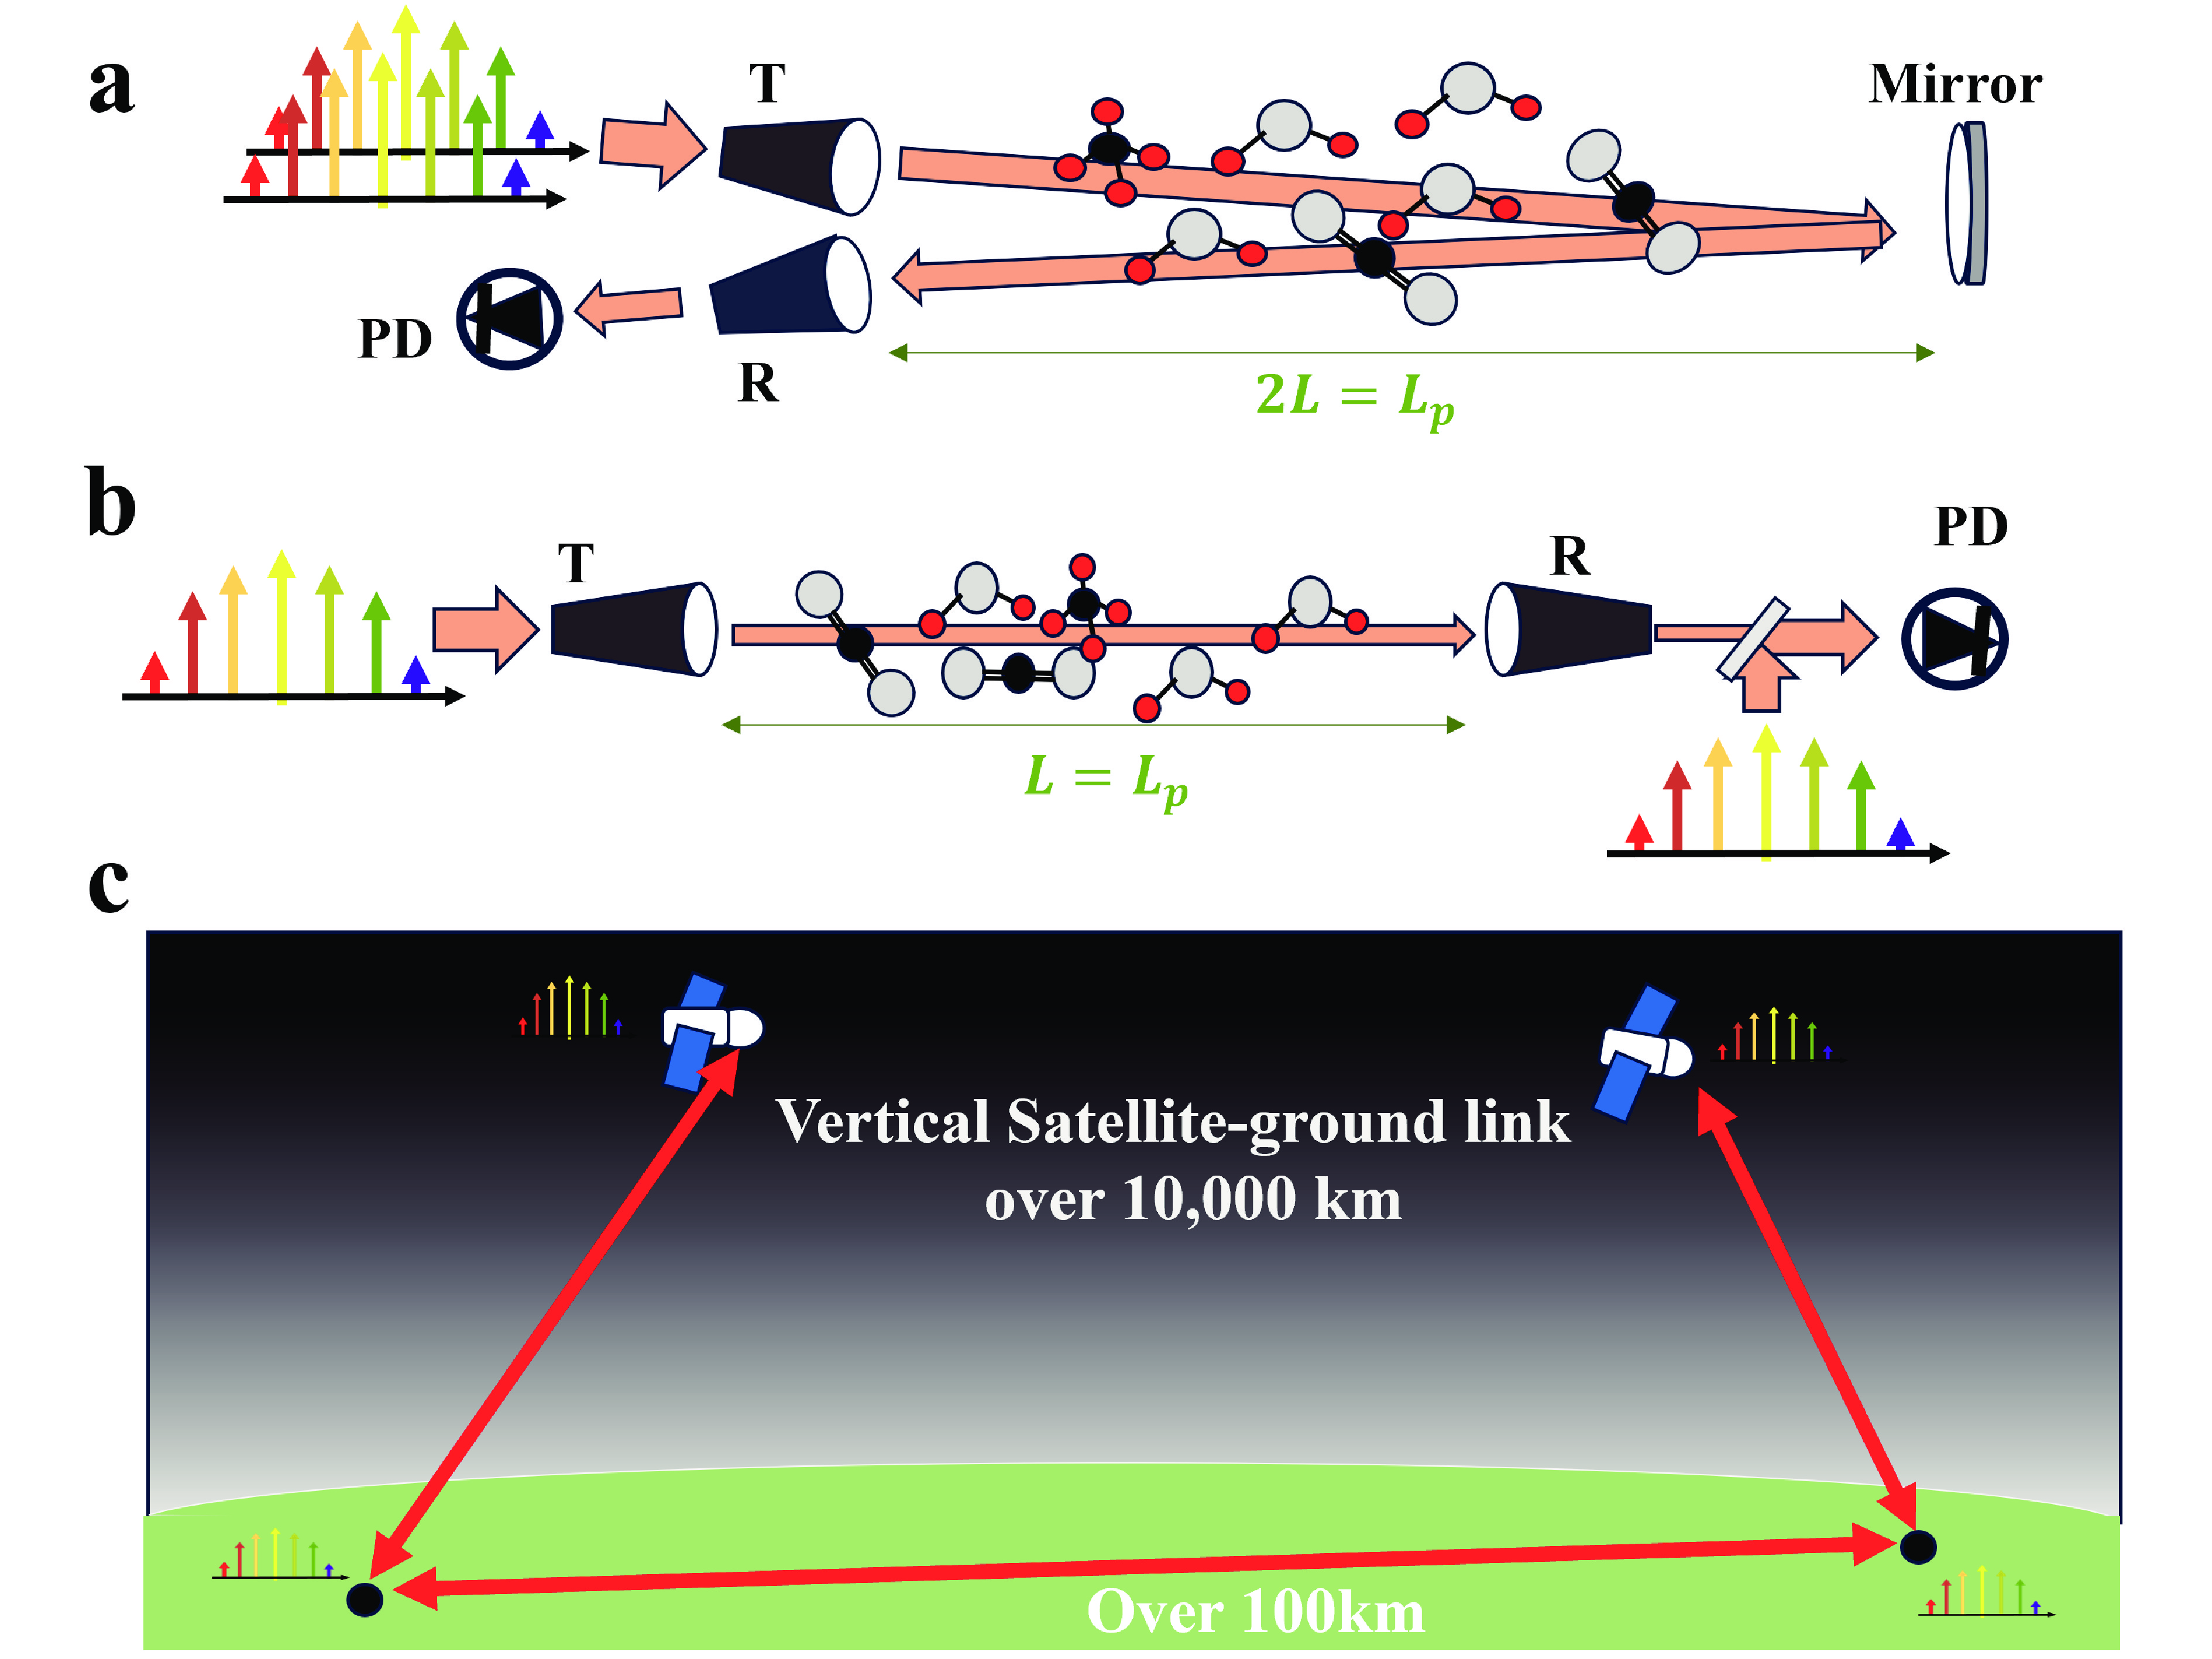
In a typical open-path DCS configuration, as shown in Fig. 1a, the detection range is generally several kilometers. The near-infrared fiber frequency comb used, which is the most mature type of comb technology available, can output milliwatt-level seed light, typically covering a broad spectrum ranging from 1520–1660 nm[25]. In this kilometer-scale range, the seed light provides sufficient transmittance power and covers the appropriate absorption bands for methane, carbon dioxide, and water vapor.
Figure
1.
(a) Schematic of a typical open-path DCS setup for kilometer-scale detection. (b) Schematic of the configuration for achieving ultra-long open-path DCS. (c) Two main application scenarios for ultra-long path DCS: horizontal open-path links over 100 km and vertical open-path links from the satellite to the ground base, which exceeds 10000 km.
In ultra-long open-path DCS, a two-way configuration is employed (Fig. 1b)[30] to reduce geometric attenuation and improve detection sensitivity. In addition to this configuration, a high-power watt-level amplifier for the frequency comb is required for the measurements. Currently, such amplifiers are limited to amplifying only a few specific regions, typically within a bandwidth of just a few nanometers[32]. Moreover, the path length L is almost two orders of magnitude greater than that in traditional setups. According to Eq. (1), the absorbance decays exponentially with L, meaning that wavelength bands suitable for typical open-path setups may lead to absorption saturation under ultra-long conditions. Therefore, it is essential to carefully select a suitable wavelength band for ultra-long open-path DCS. This band should meet the following criteria: ① it must exhibit adequate absorption of the target substance while minimizing interference from other trace gases, and ② it must be technically feasible to develop and should ensure both system stability and fieldability for practical usage.
3.
Results
In the following study, we focus on the impact of target GHG absorption over ultra-long open-path links. On the basis of the simulated transmission results, we investigate the selection of suitable wavelength bands for two application scenarios of ultra-long open-path DCS (Fig. 1c): (i) horizontal links over 100 km and (ii) vertical links from the ground to satellites over distances of at least 10000 km.
3.1
Horizontal ultra-long open path
In the near-surface atmosphere, typical carbon dioxide concentrations range from 400–500 ppm, whereas methane concentrations range from 2–4 ppm. Water vapor, however, exhibits much larger fluctuations, generally varying by several thousand ppm. Fig. 2 shows the normalized transmission spectra simulated via the HITRAN database and Eq. (1), where normalization means that only the third term in Eq. (1) is considered. Fig. 2a shows the normalized transmission spectra at a 1 km open path, with 2 ppm methane, 500 ppm carbon dioxide, and 2000 ppm water vapor at 300 K and 1 standard atmospheric pressure. The average absorbance for both CO2 and CH₄ is approximately 5% on average. Thus, for kilometer-scale open-path conditions, the seed light output of the near-infrared fiber frequency comb, which spans a relatively broad bandwidth of approximately 100 nm (shown in Fig. 2a as Range 1), is suitable for detecting methane and carbon dioxide.
Figure
2.
Simulated normalized transmission spectra for horizontal open-path links. Simulations were performed using concentrations of 2 ppm methane, 500 ppm carbon dioxide, and 2000 ppm water vapor at 300 K and 1 standard atmospheric pressure. (a) Transmission spectrum for a 1 km path length, covering the wavelength range from 6000−6600 cm−1, which corresponds to the output range of mature fiber comb seed light sources. (b) Transmission spectrum for a 100 km path length. In this case, most of the wavelength bands suitable for measuring GHGs at kilometer-scale paths become saturated. (c) Wavelength band suitable for methane measurement in ultra-long open-path DCS. (d) Wavelength band suitable for carbon dioxide measurement in ultra-long open-path DCS. See the text for further details.
Fig. 2b presents the simulated transmission spectra for a 100 km open path, with parameters identical to those in Fig. 2a. The wavelength bands that are suitable for methane and carbon dioxide detection at 1 km show significant spectral saturation due to strong long-path absorption, rendering them unsuitable for spectral extraction in this range.
In a previous horizontal ultra-long open-path DCS study[30], Watt-level high-power frequency combs with a 7 nm bandwidth centered at 1543 nm were chosen, where the CO2 absorbance does not exceed 80%. The amplification technology for high-power femtosecond pulses in this band at approximately 1543 nm is relatively mature, and this region is well suited for detecting the carbon dioxide absorption spectrum over a hundred kilometer horizontal path. However, strong water vapor absorption interference is also present in this region. To avoid interference from water vapor, an interesting wavelength band shown as Range 2 in Fig. 2b can be selected, where water vapor absorption is relatively low. Fig. 2d shows an expanded view of Range 2, between 6475 and 6500 cm−1 (approximately 1538.5 to 1544.4 nm), which is a promising choice for such measurements.
For methane measurements over a hundred-kilometer horizontal path, most of the absorption features are saturated, as shown in Fig. 2b. However, a band still exists that allows for moderate methane absorption, as indicated in Range 3 of Fig. 2b. This range, from 6120–6150 cm−1 (approximately 1626–1634 nm), is recommended. Although the high-power frequency comb amplifier for this band has not yet been fully developed, it is technically feasible and can be specifically targeted for further development.
3.2
Vertical ultra-long open path
Owing to atmospheric diffusion, the concentrations of methane and carbon dioxide, as well as the temperature and pressure, change slowly along the horizontal path near the Earth’s surface. Thus, the horizontal link measurement can represent the average concentration of gases along the path. In the vertical direction, a simple estimation suggests that the total number of atmospheric molecules is equivalent to that of a 10 km horizontal path[33]. Fig. 3a shows the transmission spectrum for a 10 km path; other parameters are the same as those used for Fig. 2. If we consider only the results in Fig. 3a, it may appear that the suitable wavelength bands for vertical satellite-to-ground atmospheric links are similar to those for kilometer-scale horizontal open-path DCS, as shown in Fig. 2a. However, since the atmosphere in the vertical direction follows a hydrostatic equilibrium, with the molecular density decreasing exponentially with height, most of the GHGs molecules along the satellite-ground base link extend over 10000 kilometers and are concentrated only within the first few tens of kilometers near the surface. Additionally, the sharp variations in concentration, temperature, and pressure along the path result in significant differences in the linewidth, line shape, and line depth of the characteristic absorption peaks between different altitude layers. This is in stark contrast to the nearly uniform conditions of horizontal open-path DCS.
Figure
3.
(a) Simulated normalized transmission spectrum for a 10 km horizontal open-path link. The simulation parameters are the same as those in Fig. 2. (b) Molecular number density profiles of three GHGs (methane, carbon dioxide, and water vapor). (c) The temperature profile over Hefei, China (117°E, 32°N), on January 5, 2015, derived from MERRA-2 specified dynamics (SD) assimilation data. See the text for further details.
Fig. 3b and 3c show the GHGs densities and temperature profiles, respectively, over Hefei, China (117°E, 32°N), on January 5, 2014. The profiles used in this study are based on output from the Specified Dynamics (SD) Whole Atmosphere Community Climate Model version 6 (WACCM6) [34], which is nudged by NASA’s Modern-Era Retrospective Analysis for Research and Applications, Version 2 (MERRA-2) product[35]. The results show that methane and carbon dioxide exhibit relatively small diurnal variations, whereas water vapor shows larger fluctuations near the surface due to phase changes and transport processes.
Considering the inhomogeneity of the atmosphere, the normalized transmission spectrum for a segmented vertical path can be expressed as:
AnormT(ν)=exp(−Σj{[Σi˜χi(ν)|T,P⋅ρi]j⋅Lj}),
(2)
where j refers to the j-th segment along the vertical path and the total path length L=ΣjLj. On the basis of Eq. (2) and profiles from the climate model, we can simulate the normalized transmission spectrum in the vertical path link.
Fig. 4a shows the transmission spectrum between 6354 and 6370 cm−1, which is a suitable wavelength range for a 10 km horizontal open-path DCS. Owing to the presence of vertical profiles, the transmission spectrum exhibits much narrower line widths and deeper absorption features than those of a homogeneous 10 km horizontal near-surface path (Fig. 4b), with the maximum absorbance exceeding 90%. Notably, this simulation only considers absorption along the vertical direction, but a relatively slanted ground-to-satellite path could lead to absorption saturation. Fig. 4c shows the transmission spectrum in the band range near 1543 nm, which is suitable for horizontal ultra-long open-path DCS, as discussed above. The transmission spectrum shows moderate absorption depths. Moreover, the interference from water vapor is significantly lower than that in the horizontal direction (Fig. 4d). Therefore, for vertical link measurements, selecting the same wavelength band as that used for ultra-long open-path DCS in the horizontal direction is a reasonable choice.
Figure
4.
Simulated normalized transmission spectra for CO2 in the vertical open-path link (blue solid line). The black dashed line represents the transmission spectrum for a 10 km horizontal open path for comparison. (a) Transmission spectrum from 6354−6370 cm−1 (approximately 1570−1574 nm), showing a strong trend of absorption saturation. (b) Enlarged view of the absorption lines from panel (a), showing narrower line widths and deeper absorption in the vertical path than the more uniformly distributed horizontal link. (c) Transmission spectrum from 6484 to 6500 cm−1 (approximately 1538 to 1542 nm), showing a reasonable absorption. (d) Enlarged view of the absorption lines from panel c. See text for further details.
Similarly, for methane detection, the simulated results show a strong saturation trend (Fig. 5a). In this case, using the band range near 1620 nm, specifically from 6080−6120 cm−1, offers a more suitable and optimal solution for methane detection (Fig. 5b). Amplifying this band range is also technically feasible. Moreover, this band allows for the simultaneous detection of carbon dioxide and water vapor. Fig. 5c shows an absorbance peak that combines the absorption of water vapor, carbon dioxide, and methane, all at similar absorption magnitudes, which can be used to extract the GHGs concentration.
Figure
5.
Simulated normalized transmission spectra for CH4 in a vertical open-path link (dark yellow solid line). The black dashed line represents the transmission spectrum for a 10 km horizontal open path for comparison. (a). Transmission spectrum from 6030−6160 cm−1 (approximately 1623−1658 nm). (b). Transmission spectrum from 6080−6120 cm−1 (approximately 1634−1644 nm), where methane, carbon dioxide, and water vapor exhibit appropriate absorption depths, making this range suitable for satellite-to-ground vertical open-path detection. (c). Enlarged view of the absorption peak in b, showing the combined absorption features of methane, carbon dioxide, and water vapor. See the text for further details.
This study addresses the selection of wavelength bands for ultra-long open-path DCS in atmospheric greenhouse gas (GHGs) measurements. Using the HITRAN database, climate model, and radiative transfer models, we simulate the transmission spectra across various wavelength bands, both for horizontal and vertical open-path links. According to the simulation results, we provide guidance for selecting wavelength bands for ultra-long open-path DCS in different future implementation scenarios.
We first discuss the horizontal open-path link, where the sensing distance is up to one hundred kilometers. This range can effectively cover the horizontal flux measurements of large and medium–sized cities, complementing satellite and point-source measurements to form a multiscale monitoring network. The simulated transmission spectra encompass the output range of the near-infrared fiber comb seed light sources. For horizontal ultra-long open-path DCS, the selected band should not only be technically feasible for high-power amplification but also exhibit appropriate absorption characteristics for the target molecules without interference from other gases. The simulation results show that for the detection of CO2, a band range near 1540 nm, spanning a few nanometers, can be amplified to achieve challenging detection. This band is relatively easy to implement with current high-power amplification technology, and the supporting fiber‒optic components are well developed. For methane detection, the band range from 1626 nm to 1634 nm can be targeted for the development of high-power, compact integrated frequency comb amplifiers. Although this technology is not yet fully mature, it is more technically feasible than longer wavelengths above 1660 nm.
For vertical open-path links between satellites and the ground, the total number of molecules encountered is roughly equivalent to that in a 10 km horizontal path. However, our simulations show that, owing to steep gradients in gas concentration, temperature, and pressure in the vertical direction, molecular collisions and thermal motion are sharply reduced with altitude. This results in much narrower linewidths and deeper absorption features in the vertical transmission spectrum than in the horizontal 10 km open path. The simulation results suggest that for satellite-to-ground vertical links, the band range near 1540 nm is suitable, which is the same as that used for horizontal ultra-long open-path DCS. In other words, current technologies are already capable of detecting CO2 in both horizontal and vertical ultra-long open-path DCS. For methane detection, high-power frequency combs between 1634 and 1639 nm are suitable. This band is technically feasible for high-power fiber-based femtosecond pulse amplifiers. If this amplifier is successfully developed, it would allow for simultaneous measurements of methane, CO2, and water vapor in the vertical open-path direction.
Notably, high-precision DCS measurements in the vertical direction can also be used to retrieve real-time profiles of atmospheric GHGs. The basic principle is similar to that of laser heterodyne spectroscopy or upward-looking Fourier transform spectrometers[36, 37]. However, unlike these passive detection methods, vertical open-path DCS is not limited to daytime measurements. Moreover, DCS offers higher resolution, negligible instrument line-shape effects, high signal‒to‒noise ratios, and faster sampling rates, all of which contribute to obtaining more accurate profiles. Therefore, it is reasonable to believe that vertical DCS could become a revolutionary tool for monitoring GHG profiles in the future.
5.
Conclusions
Through the simulations and analysis presented in this study, we demonstrate that the current development of high-power frequency combs near 1540 nm can enable ultralong open-path applications for both horizontal and vertical links. For methane detection, the band ranging from 1626 to 1634 nm is suitable for horizontal detection. The band range from 1634 to 1639 nm can be deployed for vertical detection. Notably, the development of high-power fiber amplifiers for frequency combs in this band range will facilitate simultaneous vertical open-path measurements of methane, CO2, and water vapor. An amplifier in this range will be a key technique paving the way for the development of satellite-to-ground open-path DCS.
Conflict of interest
The authors declare that they have no conflict of interest.
Conduct the wavelength bands selection studied for ultra-long open-path dual-comb spectroscopy for the first time.
Based on stimulated transmission spectral results, discuss the feasibility and suitable wavelength band for ultra-long open-path dual-comb spectroscopy in both horizontal and vertical configuration. The discussion provides a guidance for future GHGs global monitoring network development, especially for the part of high-power fiber amplifier.
According to the results, high-power frequency combs between 1634 and 1639 nm allow for simultaneous measurements of methane, CO2, and water vapor in the vertical open-path direction. The amplifier in this wavelength bandwidth will be a hotspot and key technique for development of satellite-to-ground link.
Sun Y, Yin H, Wang W, et al. Monitoring greenhouse gases (GHGs) in China: status and perspective. Atmos. Meas. Tech., 2022, 15 (16): 4819–4834. DOI: 10.5194/amt-15-4819-2022
[2]
Bellassen V, Stephan N, Afriat M, et al. Monitoring, reporting and verifying emissions in the climate economy. Nature Climate Change, 2015, 5: 319–328. DOI: 10.1038/nclimate2544
[3]
Cossel K C, Waxman E M, Finneran I A, et al. Gas-phase broadband spectroscopy using active sources: progress, status, and applications. J. Opt. Soc. Am. B, 2017, 34 (1): 104–129. DOI: 10.1364/JOSAB.34.000104
[4]
Schütze C, Lau S, Reiche N, et al. Ground-based remote sensing with open-path Fourier- transform infrared (OP-FTIR) spectroscopy for large-scale monitoring of greenhouse gases. Energy Procedia, 2013, 37: 4276–4282. DOI: 10.1016/j.egypro.2013.06.330
[5]
Sha M K, De Mazière M, Notholt J, et al. Intercomparison of low- and high-resolution infrared spectrometers for ground-based solar remote sensing measurements of total column concentrations of CO2, CH4, and CO. Atmos. Meas. Tech., 2020, 13 (9): 4791–4839. DOI: 10.5194/amt-13-4791-2020
[6]
Levin N, Kyba C C M, Zhang Q, et al. Remote sensing of night lights: A review and an outlook for the future. Remote Sensing of Environment, 2020, 237: 111443. DOI: 10.1016/j.rse.2019.111443
[7]
Schütze C, Sauer U. Challenges associated with the atmospheric monitoring of areal emission sources and the need for optical remote sensing techniques—An open-path Fourier transform infrared (OP-FTIR) spectroscopy experience report. Environ Earth Sci, 2016, 75: 919. DOI: 10.1007/s12665-016-5482-z
[8]
Fortier T, Baumann E. 20 years of developments in optical frequency comb technology and applications. Commun Phys, 2019, 2: 153. DOI: 10.1038/s42005-019-0249-y
[9]
Diddams S A, Vahala K, Udem T. Optical frequency combs: Coherently uniting the electromagnetic spectrum. Science, 2020, 369 (6501): eaay3676. DOI: 10.1126/science.aay3676
[10]
Schiller S. Spectrometry with frequency combs. Opt. Lett., 2002, 27 (9): 766–768. DOI: 10.1364/OL.27.000766
[11]
Lee S J, Widiyatmoko B, Kourogi M, et al. Ultrahigh scanning speed optical coherence tomography using optical frequency comb generators. Jpn. J. Appl. Phys., 2001, 40: L878–L880. DOI: 10.1143/JJAP.40.L878
Yasui T, Saneyoshi E, Araki T. Asynchronous optical sampling terahertz time-domain spectroscopy for ultrahigh spectral resolution and rapid data acquisition. Appl. Phys. Lett., 2005, 87: 061101. DOI: 10.1063/1.2008379
[14]
Coddington I, Newbury N, Swann W. Dual-comb spectroscopy. Optica, 2016, 3 (4): 414–426. DOI: 10.1364/OPTICA.3.000414
[15]
Abbas M A, Pan Q, Mandon J, et al. Time-resolved mid-infrared dual-comb spectroscopy. Sci Rep, 2019, 9: 17247. DOI: 10.1038/s41598-019-53825-8
[16]
Coddington I, Swann W C, Newbury N R. Coherent dual-comb spectroscopy at high signal-to-noise ratio. Phys. Rev. An., 2010, 82: 043817. DOI: 10.1103/PhysRevA.82.043817
[17]
Newbury N R, Coddington I, Swann W. Sensitivity of coherent dual-comb spectroscopy. Optics Express, 2010, 18: 7929–7945. DOI: 10.1364/OE.18.007929
[18]
Chen Z, Yan M, Hänsch T W, et al. A phase-stable dual-comb interferometer. Nat Commun, 2018, 9: 3035. DOI: 10.1038/s41467-018-05509-6
[19]
Ideguchi T, Poisson A, Guelachvili G, et al. Adaptive real-time dual-comb spectroscopy. Nat Commun, 2014, 5: 3375. DOI: 10.1038/ncomms4375
[20]
Chen X, Huang C, Li J, et al. Phase-sensitive open-path dual-comb spectroscopy with free-running combs. Phys. Rev. Appl., 2023, 19: 044016. DOI: 10.1103/PhysRevApplied.19.044016
[21]
Khan S A, Khan S B, Khan L U, et al. Fourier transform infrared spectroscopy: Fundamentals and application in functional groups and nanomaterials characterization. In: Handbook of Materials Characterization. Cham, Switzerland: Springer, 2018 : 317–344.
[22]
Rieker G B, Giorgetta F R, Swann W C, et al. Frequency-comb-based remote sensing of greenhouse gases over kilometer air paths. Optica, 2014, 1 (5): 290–298. DOI: 10.1364/OPTICA.1.000290
[23]
Giorgetta F R, Rieker G B, Baumann E, et al. Broadband phase spectroscopy over turbulent air paths. Phys. Rev. Lett., 2015, 115: 103901. DOI: 10.1103/PhysRevLett.115.103901
[24]
Waxman E M, Cossel K C, Truong G-W, et al. Intercomparison of open-path trace gas measurements with two dual-frequency-comb spectrometers. Atmos. Meas. Tech., 2017, 10: 3295–3311. DOI: 10.5194/amt-10-3295-2017
[25]
Sinclair L C, Deschênes J-D, Sonderhouse L, et al. A compact optically coherent fiber frequency comb. Rev. Sci. Instrum., 2015, 86 (8): 081301. DOI: 10.1063/1.4928163
[26]
Truong G-W, Waxman E M, Cossel K C, et al. Accurate frequency referencing for fieldable dual-comb spectroscopy. Optics Express, 2016, 24 (26): 30495–30504. DOI: 10.1364/OE.24.030495
[27]
Coburn S, Alden C B, Wright R, et al. Regional trace-gas source attribution using a field-deployed dual frequency comb spectrometer. Optica, 2018, 5 (4): 320–327. DOI: 10.1364/OPTICA.5.000320
[28]
Waxman E M, Cossel K C, Giorgetta F, et al. Estimating vehicle carbon dioxide emissions from Boulder, Colorado, using horizontal path-integrated column measurements. Atmos. Chem. Phys., 2019, 19 (7): 4177–4192. DOI: 10.5194/acp-19-4177-2019
[29]
Shen Q, Guan J Y, Zeng T, et al. Experimental simulation of time and frequency transfer via an optical satellite–ground link at 10−18 instability. Optica, 2021, 8 (4): 471–476. DOI: 10.1364/OPTICA.413114
[30]
Han J J, Zhong W, Zhao R C, et al. Dual-comb spectroscopy over a 100 km open-air path. Nat. Photon., 2024, 18: 1195–1202. DOI: 10.1038/s41566-024-01525-9
[31]
Gordon I E, Rothman L S, Hargreaves R J, et al. The HITRAN2020 molecular spectroscopic database. Journal of Quantitative Spectroscopy and Radiative Transfer, 2022, 277: 107949. DOI: 10.1016/j.jqsrt.2021.107949
[32]
Yan D, Liu B, Song H, et al. Research status and development trend of high power femtosecond fiber laser amplifiers. Chinese Journal of Lasers, 2019, 46 (5): 0508012. DOI: 10.3788/CJL201946.0508012
[33]
Schlager H, Grewe V, Roiger A. Chemical composition of the atmosphere. In: Atmospheric Physics. Berlin, Heidelberg: Springer, 2012 : 17−35.
[34]
Gettelman A, Mills M J, Kinnison D E, et al. The Whole Atmosphere Community Climate Model version 6 (WACCM6). Journal of Geophysical Research: Atmospheres, 2019, 124 (23): 12380–12403. DOI: 10.1029/2019JD030943
[35]
Molod A, Takacs L, Suarez M, et al. Development of the GEOS-5 atmospheric general circulation model: Evolution from MERRA to MERRA2. Geoscientific Model Development, 2015, 8 (5): 1339–1356. DOI: 10.5194/gmd-8-1339-2015
[36]
Shakun A, Korablev O, Moshkin B, et al. Fourier transform spectrometers for remote sensing of planetary atmospheres and surfaces. CEAS Space J, 2017, 9: 399–409. DOI: 10.1007/s12567-017-0176-2
[37]
Weidmann D. 4 - Atmospheric trace gas measurements using laser heterodyne spectroscopy. In: Advances in Spectroscopic Monitoring of the Atmosphere. Amsterdam: Elsevier, 2021 : 159−223.
Figure
1.
(a) Schematic of a typical open-path DCS setup for kilometer-scale detection. (b) Schematic of the configuration for achieving ultra-long open-path DCS. (c) Two main application scenarios for ultra-long path DCS: horizontal open-path links over 100 km and vertical open-path links from the satellite to the ground base, which exceeds 10000 km.
Figure
2.
Simulated normalized transmission spectra for horizontal open-path links. Simulations were performed using concentrations of 2 ppm methane, 500 ppm carbon dioxide, and 2000 ppm water vapor at 300 K and 1 standard atmospheric pressure. (a) Transmission spectrum for a 1 km path length, covering the wavelength range from 6000−6600 cm−1, which corresponds to the output range of mature fiber comb seed light sources. (b) Transmission spectrum for a 100 km path length. In this case, most of the wavelength bands suitable for measuring GHGs at kilometer-scale paths become saturated. (c) Wavelength band suitable for methane measurement in ultra-long open-path DCS. (d) Wavelength band suitable for carbon dioxide measurement in ultra-long open-path DCS. See the text for further details.
Figure
3.
(a) Simulated normalized transmission spectrum for a 10 km horizontal open-path link. The simulation parameters are the same as those in Fig. 2. (b) Molecular number density profiles of three GHGs (methane, carbon dioxide, and water vapor). (c) The temperature profile over Hefei, China (117°E, 32°N), on January 5, 2015, derived from MERRA-2 specified dynamics (SD) assimilation data. See the text for further details.
Figure
4.
Simulated normalized transmission spectra for CO2 in the vertical open-path link (blue solid line). The black dashed line represents the transmission spectrum for a 10 km horizontal open path for comparison. (a) Transmission spectrum from 6354−6370 cm−1 (approximately 1570−1574 nm), showing a strong trend of absorption saturation. (b) Enlarged view of the absorption lines from panel (a), showing narrower line widths and deeper absorption in the vertical path than the more uniformly distributed horizontal link. (c) Transmission spectrum from 6484 to 6500 cm−1 (approximately 1538 to 1542 nm), showing a reasonable absorption. (d) Enlarged view of the absorption lines from panel c. See text for further details.
Figure
5.
Simulated normalized transmission spectra for CH4 in a vertical open-path link (dark yellow solid line). The black dashed line represents the transmission spectrum for a 10 km horizontal open path for comparison. (a). Transmission spectrum from 6030−6160 cm−1 (approximately 1623−1658 nm). (b). Transmission spectrum from 6080−6120 cm−1 (approximately 1634−1644 nm), where methane, carbon dioxide, and water vapor exhibit appropriate absorption depths, making this range suitable for satellite-to-ground vertical open-path detection. (c). Enlarged view of the absorption peak in b, showing the combined absorption features of methane, carbon dioxide, and water vapor. See the text for further details.
References
[1]
Sun Y, Yin H, Wang W, et al. Monitoring greenhouse gases (GHGs) in China: status and perspective. Atmos. Meas. Tech., 2022, 15 (16): 4819–4834. DOI: 10.5194/amt-15-4819-2022
[2]
Bellassen V, Stephan N, Afriat M, et al. Monitoring, reporting and verifying emissions in the climate economy. Nature Climate Change, 2015, 5: 319–328. DOI: 10.1038/nclimate2544
[3]
Cossel K C, Waxman E M, Finneran I A, et al. Gas-phase broadband spectroscopy using active sources: progress, status, and applications. J. Opt. Soc. Am. B, 2017, 34 (1): 104–129. DOI: 10.1364/JOSAB.34.000104
[4]
Schütze C, Lau S, Reiche N, et al. Ground-based remote sensing with open-path Fourier- transform infrared (OP-FTIR) spectroscopy for large-scale monitoring of greenhouse gases. Energy Procedia, 2013, 37: 4276–4282. DOI: 10.1016/j.egypro.2013.06.330
[5]
Sha M K, De Mazière M, Notholt J, et al. Intercomparison of low- and high-resolution infrared spectrometers for ground-based solar remote sensing measurements of total column concentrations of CO2, CH4, and CO. Atmos. Meas. Tech., 2020, 13 (9): 4791–4839. DOI: 10.5194/amt-13-4791-2020
[6]
Levin N, Kyba C C M, Zhang Q, et al. Remote sensing of night lights: A review and an outlook for the future. Remote Sensing of Environment, 2020, 237: 111443. DOI: 10.1016/j.rse.2019.111443
[7]
Schütze C, Sauer U. Challenges associated with the atmospheric monitoring of areal emission sources and the need for optical remote sensing techniques—An open-path Fourier transform infrared (OP-FTIR) spectroscopy experience report. Environ Earth Sci, 2016, 75: 919. DOI: 10.1007/s12665-016-5482-z
[8]
Fortier T, Baumann E. 20 years of developments in optical frequency comb technology and applications. Commun Phys, 2019, 2: 153. DOI: 10.1038/s42005-019-0249-y
[9]
Diddams S A, Vahala K, Udem T. Optical frequency combs: Coherently uniting the electromagnetic spectrum. Science, 2020, 369 (6501): eaay3676. DOI: 10.1126/science.aay3676
[10]
Schiller S. Spectrometry with frequency combs. Opt. Lett., 2002, 27 (9): 766–768. DOI: 10.1364/OL.27.000766
[11]
Lee S J, Widiyatmoko B, Kourogi M, et al. Ultrahigh scanning speed optical coherence tomography using optical frequency comb generators. Jpn. J. Appl. Phys., 2001, 40: L878–L880. DOI: 10.1143/JJAP.40.L878
Yasui T, Saneyoshi E, Araki T. Asynchronous optical sampling terahertz time-domain spectroscopy for ultrahigh spectral resolution and rapid data acquisition. Appl. Phys. Lett., 2005, 87: 061101. DOI: 10.1063/1.2008379
[14]
Coddington I, Newbury N, Swann W. Dual-comb spectroscopy. Optica, 2016, 3 (4): 414–426. DOI: 10.1364/OPTICA.3.000414
[15]
Abbas M A, Pan Q, Mandon J, et al. Time-resolved mid-infrared dual-comb spectroscopy. Sci Rep, 2019, 9: 17247. DOI: 10.1038/s41598-019-53825-8
[16]
Coddington I, Swann W C, Newbury N R. Coherent dual-comb spectroscopy at high signal-to-noise ratio. Phys. Rev. An., 2010, 82: 043817. DOI: 10.1103/PhysRevA.82.043817
[17]
Newbury N R, Coddington I, Swann W. Sensitivity of coherent dual-comb spectroscopy. Optics Express, 2010, 18: 7929–7945. DOI: 10.1364/OE.18.007929
[18]
Chen Z, Yan M, Hänsch T W, et al. A phase-stable dual-comb interferometer. Nat Commun, 2018, 9: 3035. DOI: 10.1038/s41467-018-05509-6
[19]
Ideguchi T, Poisson A, Guelachvili G, et al. Adaptive real-time dual-comb spectroscopy. Nat Commun, 2014, 5: 3375. DOI: 10.1038/ncomms4375
[20]
Chen X, Huang C, Li J, et al. Phase-sensitive open-path dual-comb spectroscopy with free-running combs. Phys. Rev. Appl., 2023, 19: 044016. DOI: 10.1103/PhysRevApplied.19.044016
[21]
Khan S A, Khan S B, Khan L U, et al. Fourier transform infrared spectroscopy: Fundamentals and application in functional groups and nanomaterials characterization. In: Handbook of Materials Characterization. Cham, Switzerland: Springer, 2018 : 317–344.
[22]
Rieker G B, Giorgetta F R, Swann W C, et al. Frequency-comb-based remote sensing of greenhouse gases over kilometer air paths. Optica, 2014, 1 (5): 290–298. DOI: 10.1364/OPTICA.1.000290
[23]
Giorgetta F R, Rieker G B, Baumann E, et al. Broadband phase spectroscopy over turbulent air paths. Phys. Rev. Lett., 2015, 115: 103901. DOI: 10.1103/PhysRevLett.115.103901
[24]
Waxman E M, Cossel K C, Truong G-W, et al. Intercomparison of open-path trace gas measurements with two dual-frequency-comb spectrometers. Atmos. Meas. Tech., 2017, 10: 3295–3311. DOI: 10.5194/amt-10-3295-2017
[25]
Sinclair L C, Deschênes J-D, Sonderhouse L, et al. A compact optically coherent fiber frequency comb. Rev. Sci. Instrum., 2015, 86 (8): 081301. DOI: 10.1063/1.4928163
[26]
Truong G-W, Waxman E M, Cossel K C, et al. Accurate frequency referencing for fieldable dual-comb spectroscopy. Optics Express, 2016, 24 (26): 30495–30504. DOI: 10.1364/OE.24.030495
[27]
Coburn S, Alden C B, Wright R, et al. Regional trace-gas source attribution using a field-deployed dual frequency comb spectrometer. Optica, 2018, 5 (4): 320–327. DOI: 10.1364/OPTICA.5.000320
[28]
Waxman E M, Cossel K C, Giorgetta F, et al. Estimating vehicle carbon dioxide emissions from Boulder, Colorado, using horizontal path-integrated column measurements. Atmos. Chem. Phys., 2019, 19 (7): 4177–4192. DOI: 10.5194/acp-19-4177-2019
[29]
Shen Q, Guan J Y, Zeng T, et al. Experimental simulation of time and frequency transfer via an optical satellite–ground link at 10−18 instability. Optica, 2021, 8 (4): 471–476. DOI: 10.1364/OPTICA.413114
[30]
Han J J, Zhong W, Zhao R C, et al. Dual-comb spectroscopy over a 100 km open-air path. Nat. Photon., 2024, 18: 1195–1202. DOI: 10.1038/s41566-024-01525-9
[31]
Gordon I E, Rothman L S, Hargreaves R J, et al. The HITRAN2020 molecular spectroscopic database. Journal of Quantitative Spectroscopy and Radiative Transfer, 2022, 277: 107949. DOI: 10.1016/j.jqsrt.2021.107949
[32]
Yan D, Liu B, Song H, et al. Research status and development trend of high power femtosecond fiber laser amplifiers. Chinese Journal of Lasers, 2019, 46 (5): 0508012. DOI: 10.3788/CJL201946.0508012
[33]
Schlager H, Grewe V, Roiger A. Chemical composition of the atmosphere. In: Atmospheric Physics. Berlin, Heidelberg: Springer, 2012 : 17−35.
[34]
Gettelman A, Mills M J, Kinnison D E, et al. The Whole Atmosphere Community Climate Model version 6 (WACCM6). Journal of Geophysical Research: Atmospheres, 2019, 124 (23): 12380–12403. DOI: 10.1029/2019JD030943
[35]
Molod A, Takacs L, Suarez M, et al. Development of the GEOS-5 atmospheric general circulation model: Evolution from MERRA to MERRA2. Geoscientific Model Development, 2015, 8 (5): 1339–1356. DOI: 10.5194/gmd-8-1339-2015
[36]
Shakun A, Korablev O, Moshkin B, et al. Fourier transform spectrometers for remote sensing of planetary atmospheres and surfaces. CEAS Space J, 2017, 9: 399–409. DOI: 10.1007/s12567-017-0176-2
[37]
Weidmann D. 4 - Atmospheric trace gas measurements using laser heterodyne spectroscopy. In: Advances in Spectroscopic Monitoring of the Atmosphere. Amsterdam: Elsevier, 2021 : 159−223.


 DownLoad:


