Hao Liang is a graduate student at the School of Management, University of Science and Technology of China. His research mainly focuses on Bayesian adaptive design in early-phase clinical trials
Min Yuan is a Professor at the School of Health Management, Anhui Medical University. She received her Ph.D. degree from the University of Science and Technology of China in 2009. Her research mainly focuses on genome-wide association studies for Alzheimer’s disease, longitudinal data analysis, and statistical models and applications in public health and biomedicine
Finding the optimal dose combination in two-agent dose-finding trials is challenging due to limited sample sizes and the extensive range of potential doses. Unlike traditional chemotherapy or radiotherapy, which primarily focuses on identifying the maximum tolerated dose (MTD), therapies involving targeted and immune agents facilitate the identification of an optimal biological dose combination (OBDC) by simultaneously evaluating both toxicity and efficacy. Currently, most approaches to determining the OBDC in the literature are model-based and require complex model fittings, making them cumbersome and challenging to implement. To address these challenges, we developed a novel model-assisted approach called uTPI-Comb. This approach refines the established utility-based toxicity probability interval design by integrating a strategically devised zone-based local and global candidate set searching strategy, which can effectively optimize the decision-making process for two-agent dose escalation or de-escalation in drug combination trials. Extensive simulation studies demonstrate that the uTPI-Comb design speeds up the dose-searching process and provides substantial improvements over existing model-based methods in determining the optimal biological dose combinations.
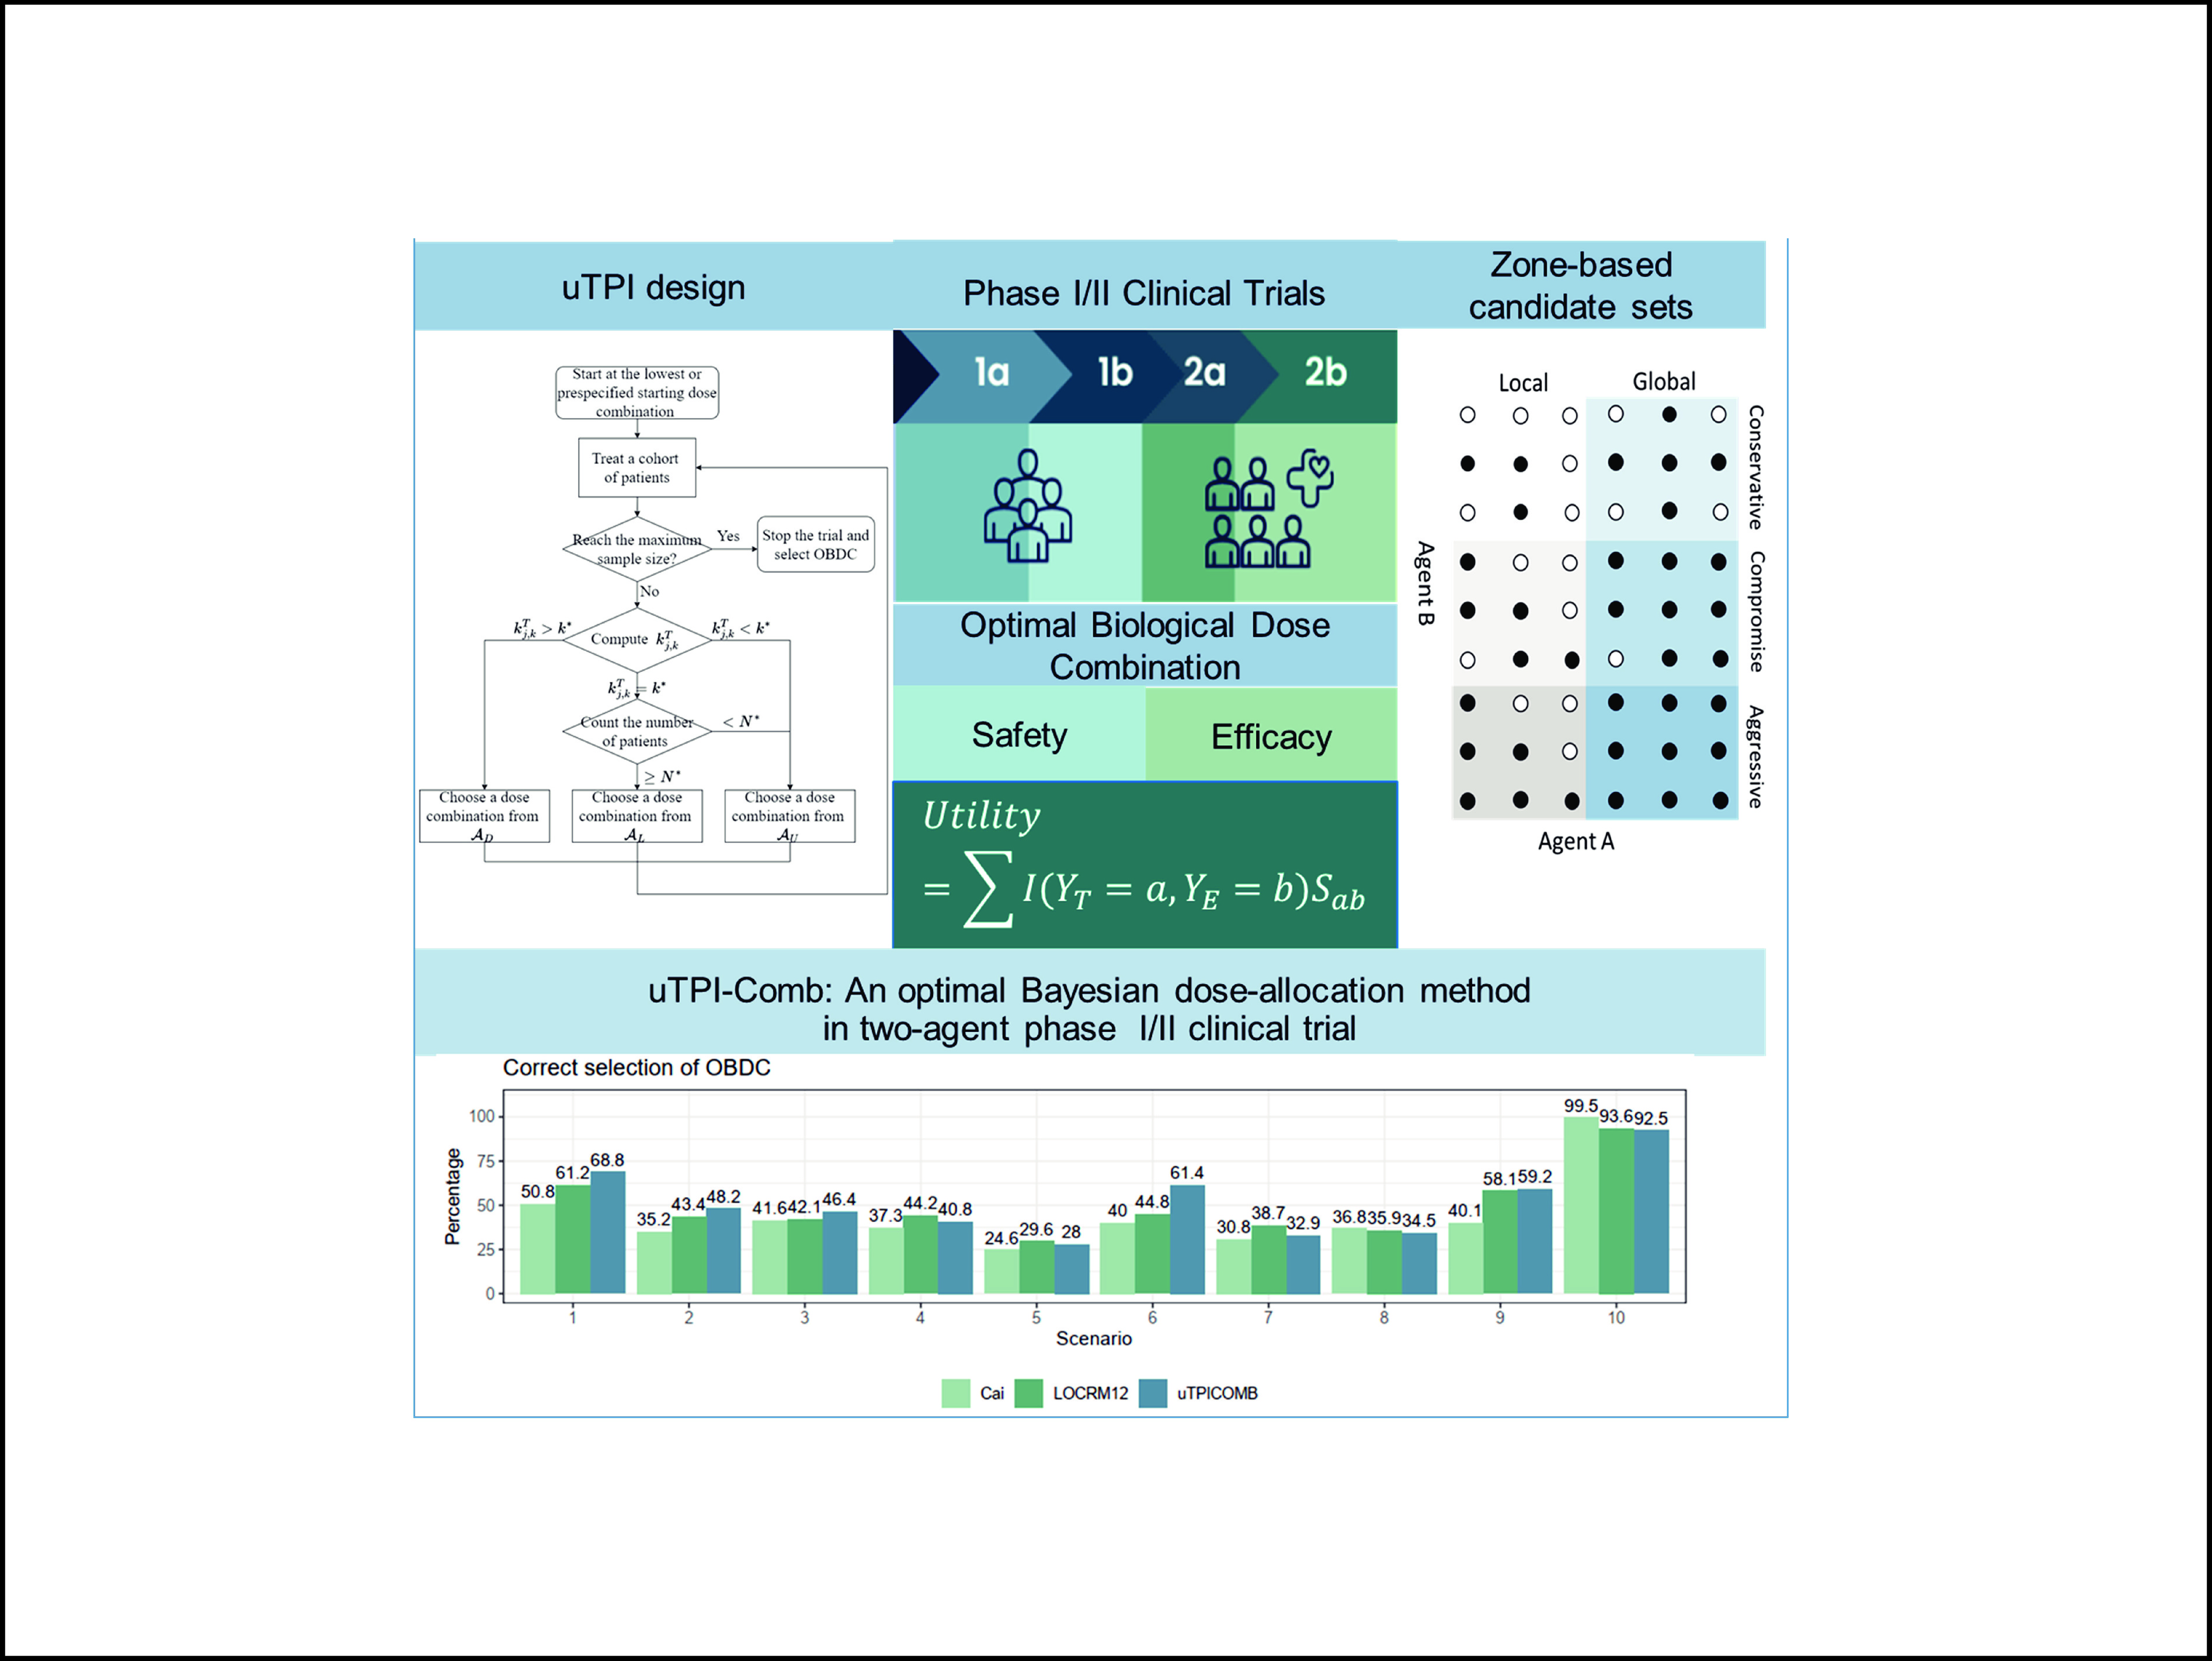
Graphical Abstract
A new dose allocation method called uTPI-Comb.
Abstract
Finding the optimal dose combination in two-agent dose-finding trials is challenging due to limited sample sizes and the extensive range of potential doses. Unlike traditional chemotherapy or radiotherapy, which primarily focuses on identifying the maximum tolerated dose (MTD), therapies involving targeted and immune agents facilitate the identification of an optimal biological dose combination (OBDC) by simultaneously evaluating both toxicity and efficacy. Currently, most approaches to determining the OBDC in the literature are model-based and require complex model fittings, making them cumbersome and challenging to implement. To address these challenges, we developed a novel model-assisted approach called uTPI-Comb. This approach refines the established utility-based toxicity probability interval design by integrating a strategically devised zone-based local and global candidate set searching strategy, which can effectively optimize the decision-making process for two-agent dose escalation or de-escalation in drug combination trials. Extensive simulation studies demonstrate that the uTPI-Comb design speeds up the dose-searching process and provides substantial improvements over existing model-based methods in determining the optimal biological dose combinations.
Public Summary
A novel model-assisted dose allocation method named uTPI-Comb was introduced, which incorporates a zone-based candidate set searching strategy to improve decision-making in dose escalation or de-escalation in combination therapies.
Comprehensive simulation studies show that the uTPI-Comb design speeds up the dose-finding process and greatly improves the identification of optimal biological dose combinations compared to conventional model-based approaches.
Combination therapy is a promising strategy in precision oncology, in which identifying an optimal dose combination is crucial during the late stages of development[1]. Unlike traditional chemotherapy, where the “more-is-better” approach might be effective, this strategy is not suitable for targeted therapy or immunotherapy. The primary goal of these newer therapeutic modalities is to determine the optimal biological dose combination (OBDC)—the dose that maximizes effectiveness while ensuring safety for the patient. However, while toxicity often increases with dosage, efficacy might plateau or even decrease at higher doses[2]. Therefore, traditional dose-finding methods[3–5] that focus on identifying the maximum tolerated dose are inadequate for these treatments.
Determining an OBDC that balances the risk‒benefit trade-off in a multi-dimensional dose space is highly complex, especially when both toxicity and efficacy are assessed simultaneously. The challenge is compounded by the absence of flexible and robust modeling frameworks capable of managing potential plateauing dose–efficacy relationships. Additionally, effectively allocating patients within the dose exploration space may add additional complexity. Although trial designs for single-agent dose finding and optimization are abundant[6–15], there is currently limited research on dose optimization methods in dose-combination trials. Several model-based OBDC designs have been developed, such as the TriCRM by Mandrekar et al.[16], the copula-type model by Yuan and Yin[17], the change point model by Cai et al.[18], linear logistic regression models by Wang et al.[19], and the LOCRM by Zhang et al[20]. However, these model-based approaches often involve complex model fitting and present significant implementation challenges.
The utility-based toxicity probability interval (uTPI) design[14] is a sophisticated method developed for dose-finding in single-agent trials, primarily aimed at identifying the optimal biological dose (OBD) that balances efficacy and toxicity. At its core, the uTPI design uses a statistical framework that assigns utility values to different dose levels on the basis of prespecified criteria of toxicity and efficacy. These utility values are then used to guide dose escalation or de-escalation decisions throughout the trial. The design is particularly useful in scenarios where simply finding the maximum tolerated dose (MTD) is insufficient because the efficacy of the treatment also needs to be taken into account. This approach integrates utility metrics into the decision-making process, which allows for a more nuanced assessment of the trade-offs between the therapeutic benefits of a drug and its adverse effects.
The zone-based candidate set searching strategy is a methodological innovation in the field of dose-finding studies[18, 21–23]. The conventional zone-based design translates two-dimensional doses into one-dimensional zones, where it is assumed that toxicity increases monotonically between zones and remains consistent within a zone. Typically, when focusing solely on toxicity, it is logical to select doses from a specific zone. However, when both toxicity and efficacy are considered, especially if the toxicity is moderate or low, relying on a single zone may be inadequate because of the limited dose space. Expanding the dose space offers several benefits, including enhanced efficiency and the avoidance of local optima, but it also introduces a greater potential for increased toxicity. To mitigate this, toxicity control measures are employed to ensure that only doses with acceptable toxicity levels are included in the candidate set.
In this work, we introduce three types of zone-based local candidate sets, representing three distinct strategies (conservative, compromise, and aggressive), and propose a flexible nonparametric two-agent dose-optimization design that extends the single-agent uTPI design to two-agent trials. This approach includes both local and global optimization strategies to address the complexities of dose optimization in multiagent settings. Specifically, the candidate dose set comprises the current dose zone as well as the immediately lower and higher dose zones. The choice of optimization method, whether local or global, is made early in the process and then consistently applied across the entire candidate set. Additionally, we implement a utility-based posterior probability decision criterion within the keyboard-Comb design[24] and uTPI design frameworks, which are tailored to the three proposed zone-based local candidate sets. The keyboard-Comb design provides a model-assisted design for finding maximum tolerated dose combinations (MTDCs) for drug-combination trials. This design uses the same dose escalation/de-escalation rule as the keyboard single-agent design[9]. More details of the keyboard-Comb design and uTPI design are discussed in Section 2.4. This method enhances the robustness of our design while retaining the simplicity characteristic of model-assisted designs. By doing so, we effectively reduce the complexity of multiagent dose optimization, providing practical and implementable solutions for clinical trial settings. This strategy ensures a thorough and adaptable approach to finding the optimal dose combinations that account for both efficacy and safety in a streamlined and efficient manner.
The rest of the article is organized as follows. Section 2 outlines the notations and decision-making strategies, describes three types of zone-based local candidate sets, and details the adaptation of the single-agent uTPI design[14] to the two-agent setting. Sections 3 and 4 evaluate the performance of uTPI-Comb through comprehensive simulation studies. A brief discussion is provided in Section 5.
2.
Method
2.1
Notations
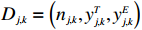
We assume that an early-phase drug-combination trial is being conducted to determine OBDC for a combination therapy with J dose levels of drug A and K levels of drug B. Consider the dose combination regimen AjBk of drugs Aj and Bk. For simplicity, the dose regimen AjBk is denoted as the dose level (j,k) in the following context, where j=1,⋯,J and k=1,⋯,K. Let πTj,k represent the marginal dose limiting toxicity (DLT) probability, and πEj,k represent the corresponding marginal efficacy probability of the dose regimen (j,k). Let nj,k denote the number of patients in the dose combination regimen (j,k), yTj,k and yEj,k denote the number of patients experiencing toxicity and efficacy, respectively. The observed DLT rate is calculated as ^πTj,k=yTj,k/nj,k. The observed data is denoted as
D={Dj,k,j=1,⋯,J,k=1,⋯,K},
where Dj,k=(nj,k,yTj,k,yEj,k) represents the local data obtained under the dose regimen (j,k). The upper bound of toxicity probability and the lower bound of efficacy probability given by the clinical physician are denoted as ϕT and ϕE, respectively. Here, ϕE can take the target efficacy value specified in a standard phase II trial, whereas ϕT should be slightly higher than the target toxicity probability of the MTDC-finding trial to expand the dose exploration space.
2.2
Decision-making strategy
The dose allocation decision-making process of model-assisted designs usually consists of three parts: decision conditions, decision candidate set ˜Acondition, and decision desirability indicators Icondition. Specifically, when the decision conditions are triggered, the dose level of the next cohort is determined from the decision candidate set on the basis of the decision desirability indicators. When the decision candidate set contains only one dose, it is only necessary to determine if it is admissible. If admissible, that dose is selected; otherwise, the process should be stopped early according to the rules. In drug combination trials, when considering both toxicity and efficacy simultaneously, the decision conditions include high toxicity probability, moderate toxicity probability, and a sufficient number of subjects at the current dose.
In practical clinical trials, dose decisions typically encompass three distinct conditions. The first condition arises when the toxicity is excessively high, prompting the immediate need to lower the dose to a safe toxicity range. In such cases, the primary focus is on reducing toxicity, disregarding efficacy, and applying the keyboard-Comb process[24]. Specifically, in the first condition, the decision condition is high toxicity, the decision candidate set is
~AD={(j−1,k),(j,k−1)},
and the decision desirability indicator ID is the toxicity posterior probability (more details can be found in Section 2.4). The second condition occurs when toxicity is moderate, and there is a robust dataset from a sufficient number of subjects at the current dose. This provides confidence that increasing the dose may unnecessarily increase the risk of toxicity. Consequently, dose optimization is carried out on the basis of utility, specifically within local zones characterized by moderate to low toxicity. This method ensures a balanced approach to adjusting doses, taking into account both safety and therapeutic potential. The third condition arises when the current dose results in low toxicity or when there is moderate toxicity but insufficient data due to the small number of subjects, preventing a reliable assessment of the risks associated with dose escalation. In such cases, a global optimization approach is employed, considering high-, moderate-, and low-dose zones to achieve an optimal balance between safety and efficacy[14]. In Conditions 2 and 3, the definitions of decision candidate sets ~AP and ~AC will be discussed in Section 2.3. The decision desirability indicators IP and IC are the utility posterior probabilities. Details on incorporating the aforementioned decision-making strategy into the current study are provided in Section 2.4.
2.3
Zone-based local candidate sets
Inspired by zone-based designs[18, 21–23], three distinct zone-based local or global candidate sets ~A(i)P or ~A(i)C (i=1,2,3) were proposed. Suppose the current dose is (j,k), its adjacent dose set is
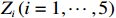
which consists of all possible dose combinations adjacent to (j,k). As illustrated in Fig. 1a, we categorize it into 5 distinct zones Zi(i=1,⋯,5) aligned along the diagonal direction.
Figure
1.
(a) Illustration of zones in the partial order of the dose–toxicity relationship in drug combination trials; (b) zone-based local and global candidate dose decision sets.
We define the natural and moderately conservative candidate sets by selecting combinations from three candidate dose sets (Z2,{(j,k)} and Z4), following the idea of keyboard-Comb design. Specifically,
This setup allows each dose in the candidate dose set to be compared with the current dose (j,k), while excluding doses (j−1,k−1)∈Z1 and (j+1,k+1)∈Z5 because of their significantly different toxicity probabilities. However, as indicated in Fig. 1a, the selection of these candidate sets ~A(1)P and ~A(1)C omits the doses (j+1,k−1) and (j−1,k+1) from Z3. While these doses are not directly comparable in magnitude to dose (j,k), their toxicity probability ranges can still be indirectly assessed.
This expansion reflects a compromise by considering doses that were previously excluded owing to their position in Z3.
If more aggressive treatment strategies are deemed necessary—such as allowing for greater tolerable doses or when there is sufficient prior knowledge regarding the toxicity probabilities of specific dose combinations—the exploration space for dosages can be further expanded. Consequently, a new set of decision candidates can be established as
The exploration strategy, which is based on the aggressiveness of the treatment, is categorized into three types of the aforementioned zone-based local candidate sets. This categorization facilitates the implementation of appropriate strategies to achieve a reasonable dosage across various scenarios. We illustrate the three types of zone-based candidate sets via a panel grid, as shown in Fig. 1b. This illustration clearly demonstrates a progressive increase in the number of candidate sets. Initially, the conservative local and global candidate sets contain 3 and 5 dose combinations, respectively. These numbers increase to 5 and 7 in the more balanced local and global candidate sets, respectively. The third type, the most expansive candidate set, includes 6 and 9 dose combinations for local and global settings, respectively. While larger candidate sets provide a more extensive range for dose exploration, they also increase the risk of exposing patients to regimens with potentially higher toxicity probability.
2.4
The proposed uTPI-Comb design
Shi et al.[14] proposed a utility-based toxicity probability interval design (uTPI design) for a single-agent trial. Similar to the keyboard design[9], the uTPI design first divides the toxicity probability interval (0,1) into MT equally spaced intervals KT1,⋯,KTMT (referred to as “toxicity keys”) that correspond to all potential locations of the true toxicity rate of a particular dose. Similarly, the utility interval (0,1) is divided into MU equally spaced intervals KU1,⋯,KUMU(referred to as “utility keys”). The uTPI design then uses the toxicity key with the highest posterior probability (referred to as “the strongest toxicity key” KTmT) and the utility key with the highest posterior probability (referred to as “the strongest utility key” KUmU) to guide dose escalation and de-escalation.
We use utility to quantify the risk-benefit trade-off based on possible outcomes that a patient may have. Given the binary variables yT and yE, there are four possible outcomes for any patient in the trial: (yT, yE) = (0, 1) (no toxicity, efficacy); (0, 0) (no toxicity, no efficacy); (1, 1) (toxicity, efficacy); and (1, 0) (toxicity, no efficacy). Let (p01,p00,p11,p10) and (s01,s00,s11,s10) denote the probabilities and scores of observing the four possible values of (yT,yE) at a certain dose (j,k), respectively, where s10=0≤s00,s11≤1=s01. The joint outcome (no toxicity, efficacy) is the most desirable, whereas (toxicity, no efficacy) is the least desirable, and the other two are in between. We quantify the desirability of each outcome by assigning it a utility (score), which should be elicited from physicians to reflect the risk-benefit trade-off underlying their medical decisions. Then, the utility of the patient can be defined as U=∑1a=0∑1b=01{YT=a,YE=b}sab. By taking the expected value of the patient’s utility, we obtain EU=p01+p11s11+p00s00. The quasi-likelihood for EU is constructed as
Assuming that the prior of EU follows a conjugate prior Beta distribution EU∼Beta(αU,βU), then its posterior distribution remains a Beta distribution:
EU∣D∼Beta(αU+n∑i=1ui,βU+n−n∑i=1ui).
The uTPI design faces challenges when considering dose combinations, as it cannot directly implement dose escalation or de-escalation owing to eight adjacent doses and the lack of effective and reasonable selection mechanisms. We propose the aforementioned zone-based local candidate sets categorized into three levels on the basis of the degree of aggressiveness, which divides the dosing strategies into dose de-escalation, local dose optimization, and global dose optimization, utilizing the posterior probabilities of utility for selection.
Given the decision candidate sets ~AP and ~Ac in the drug combination trials, the uTPI design can be extended to the uTPI-Comb design via the following steps.
Step 1. Patients in the first cohort are treated with the lowest dose combination (1,1) or a prespecified dose combination.
Step 2. Given the current dose combination (j,k), temporary data D, the rank of the toxicity probability target key m∗and the admissible dose combintion set A(D)(more details of the definition of A(D) can be found in Section 6.2), calculate the rank of the toxicity strongest key,
mT,(j,k)=argmaxm=1,⋯,MTPr(πTj,k∈KTm∣Dj,k).
The rank of the utility strongest key mU,(j′,k′) of dose regimen (j′,k′) is calculate as
mU,(j′,k′)=argmaxm=1,⋯,MUPr(EUj′,k′∈KUm∣Dj′,k′).
Denote ¯KUmU,(j′,k′) the upper bound of the strongest key.
Step 3. To assign a dose combination to the next cohort of patients according to the following rules.
•If mT,(j,k)>m∗, then select the next dose scheme in the candidate set ~AD as
If the current dose combination is (1,1), then we retain this dose for treating the next cohort of patients.
•If mT,(j,k)=m∗, and nj,k≥N∗, say N∗=6, then select
(jP,kP)=argmax(j′,k′)∈˜AP∩A(D){mU,(j′,k′)}.
as the next dose scheme in the candidate set ~AP.
•If mT,(j,k)=m∗ and nj,k<N∗, or mT,(j,k)<m∗, then select
(jC,kC)=argmax(j′,k′)∈˜AC∩A(D){mU,(j′,k′)}.
as the next dose scheme in the candidate set ~AC.
In Step 3, if multiple dose levels remain after screening, then (j∗,k∗) will be selected as the next cohort dose level. For example, its definition in the second scenario of Step 3 is calculated as follows:
Step 4. Repeat Step 3 until the maximum sample size is reached.
The uTPI-Comb design uses the single-stage approach, which uses toxicity and efficacy jointly throughout the trial to determine dose escalation/de-escalation. This differs from the conventional two-stage approach[11], which first performs toxicity-based dose escalation and then switches to dose optimization jointly based on toxicity and efficacy.
3.
Simulation studies
3.1
Simulation settings
We assess the impact of decision candidate sets on the performance of the uTPI-Comb design through comprehensive simulations. We evaluate the performance of the uTPI-Comb design by examining conservative, compromise, and aggressive decision candidate sets as detailed in section 2.3. This performance is compared against two competitive OBDC-finding designs: the LOCRM12 design[20] and the Cai design[18]. These comparisons are intended to highlight the strengths and potential limitations of each design in various scenarios, providing a detailed analysis of their efficacy in optimizing dose decisions in clinical trials.
To ensure comparability with the designs mentioned above, the parameters used in this section are configured the same as those in Zhang et al[20]. Specifically, we set ϕT=0.35,cT=0.85,ϕE=0.2, cE=0.9. The sample size is N=51, cohort size is 3, and a total of ns=1000 simulations are conducted. The prior distribution of parameter ai is N(0,2). The prior distribution of Robit model parameters is as follows:
where μα=μγ=0,μβ=0.8,σ2α=σ2β=σ2γ=1.3,adf=2,bdf=10. The original dosage of drug A is (0.08,0.16,0.24,0.32,0.40), while the original dosage of drug B is (0.08,0.16,0.24). The standardized dosage of drug A is (−1.26,−0.63,0,0.63,1.26), and the standardized dosage of drug B is (−1,0,1).
The uTPI-Comb design employs the same parameters as the LOCRM12 design, including ϕT,ϕE,cT,cE, sample size, cohort size, and simulation times. The prior hyperparameters for toxicity, efficacy, and utility are set to
αT=βT=αE=βE=αU=βU=1.
For comparability with the LOCRM12 design, the utility scores are set to (s01,s11,s00,s10)=(100,100,0,0), under which the utility-based OBDC aligns with the efficacy-based OBDC. Parameters N∗=6.
Table 1 presents 10 representative scenarios of dose combinations for drugs A and B, with drug A having 5 dose levels and drug B having 3 dose levels. Each scenario includes matrices that detail the real toxicity and efficacy probabilities associated with each dose combination. The optimal biological dose combination (OBDC) is identified as the dose combination offering the highest efficacy probability among those deemed safe; this is emphasized in the table by being bolded and underlined. The target dose combination (TDC) is defined as the dose combination where the efficacy probability is not less than 45% among the safe doses, highlighted in bold.
Table
1.
True toxicity and efficacy probabilities of Scenarios 1 to 10.
Drug A
1
2
3
4
5
1
2
3
4
5
Drug B
Toxicity probability
Efficacy probability
Scenario 1
1
0.05
0.15
0.30
0.45
0.55
0.05
0.25
0.50
0.55
0.60
2
0.15
0.35
0.45
0.55
0.65
0.25
0.50
0.55
0.60
0.65
3
0.35
0.45
0.55
0.65
0.75
0.50
0.55
0.60
0.65
0.70
Scenario 2
1
0.10
0.15
0.21
0.30
0.42
0.10
0.18
0.35
0.50
0.52
2
0.15
0.24
0.30
0.42
0.44
0.15
0.35
0.50
0.52
0.53
3
0.20
0.30
0.42
0.44
0.51
0.20
0.50
0.52
0.54
0.56
Scenario 3
1
0.05
0.10
0.18
0.25
0.42
0.30
0.45
0.60
0.45
0.26
2
0.10
0.15
0.23
0.42
0.43
0.20
0.28
0.45
0.26
0.18
3
0.15
0.23
0.45
0.50
0.55
0.10
0.14
0.24
0.18
0.10
Scenario 4
1
0.02
0.04
0.07
0.12
0.18
0.10
0.30
0.45
0.30
0.08
2
0.04
0.07
0.13
0.18
0.25
0.25
0.45
0.60
0.45
0.23
3
0.14
0.25
0.25
0.25
0.25
0.20
0.30
0.45
0.30
0.16
Scenario 5
1
0.15
0.21
0.30
0.42
0.44
0.20
0.45
0.33
0.15
0.05
2
0.24
0.3
0.42
0.44
0.51
0.35
0.60
0.45
0.20
0.15
3
0.30
0.33
0.44
0.51
0.55
0.20
0.45
0.30
0.15
0.10
Scenario 6
1
0.05
0.09
0.17
0.24
0.30
0.20
0.29
0.55
0.20
0.15
2
0.15
0.19
0.23
0.35
0.42
0.30
0.39
0.55
0.25
0.20
3
0.34
0.38
0.43
0.51
0.66
0.36
0.35
0.30
0.23
0.20
Scenario 7
1
0.05
0.09
0.14
0.23
0.30
0.10
0.18
0.25
0.30
0.31
2
0.11
0.15
0.17
0.24
0.42
0.20
0.28
0.35
0.50
0.52
3
0.14
0.18
0.23
0.41
0.46
0.23
0.30
0.50
0.52
0.53
Scenario 8
1
0.10
0.15
0.30
0.35
0.45
0.10
0.20
0.30
0.50
0.55
2
0.15
0.20
0.35
0.45
0.50
0.15
0.25
0.50
0.55
0.60
3
0.20
0.30
0.35
0.51
0.60
0.20
0.30
0.50
0.60
0.70
Scenario 9
1
0.15
0.21
0.30
0.42
0.44
0.21
0.15
0.12
0.09
0.05
2
0.24
0.30
0.42
0.44
0.51
0.60
0.45
0.33
0.24
0.21
3
0.30
0.33
0.44
0.51
0.55
0.45
0.31
0.24
0.21
0.17
Scenario 10
1
0.50
0.56
0.65
0.68
0.72
0.52
0.62
0.70
0.76
0.79
2
0.55
0.62
0.70
0.72
0.80
0.55
0.66
0.74
0.79
0.82
3
0.60
0.67
0.75
0.79
0.85
0.58
0.70
0.78
0.82
0.85
OBDC(s): optimal biological dose combination(s); TDC(s): target dose combination(s). OBDC(s) are in boldface and underline. TDC(s) are in boldface.
Notably, in scenarios 1, 2, and 6–8, the TDC coincides with the OBDC, indicating that the most effective doses are also the safest. However, in scenarios 3–5 and 9, there are more TDC dose combinations than OBDC dose combinations, suggesting a broader range of potentially effective and safe options. In scenario 10, there is no TDC, highlighting a unique situation where the definition of OBDC differs from the other scenarios, underscoring the complexity and variability in determining optimal dose combinations across different clinical contexts.
The evaluation of the proposed method leverages six metrics outlined by Zhang et al.[20] to assess its effectiveness and safety in clinical trial settings. These metrics are as follows: (a) Selection percentage of true OBDC(s): This metric measures the frequency with which the true optimal biological dose combinations (OBDCs) are accurately identified via the method. (b) Number of patients treated at OBDC(s): This indicator quantifies the actual number of patients who receive treatment at the identified OBDCs, providing insight into the practical application of the dosage regimen. (c) Selection percentage of target dose combinations (TDCs): This metric assesses how often the proposed method selects dose combinations that meet a predefined efficacy threshold (TDCs), ensuring that treatments are effective. (d) Number of patients treated at TDC(s): Similar to (b), this metric counts the number of patients treated at doses considered to be TDCs, emphasizing the clinical relevance of the dose selection. (e) Selection percentage of overly toxic dose(s): This measures the frequency with which the method selects dose combinations that exceed acceptable toxicity levels, highlighting potential safety issues. (f) Number of patients treated at overly toxic dose(s): This counts how many patients are treated with doses that are considered overly toxic, directly reflecting the safety profile of the treatment regimen.
For metrics (a) through (d), higher values are preferable, as they indicate a greater ability to correctly identify and utilize effective and optimal dose combinations. Conversely, for metrics (e) and (f), lower values are desirable, as they indicate a lower propensity for selecting overly toxic doses, thereby enhancing the overall safety of the dose optimization process. These indicators collectively provide a comprehensive framework for evaluating both the efficacy and safety of the proposed dosing method in comparison to competitive designs.
4.
Results
4.1
Operating characteristics
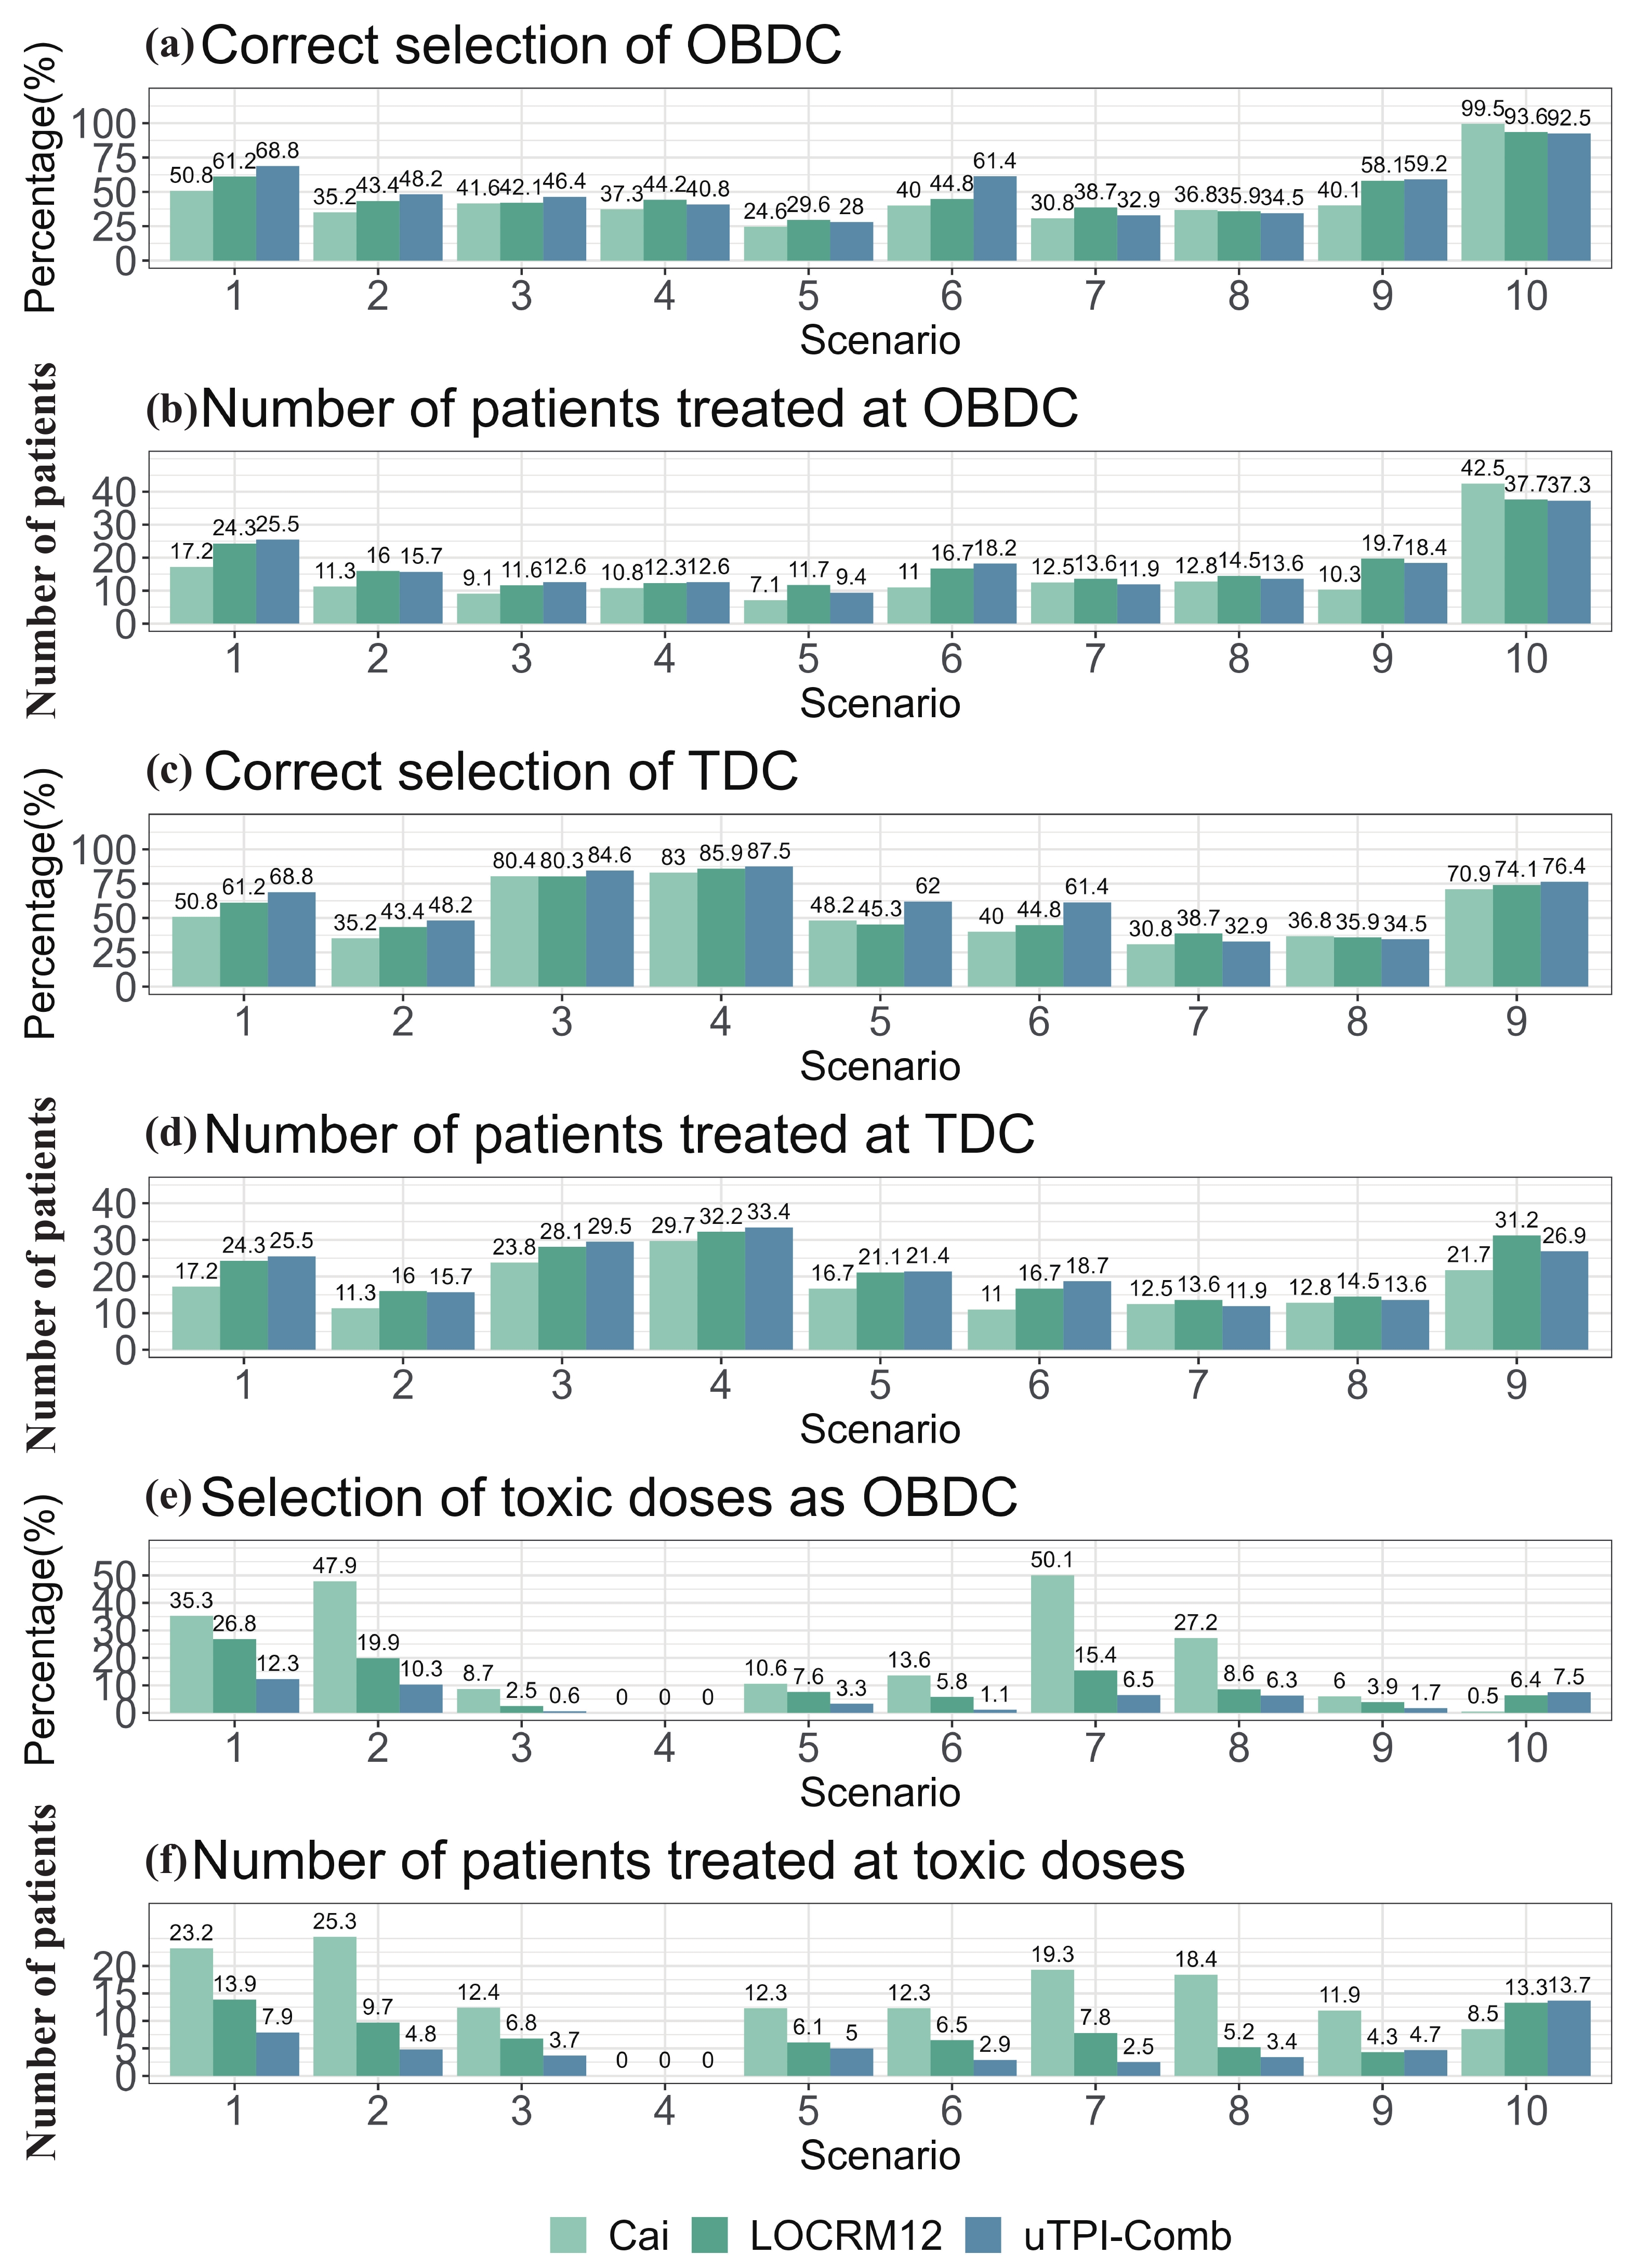
Fig. 2 shows the operational characteristics of the uTPI-Comb design and two model-based designs (LOCRM12 design and Cai design). The uTPI-Comb design incorporates three candidate sets, as defined in Section 2.3. In this section, we present the results when the compromise candidate set is used. The results for the other two candidate sets—conservative and aggressive—are detailed in the sensitivity analysis section to provide a comprehensive understanding of how each candidate set influences the optimization process.
Figure
2.
Simulation results of the uTPI-Comb, LOCRM12 and Cai designs.
With respect to the correct selection rate of the OBDC in scenarios 1–3 and 6, the uTPI-Comb design consistently outperforms the model-based designs. For instance, in scenario 6, the OBDC correct selection rate for the uTPI-Comb design is impressive 61.4%, whereas the LOCRM12 and Cai designs have lower rates of 44.8% and 40%, respectively, showing a substantial difference of approximately 20%. In scenarios 5, 8, 9, and 10, the uTPI-Comb design and the LOCRM12 design exhibit similar performance. However, the Cai design is behind in scenarios 5 and 9 and leads in scenario 8 and 10. In scenario 7, there is a notable difference of 5.8% in the OBDC correct selection rate between the uTPI-Comb design and the LOCRM12 design, with the latter also showing a higher rate of selecting overly toxic doses by 8.9%. This suggests that while LOCRM12 achieves a higher correct selection rate, it does so at the cost of reduced safety. Conversely, the uTPI-Comb design employs a more conservative dose allocation strategy. Therefore, considering the balance of risks and benefits, the uTPI-Comb design and the LOCRM12 design show comparable performance in scenario 7, both outperforming the Cai design.
The TDC correct selection rate of the uTPI-Comb design in scenarios 3–5 and 9 is better than that of the model-based designs. For example, in scenario 5, although the four designs perform equally in terms of the OBDC selection rate, the TDC correct selection rate of the uTPI-Comb design is as high as 62%, whereas those of the LOCRM12 design and Cai design are only 45.3% and 48.2%, respectively, with a gain of approximately 15%. This indicates that the uTPI-Comb design performs best in identifying TDC.
The overall performance concerning the average allocation of subjects to OBDC and TDC aligns closely with the correct selection rates for OBDC and TDC. When factoring in the overdose dose selection rate and the average allocation of subjects to overdose doses, the performance of the uTPI-Comb design surpasses that of the model-based designs in all scenarios except for scenario 10. For example, in scenario 2, the overdose dose selection rate and average number of subjects for the uTPI-Comb design are 10.3% and 4.8%, respectively; for the LOCRM12 design, they are 19.9% and 9.7%; and for the Cai design, they are as high as 47.9% and 25.3%. This indicates that the uTPI-Comb design achieves high OBDC correct selection rates while effectively controlling the risk of overdose doses, making it more efficient and safer than model-based designs. In scenario 10, where the focus is solely on toxicity, the uTPI-Comb design and the LOCRM12 design perform similarly, although slightly less effectively than the Cai design. In summary, model-based OBDC designs are sophisticated and demand substantial computational resources. Using the LOCRM to fit the efficacy probability model requires managing eight hyperparameters and typically involves more than 10 h to complete 1000 simulations. Moreover, LOCRM often exhibits limited robustness, performing poorly in terms of accuracy for most scenarios, although it can excel in certain situations. Additionally, it carries greater safety risks than model-assisted designs because of a greater likelihood of choosing overly toxic dose combinations, limiting its use in clinical environments. The uTPI-Comb design maintains its competitiveness in terms of safety, even under extreme conditions that prioritize toxicity management.
4.2
Sensitivity analysis
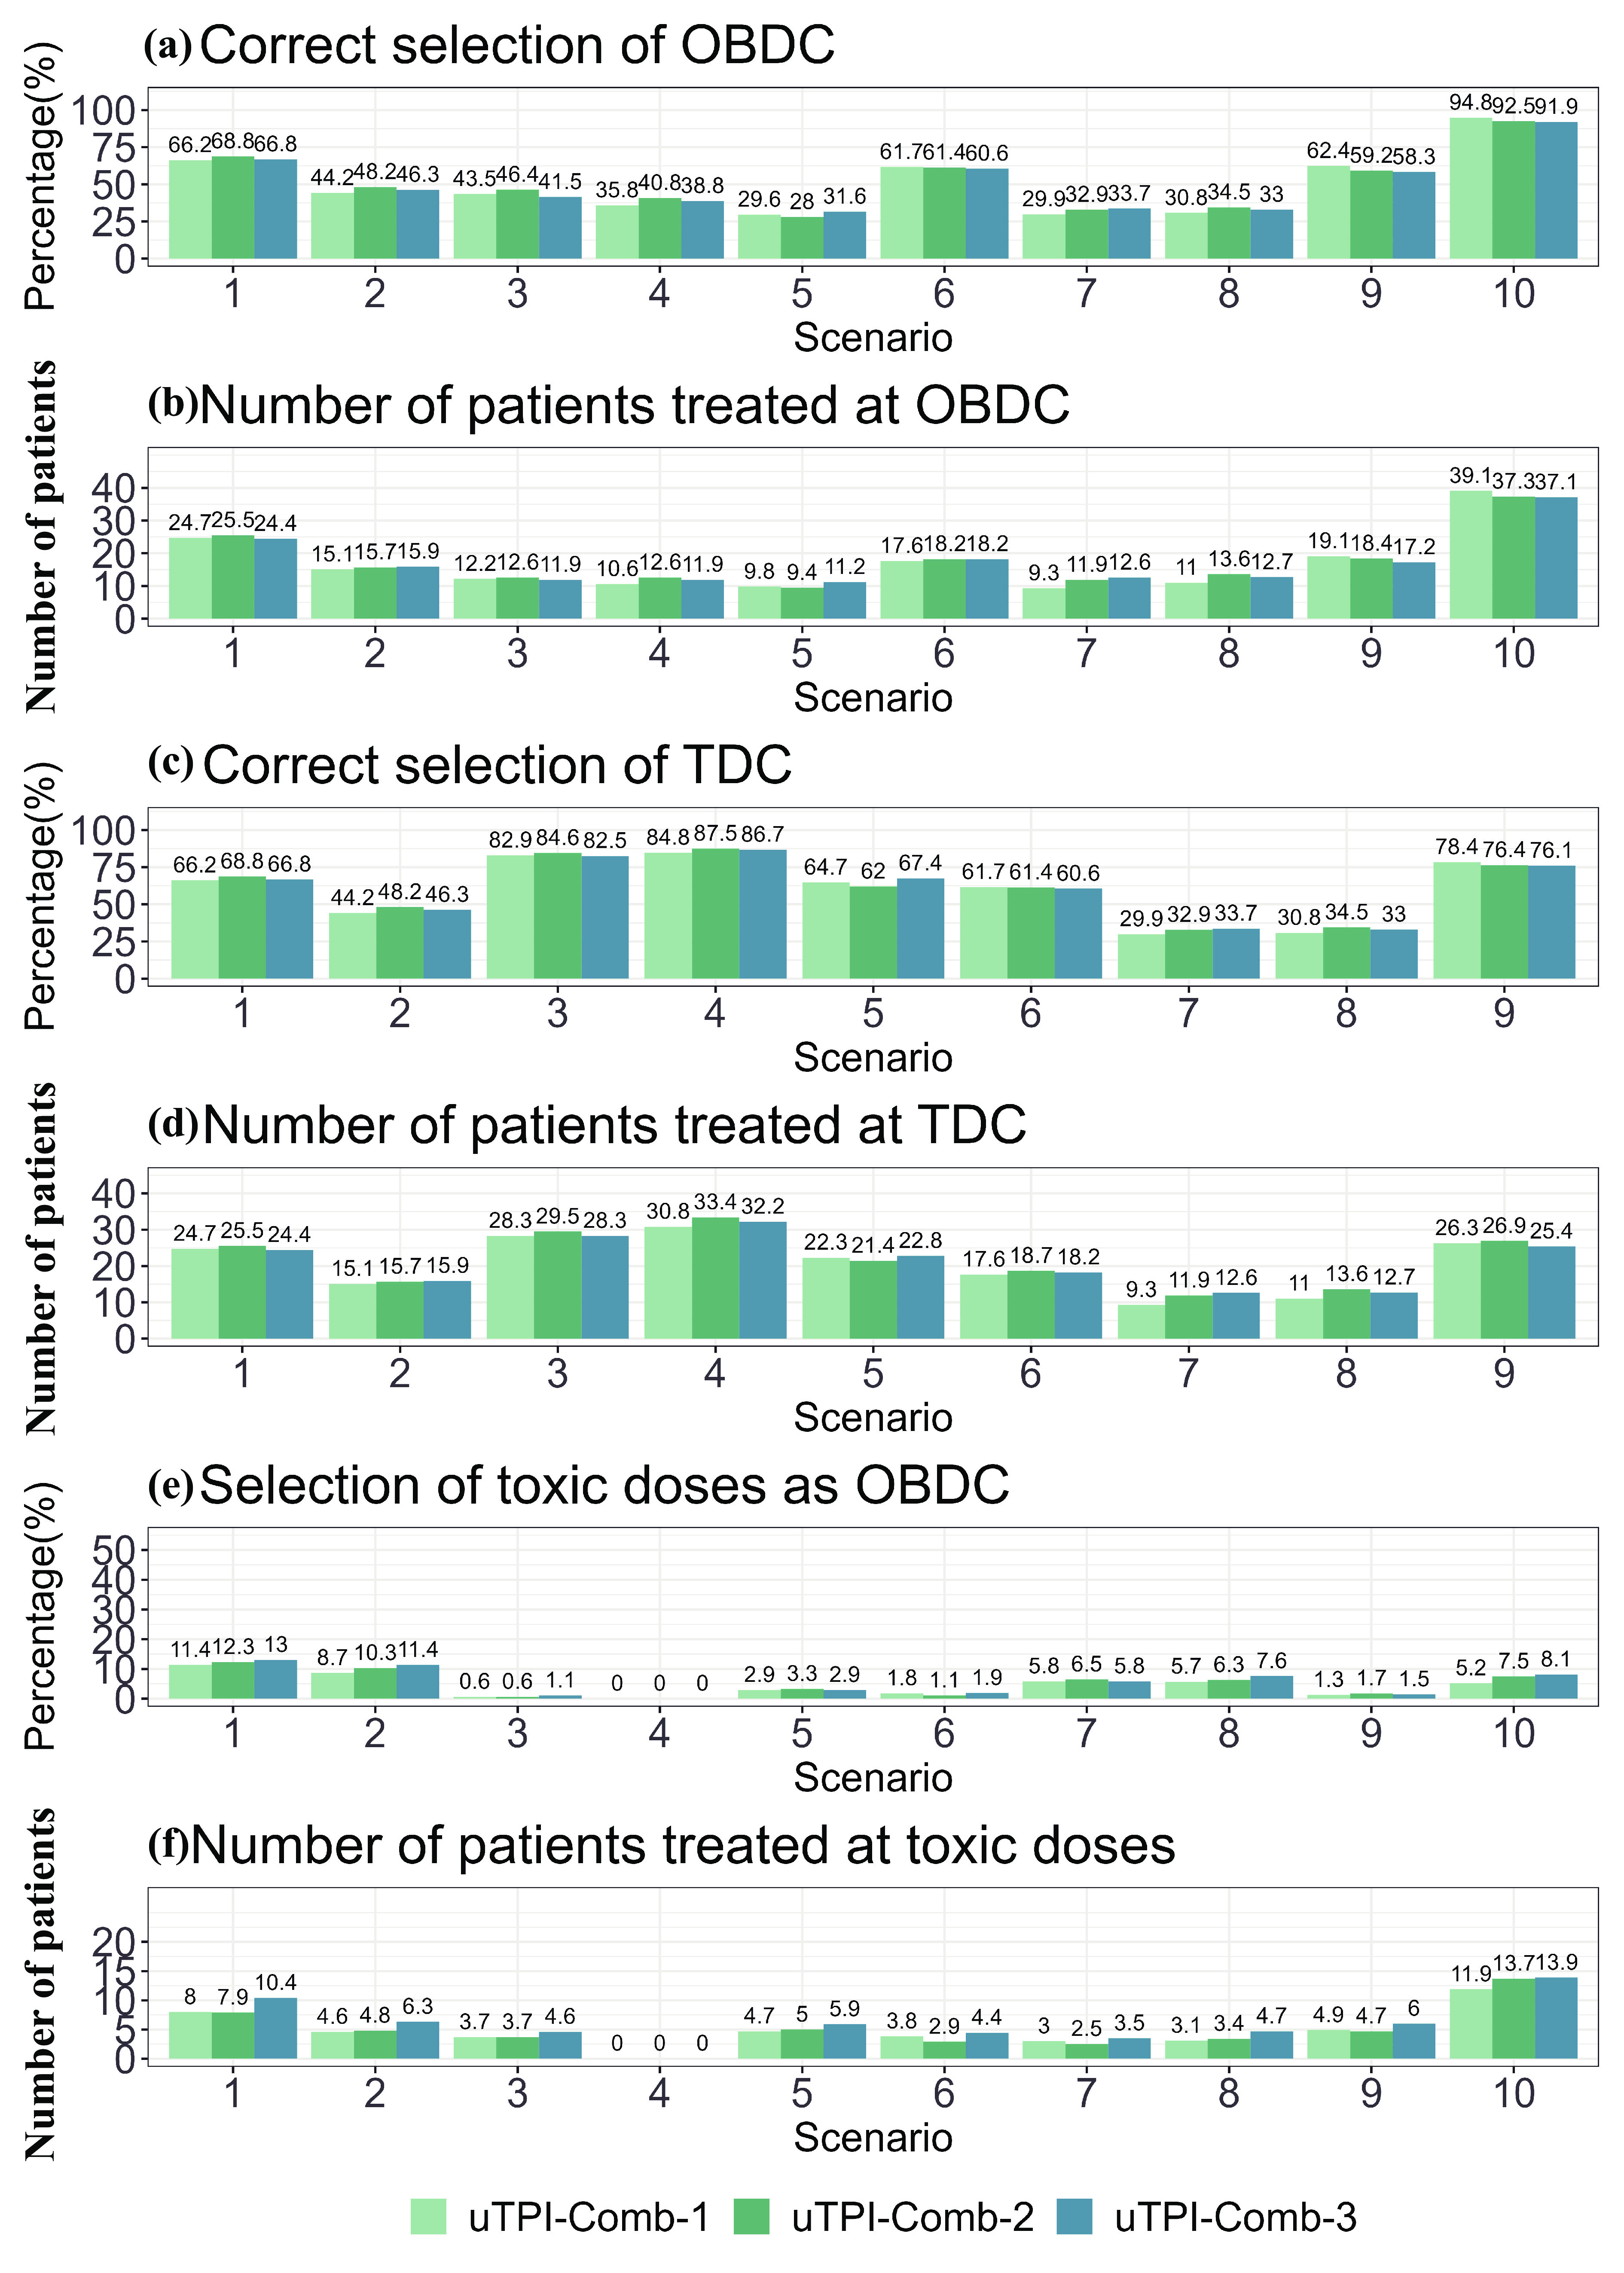
Fig. 3 displays the results of the uTPI-Comb design employing all three candidate sets defined in Section 2.3. In terms of the OBDC correct selection rate, uTPI-Comb using conservative and aggressive candidate sets shows similar performance, which is generally lower than that of the compromise candidate set. However, the compromise candidate set performs the worst in certain scenarios.
Figure
3.
Simulation results of the uTPI-Comb designs with different candidate sets.
For the OBDC average allocation and correct selection rate, the uTPI-Comb design achieves consistent performance across different candidate sets. In the TDC correct selection rate graph, where only scenarios 3–5 and 9 are considered, the performance across the three candidate sets exhibits little variation. Similarly, the graph depicting the average TDC allocation of participants indicates minimal differences in performance among the candidate sets.
In the over-toxic dose selection rate graph for Scenarios 3–10, the performance of the three candidate set definitions is similar. The graph representing the over-toxic dose average allocation of participants clearly demonstrates the safety implications associated with each candidate set choice: both conservative and compromise candidate sets yield comparable outcomes, whereas the aggressive candidate set leads to the highest risk of exposing participants to over-toxic doses. Despite this, the overall performance differences among the three candidate sets remain small, highlighting the subtle yet important effects of candidate set selection on trial outcomes.
In conclusion, the overall performance of the uTPI-Comb design, whether it uses conservative, compromise, or aggressive candidate sets, is closely matched. However, the safety of the uTPI-Comb design when aggressive candidate sets are employed is somewhat lower. Despite this, it proves to be the most efficient in certain specific scenarios. This demonstrates that while all three approaches are generally effective, the choice of candidate set can subtly influence the balance between efficacy and safety in clinical trial dose decisions.
5.
Discussion
Based on the decision candidate sets from the Maximum Tolerated Dose Combination (MTDC)-finding and the Optimal Biological Dose (OBD)-finding trials, this article introduces three types of zone-based local candidate sets ~A(i)P and ~A(i)C (i=1,2,3) for the Optimal Biological Dose Combination (OBDC)-finding trials. Given the established decision criteria and these newly defined decision candidate sets, a novel Bayesian adaptive dose allocation approach, i.e., uTPI-Comb is proposed for two agent OBDC-finding trials. The uTPI-Comb design combines the clear, structured approach of algorithm-based designs with the robust operational performance typical of model-based designs, offering flexibility to meet diverse clinical needs through the selection of appropriate decision candidate sets.
The simulation results show that the performance of the proposed uTPI-Comb design using three types of neighboring decision candidate sets is generally comparable, with conservative and compromise candidate sets performing similarly. The performance of uTPI-Comb with the aggressive candidate set is slightly worse in terms of safety but better in some special scenarios. In practice, the local candidate set should be specified on the basis of the advice of the clinical physician.
Furthermore, to demonstrate the operational characteristics of the proposed uTPI-Comb design, the LOCRM12 design and Cai design are selected for comparison. The simulation results show that in most scenarios, the uTPI-Comb design outperforms the LOCRM12 design in terms of the OBDC correct selection rate, is comparable to the LOCRM12 design in some scenarios, and performs slightly worse in a few scenarios. However, from the perspective of risk‒benefit balance, it is still comparable to the LOCRM12 design or superior to the LOCRM12 design in terms of the TDC correct selection rate. In scenarios with toxicity overdose, the safety of the uTPI-Comb design is greater. Specifically, the probability of the toxicity selection rate and the average distribution of toxicity doses among subjects are superior to those of the LOCRM12 design and significantly better than those of the Cai design.
The uTPI-Comb design is proposed to simplify the implementation of OBDC-finding trials while yielding a performance comparable to or even better than the model-based designs. As the uTPI-Comb design does not assume any parametric dose-toxicity and dose-efficacy curves, it is also more robust than model-based designs. The simulation results show that in most scenarios, the uTPI-Comb design outperforms the LOCRM12 design in terms of the OBDC correct selection rate. For computational efficiency, the uTPI-Comb design demonstrates remarkable speed, completing 1000 simulations in just 7 s, whereas the LOCRM12 design requires 12 h. The uTPI-Comb design can be fully tabulated prior to the implementation of the trials, facilitating a streamlined process. It relies solely on data from the current dose combination and the neighboring decision set, allowing swift decision-making through simple table look-ups without the need for intricate parameter specifications and model calibration. This efficiency makes the uTPI-Comb design particularly advantageous for clinical trial settings where time and resource efficiency are critical.
Acknowledgements
This work was supported by the Natural Science Foundation of Anhui Province (2022AH050703) and the National Natural Science Foundation of China (11671375).
Conflict of interest
The authors declare that they have no conflict of interest.
A novel model-assisted dose allocation method named uTPI-Comb was introduced, which incorporates a zone-based candidate set searching strategy to improve decision-making in dose escalation or de-escalation in combination therapies.
Comprehensive simulation studies show that the uTPI-Comb design speeds up the dose-finding process and greatly improves the identification of optimal biological dose combinations compared to conventional model-based approaches.
Jin H, Wang L, Bernards R. Rational combinations of targeted cancer therapies: background, advances and challenges. Nature Reviews Drug Discovery, 2023, 22 (3): 213–234. DOI: 10.1038/s41573-022-00615-z
[2]
Yuan Y, Lin R, Lee J J. Model-assisted Bayesian Designs for Dose Finding and Optimization: Methods and Applications. New York: CRC Press, 2022 .
[3]
Thall P F, Millikan R E, Mueller P, et al. Dose-finding with two agents in phase Ⅰ oncology trials. Biometrics, 2003, 59 (3): 487–496. DOI: 10.1111/1541-0420.00058
[4]
Harrington J A, Wheeler G M, Sweeting M J, et al. Adaptive designs for dual-agent phase Ⅰ dose-escalation studies. Nature Reviews Clinical Oncology, 2013, 10 (5): 277–288. DOI: 10.1038/nrclinonc.2013.35
[5]
Lin R, Yin G. Bayesian optimal interval design for dose finding in drug-combination trials. Statistical Methods in Medical Research, 2017, 26 (5): 2155–2167. DOI: 10.1177/0962280215594494
[6]
Oquigley J, Pepe M, Fisher L. Continual reassessment method: A practical design for phase-1 clinical-trials in cancer. Biometrics, 1990, 46 (1): 33–48. DOI: 10.2307/2531628
[7]
Liu S, Yuan Y. Bayesian optimal interval designs for phase Ⅰ clinical trials. Journal of the Royal Statistical Society Series C: Applied Statistics, 2015, 64 (3): 507–523. DOI: 10.1111/rssc.12089
[8]
Lin R, Yin G. STEIN: A simple toxicity and efficacy interval design for seamless phase Ⅰ/Ⅱ clinical trials. Statistics in Medicine, 2017, 36 (26): 4106–4120. DOI: 10.1002/sim.7428
[9]
Yan F, Mandrekar S J, Yuan Y. Keyboard: A novel bayesian toxicity probability interval design for phase Ⅰ clinical trials. Clinical Cancer Research, 2017, 23 (15): 3994–4003. DOI: 10.1158/1078-0432.CCR-17-0220
[10]
Takeda K, Taguri M, Morita S. BOIN-ET: Bayesian optimal interval design for dose finding based on both efficacy and toxicity outcomes. Pharmaceutical Statistics, 2018, 17 (4): 383–395. DOI: 10.1002/pst.1864
[11]
Zhou Y, Lee J J, Yuan Y. A utility-based Bayesian optimal interval (U-BOIN) phase Ⅰ/Ⅱ design to identify the optimal biological dose for targeted and immune therapies. Statistics in Medicine, 2019, 38 (28): S5299–S5316. DOI: 10.1002/sim.8361
[12]
Lin R, Zhou Y, Yan F, et al. BOIN12: Bayesian optimal interval phase Ⅰ/Ⅱ trial design for utility-based dose finding in immunotherapy and targeted therapies. JCO Precision Oncology, 2020, 4: 1393–1402. DOI: 10.1200/PO.20.00257
[13]
Takeda K, Morita S, Taguri M. TITE-BOIN-ET: Time-to-event Bayesian optimal interval design to accelerate dose-finding based on both efficacy and toxicity outcomes. Pharmaceutical Statistics, 2020, 19 (3): 335–349. DOI: 10.1002/pst.1995
[14]
Shi H, Cao J, Yuan Y, et al. uTPI: A utility-based toxicity probability interval design for phase Ⅰ/Ⅱ dose-finding trials. Statistics in Medicine, 2021, 40 (11): 2626–2649. DOI: 10.1002/sim.8922
[15]
Zhou Y, Lin R, Lee J J, et al. TITE-BOIN12: A Bayesian phase Ⅰ/Ⅱ trial design to find the optimal biological dose with late-onset toxicity and efficacy. Statistics in Medicine, 2022, 41 (11): 1918–1931. DOI: 10.1002/sim.9337
[16]
Mandrekar S J, Cui Y, Sargent D J. An adaptive phase I design for identifying a biologically optimal dose for dual agent drug combinations. Statistics in Medicine, 2007, 26 (11): 2317–2330. DOI: 10.1002/sim.2707
[17]
Yuan Y, Yin G. Bayesian phase Ⅰ/Ⅱ adaptively randomized oncology trials with combined drugs. Annals of Applied Statistics, 2011, 5 (2A): 924–942. DOI: 10.1214/10-AOAS433
[18]
Cai C Y, Yuan Y, Ji Y. A Bayesian dose finding design for oncology clinical trials of combinational biological agents. Journal of the Royal Statistical Society Series C: Applied Statistics, 2014, 63 (1): 159–173. DOI: 10.1111/rssc.12039
[19]
Wang Z, Zhang J, Xia T, et al. A Bayesian phase Ⅰ–Ⅱ clinical trial design to find the biological optimal dose on drug combination. Journal of Biopharmaceutical Statistics, 2023, 34 (4): 582–595. DOI: 10.1080/10543406.2023.2236208
[20]
Zhang J, Yan F, Wages N A, et al. Local continual reassessment methods for dose finding and optimization in drug-combination trials. Statistical Methods in Medical Research, 2023, 32 (10): 2049–2063. DOI: 10.1177/09622802231192955
[21]
Huang X, Biswas S, Oki Y, et al. A parallel phaseⅠ/Ⅱ clinical trial design for combination therapies. Biometrics, 2007, 63 (2): 429–436. DOI: 10.1111/j.1541-0420.2006.00685.x
[22]
Wages N A, Conaway M R, O'Quigley J. Continual reassessment method for partial ordering. Biometrics, 2011, 67 (4): 1555–1563. DOI: 10.1111/j.1541-0420.2011.01560.x
[23]
Shimamura, F, Hamada C, Matsui S, et al. Two-stage approach based on zone and dose findings for two-agent combination Phase Ⅰ/Ⅱ trials. Journal of Biopharmaceutical Statistics, 2018, 28 (6): 1025–1037. DOI: 10.1080/10543406.2018.1434190
[24]
Pan H, Lin R, Zhou Y, et al. Keyboard design for phase Ⅰ drug-combination trials. Contemporary Clinical Trials, 2020, 92: 105972. DOI: 10.1016/j.cct.2020.105972
Figure
1.
(a) Illustration of zones in the partial order of the dose–toxicity relationship in drug combination trials; (b) zone-based local and global candidate dose decision sets.
Figure
2.
Simulation results of the uTPI-Comb, LOCRM12 and Cai designs.
Figure
3.
Simulation results of the uTPI-Comb designs with different candidate sets.
References
[1]
Jin H, Wang L, Bernards R. Rational combinations of targeted cancer therapies: background, advances and challenges. Nature Reviews Drug Discovery, 2023, 22 (3): 213–234. DOI: 10.1038/s41573-022-00615-z
[2]
Yuan Y, Lin R, Lee J J. Model-assisted Bayesian Designs for Dose Finding and Optimization: Methods and Applications. New York: CRC Press, 2022 .
[3]
Thall P F, Millikan R E, Mueller P, et al. Dose-finding with two agents in phase Ⅰ oncology trials. Biometrics, 2003, 59 (3): 487–496. DOI: 10.1111/1541-0420.00058
[4]
Harrington J A, Wheeler G M, Sweeting M J, et al. Adaptive designs for dual-agent phase Ⅰ dose-escalation studies. Nature Reviews Clinical Oncology, 2013, 10 (5): 277–288. DOI: 10.1038/nrclinonc.2013.35
[5]
Lin R, Yin G. Bayesian optimal interval design for dose finding in drug-combination trials. Statistical Methods in Medical Research, 2017, 26 (5): 2155–2167. DOI: 10.1177/0962280215594494
[6]
Oquigley J, Pepe M, Fisher L. Continual reassessment method: A practical design for phase-1 clinical-trials in cancer. Biometrics, 1990, 46 (1): 33–48. DOI: 10.2307/2531628
[7]
Liu S, Yuan Y. Bayesian optimal interval designs for phase Ⅰ clinical trials. Journal of the Royal Statistical Society Series C: Applied Statistics, 2015, 64 (3): 507–523. DOI: 10.1111/rssc.12089
[8]
Lin R, Yin G. STEIN: A simple toxicity and efficacy interval design for seamless phase Ⅰ/Ⅱ clinical trials. Statistics in Medicine, 2017, 36 (26): 4106–4120. DOI: 10.1002/sim.7428
[9]
Yan F, Mandrekar S J, Yuan Y. Keyboard: A novel bayesian toxicity probability interval design for phase Ⅰ clinical trials. Clinical Cancer Research, 2017, 23 (15): 3994–4003. DOI: 10.1158/1078-0432.CCR-17-0220
[10]
Takeda K, Taguri M, Morita S. BOIN-ET: Bayesian optimal interval design for dose finding based on both efficacy and toxicity outcomes. Pharmaceutical Statistics, 2018, 17 (4): 383–395. DOI: 10.1002/pst.1864
[11]
Zhou Y, Lee J J, Yuan Y. A utility-based Bayesian optimal interval (U-BOIN) phase Ⅰ/Ⅱ design to identify the optimal biological dose for targeted and immune therapies. Statistics in Medicine, 2019, 38 (28): S5299–S5316. DOI: 10.1002/sim.8361
[12]
Lin R, Zhou Y, Yan F, et al. BOIN12: Bayesian optimal interval phase Ⅰ/Ⅱ trial design for utility-based dose finding in immunotherapy and targeted therapies. JCO Precision Oncology, 2020, 4: 1393–1402. DOI: 10.1200/PO.20.00257
[13]
Takeda K, Morita S, Taguri M. TITE-BOIN-ET: Time-to-event Bayesian optimal interval design to accelerate dose-finding based on both efficacy and toxicity outcomes. Pharmaceutical Statistics, 2020, 19 (3): 335–349. DOI: 10.1002/pst.1995
[14]
Shi H, Cao J, Yuan Y, et al. uTPI: A utility-based toxicity probability interval design for phase Ⅰ/Ⅱ dose-finding trials. Statistics in Medicine, 2021, 40 (11): 2626–2649. DOI: 10.1002/sim.8922
[15]
Zhou Y, Lin R, Lee J J, et al. TITE-BOIN12: A Bayesian phase Ⅰ/Ⅱ trial design to find the optimal biological dose with late-onset toxicity and efficacy. Statistics in Medicine, 2022, 41 (11): 1918–1931. DOI: 10.1002/sim.9337
[16]
Mandrekar S J, Cui Y, Sargent D J. An adaptive phase I design for identifying a biologically optimal dose for dual agent drug combinations. Statistics in Medicine, 2007, 26 (11): 2317–2330. DOI: 10.1002/sim.2707
[17]
Yuan Y, Yin G. Bayesian phase Ⅰ/Ⅱ adaptively randomized oncology trials with combined drugs. Annals of Applied Statistics, 2011, 5 (2A): 924–942. DOI: 10.1214/10-AOAS433
[18]
Cai C Y, Yuan Y, Ji Y. A Bayesian dose finding design for oncology clinical trials of combinational biological agents. Journal of the Royal Statistical Society Series C: Applied Statistics, 2014, 63 (1): 159–173. DOI: 10.1111/rssc.12039
[19]
Wang Z, Zhang J, Xia T, et al. A Bayesian phase Ⅰ–Ⅱ clinical trial design to find the biological optimal dose on drug combination. Journal of Biopharmaceutical Statistics, 2023, 34 (4): 582–595. DOI: 10.1080/10543406.2023.2236208
[20]
Zhang J, Yan F, Wages N A, et al. Local continual reassessment methods for dose finding and optimization in drug-combination trials. Statistical Methods in Medical Research, 2023, 32 (10): 2049–2063. DOI: 10.1177/09622802231192955
[21]
Huang X, Biswas S, Oki Y, et al. A parallel phaseⅠ/Ⅱ clinical trial design for combination therapies. Biometrics, 2007, 63 (2): 429–436. DOI: 10.1111/j.1541-0420.2006.00685.x
[22]
Wages N A, Conaway M R, O'Quigley J. Continual reassessment method for partial ordering. Biometrics, 2011, 67 (4): 1555–1563. DOI: 10.1111/j.1541-0420.2011.01560.x
[23]
Shimamura, F, Hamada C, Matsui S, et al. Two-stage approach based on zone and dose findings for two-agent combination Phase Ⅰ/Ⅱ trials. Journal of Biopharmaceutical Statistics, 2018, 28 (6): 1025–1037. DOI: 10.1080/10543406.2018.1434190
[24]
Pan H, Lin R, Zhou Y, et al. Keyboard design for phase Ⅰ drug-combination trials. Contemporary Clinical Trials, 2020, 92: 105972. DOI: 10.1016/j.cct.2020.105972


 DownLoad: